

S&P 500
Upwards movement has continued as the bigger picture for the Elliott wave count expected, although a little more sideways movement was expected first.
Summary: The next target for a pullback or consolidation to begin is now at 2,918. The upwards trend remains intact.
The final target remains the same at 3,045.
The biggest picture, Grand Super Cycle analysis, is here.
This week monthly charts will be reviewed.
ELLIOTT WAVE COUNTS
MAIN WAVE COUNT
MONTHLY CHART
Click chart to enlarge.
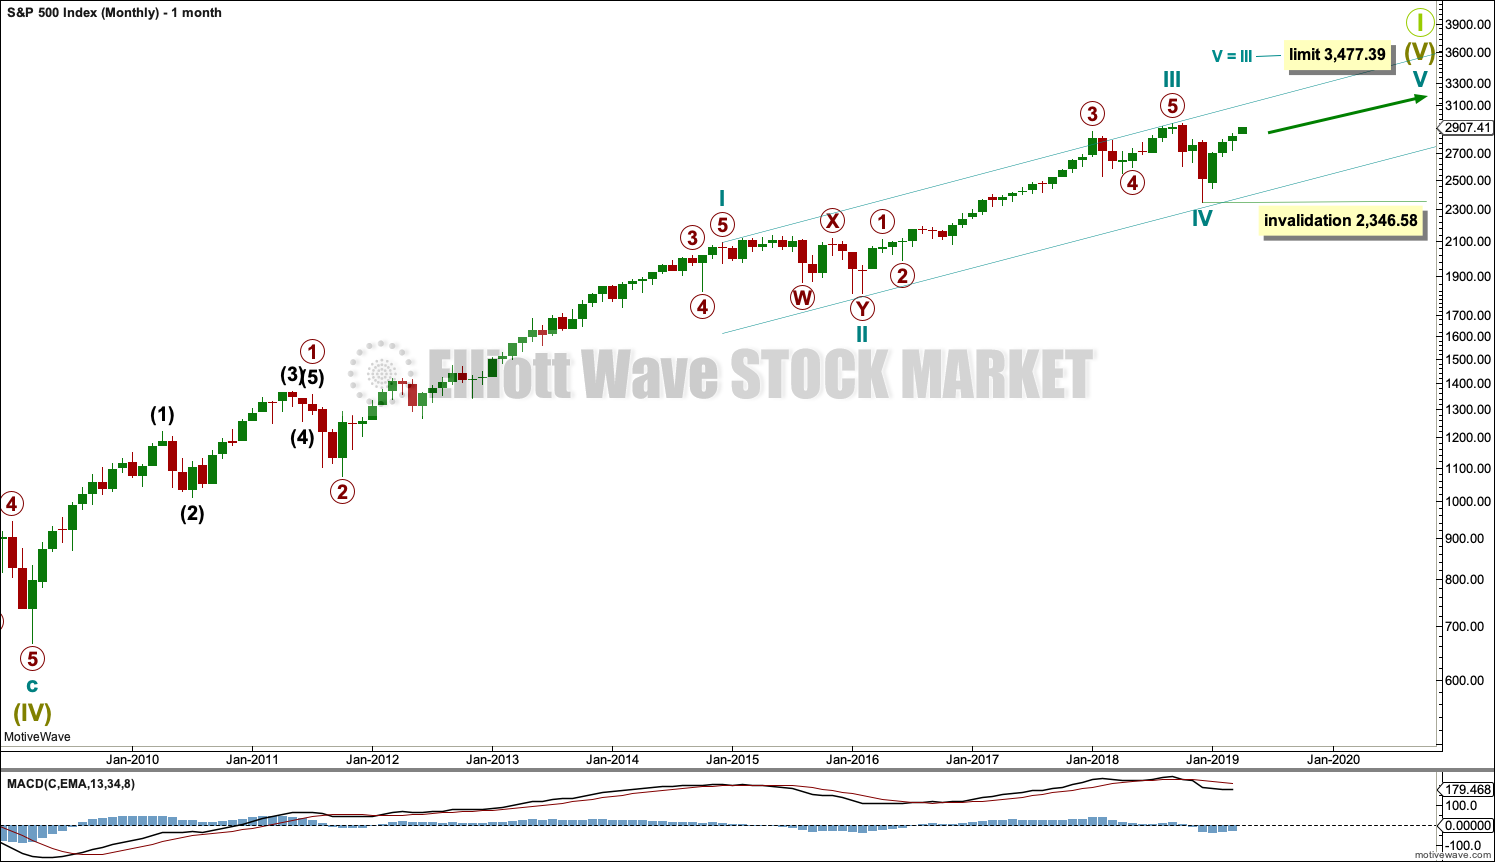
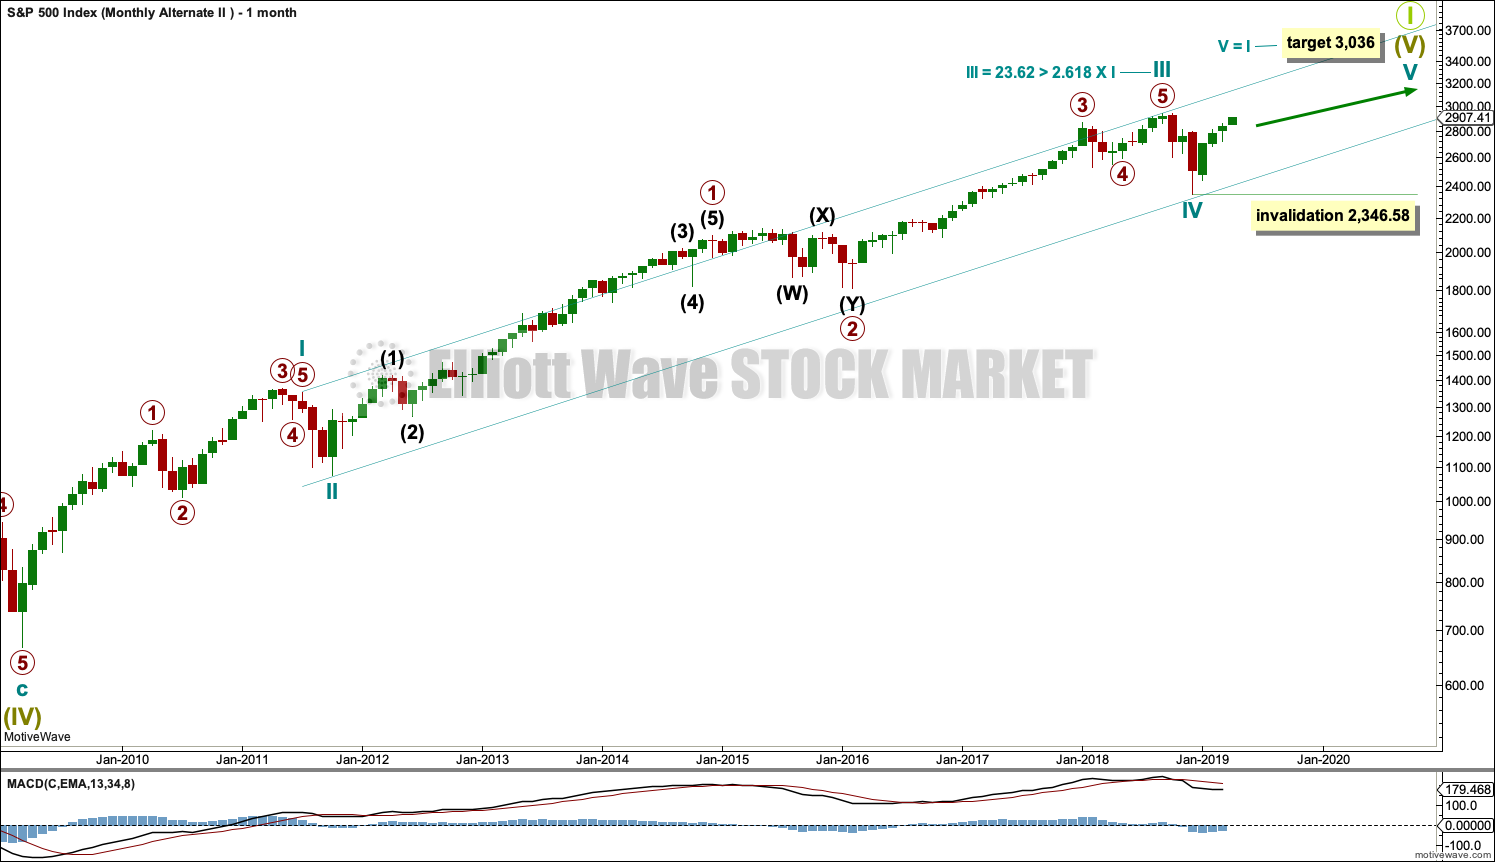
Super Cycle wave (IV) completed a 8.5 year correction. Thereafter, a bull market began for Super Cycle wave (V). The structure of Super Cycle wave (V) is incomplete. It is subdividing as an impulse.
There is no Fibonacci ratio between cycle waves I and III within Super Cycle wave (V). Cycle wave V will be limited to no longer than equality with cycle wave III, so that cycle wave III is not the shortest actionary wave.
A channel is drawn about the impulse of Super Cycle wave (V) using Elliott’s first technique. Cycle wave IV found support about the lower edge.
There is perfect alternation between a shallow time consuming combination for cycle wave II and now a deeper and more brief double zigzag for cycle wave IV. The speed and depth of cycle wave IV makes these two corrections look like they should be labelled the same degree. This wave count has the right look.
The middle of the third wave overshoots the upper edge of the Elliott channel drawn about this impulse. All remaining movement is contained within the channel. This has a typical look.
Within cycle wave V, no second wave correction may move beyond the start of its first wave below 2,346.58.
This wave count expects MACD to begin to exhibit divergence with price as price makes new highs. Cycle wave III may exhibit strongest momentum and cycle wave V may exhibit some weakness. If price makes new highs but MACD does not, then this would remain the main wave count.
Within Super Cycle wave (V), cycle wave III may not be the shortest actionary wave. Because cycle wave III is shorter than cycle wave I, this limits cycle wave V to no longer than equality in length with cycle wave III at 3,477.39. A target is calculated for cycle wave V to end prior to this point.
This wave count agrees with MACD. Cycle wave III exhibits strongest momentum, and primary wave 3 within cycle wave III exhibits the strongest histogram within MACD.
WEEKLY CHART
Click chart to enlarge.
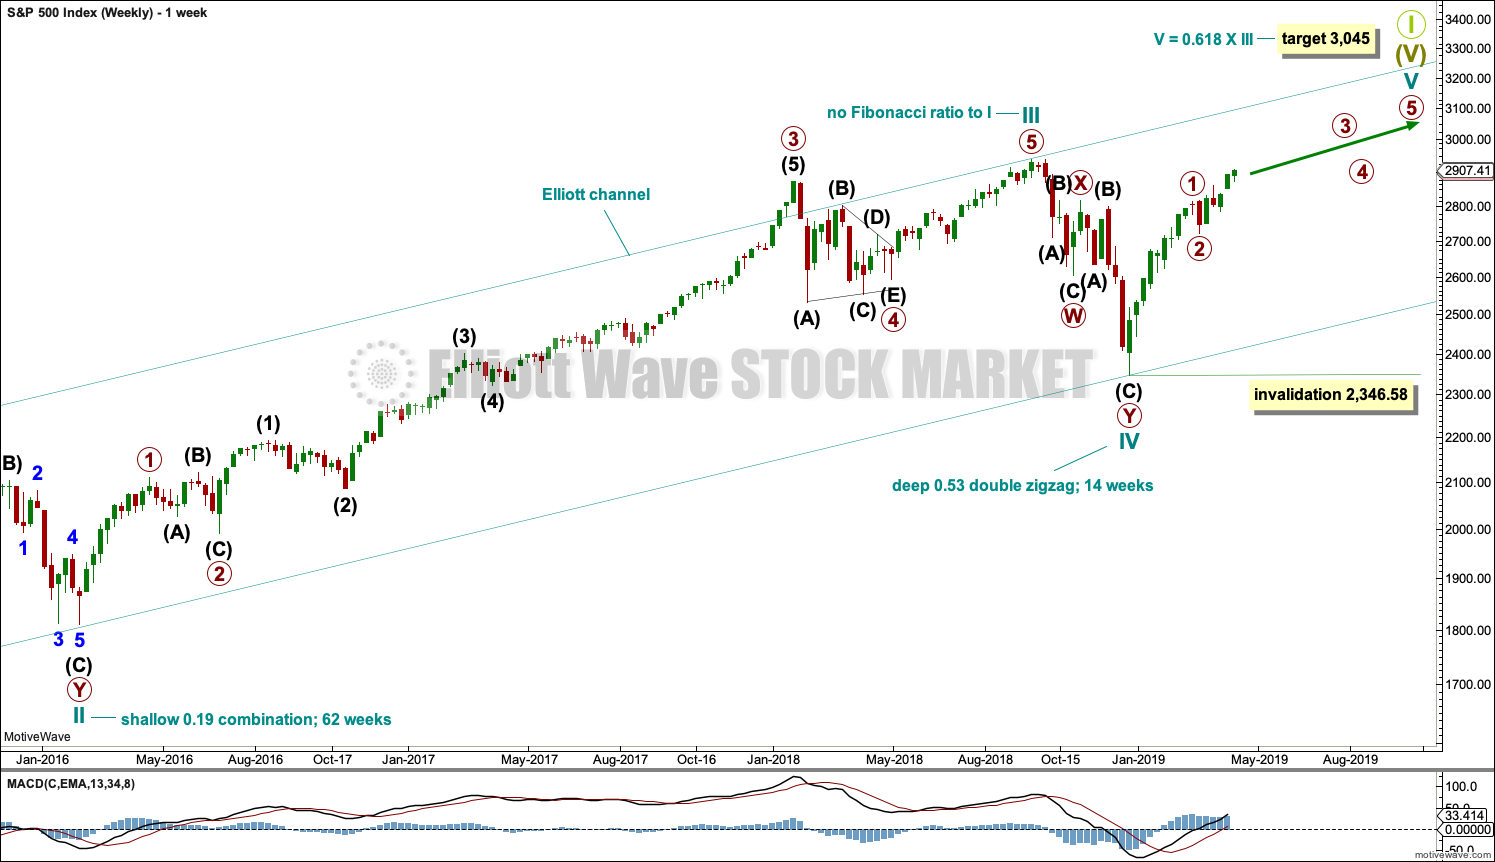
This weekly chart shows all of cycle waves III, IV and V so far.
Cycle wave II fits as a time consuming double combination: flat – X – zigzag. Combinations tend to be more time consuming corrective structures than zigzags. Cycle wave IV has completed as a multiple zigzag that should be expected to be more brief than cycle wave II.
Cycle wave IV may have ended at the lower edge of the Elliott channel.
Within cycle wave V, no second wave correction may move beyond the start of its first wave below 2,346.58.
Although both cycle waves II and IV are labelled W-X-Y, they are different corrective structures. There are two broad groups of Elliott wave corrective structures: the zigzag family, which are sharp corrections, and all the rest, which are sideways corrections. Multiple zigzags belong to the zigzag family and combinations belong to the sideways family. There is perfect alternation between the possible double zigzag of cycle wave IV and the combination of cycle wave II.
Although there is gross disproportion between the duration of cycle waves II and IV, the size of cycle wave IV in terms of price makes these two corrections look like they should be labelled at the same degree. Proportion is a function of either or both of price and time.
Draw the Elliott channel about Super Cycle wave (V) with the first trend line from the end of cycle wave I (at 2,079.46 on the week beginning 30th November 2014) to the high of cycle wave III, then place a parallel copy on the low of cycle wave II. Cycle wave V may find resistance about the upper edge.
It is possible that cycle wave V may end in October 2019. If it does not end there, or if the AD line makes new all time highs during or after June 2019, then the expectation for cycle wave V to end would be pushed out to March 2020 as the next possibility. Thereafter, the next possibility may be October 2020. March and October are considered as likely months for a bull market to end as in the past they have been popular. That does not mean though that this bull market may not end during any other month.
DAILY CHART
Click chart to enlarge.
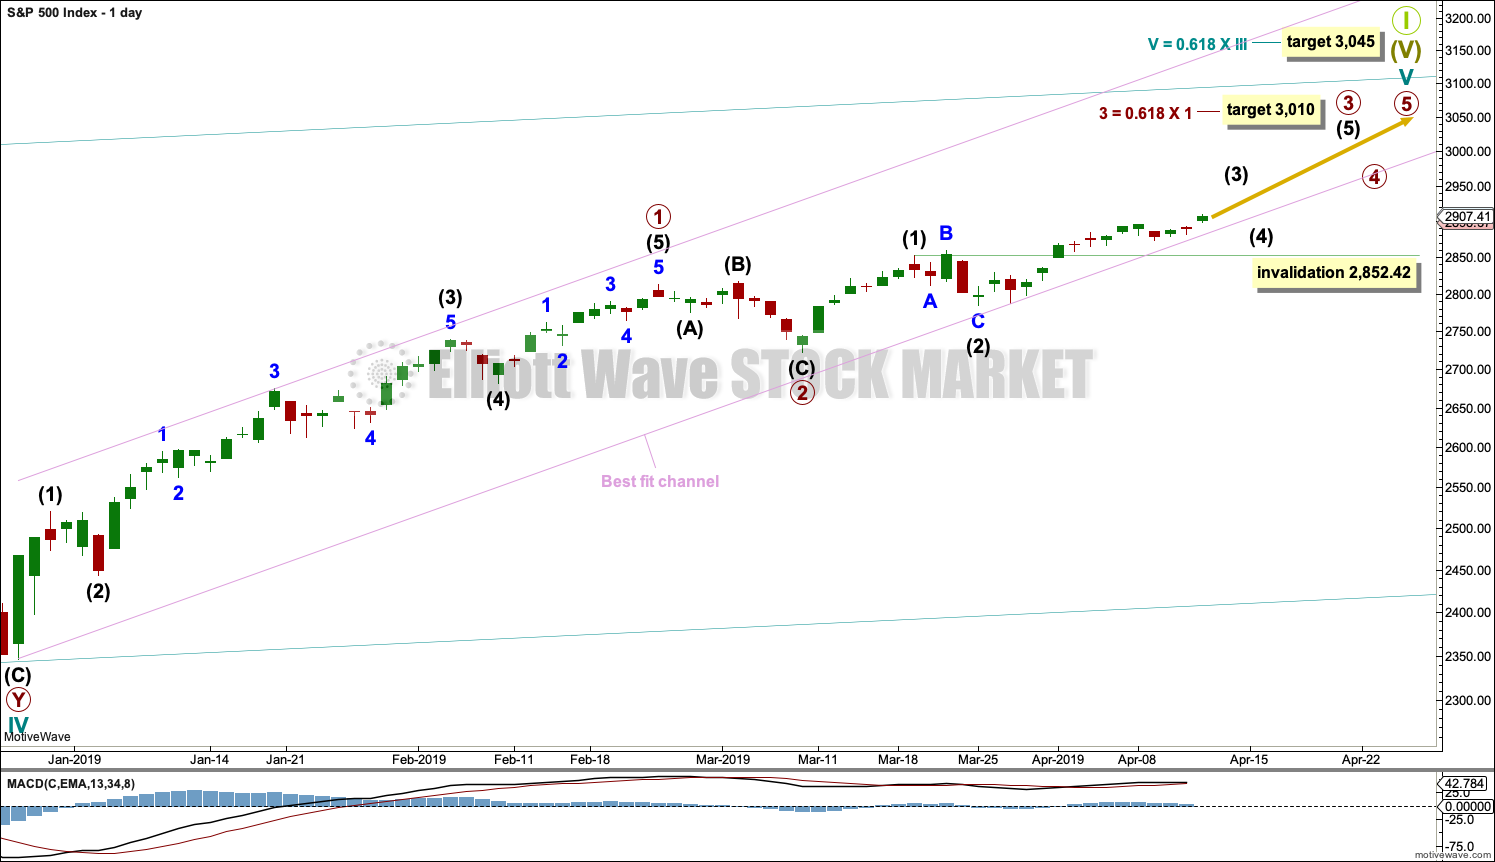
The daily chart will focus on the structure of cycle wave V.
Cycle wave V must subdivide as a five wave motive structure, either an impulse or an ending diagonal. An impulse is much more common and that will be how it is labelled. A diagonal would be considered if overlapping suggests it.
Primary wave 2 may have been a very brief and shallow expanded flat correction.
Within primary wave 3, intermediate waves (1) and (2) may be complete. Intermediate wave (3) is now relabelled as incomplete after Friday’s new high.
When intermediate wave (3) is complete, then intermediate wave (4) may not move into intermediate wave (1) price territory below 2,852.42.
The channel shows where small pullbacks are finding support. It may continue to do so, but the S&P does not always fit well within channels. It is possible that the channel may be breached and price may continue higher to find resistance at the lower edge of the channel.
ALTERNATE WAVE COUNT
MONTHLY CHART
Click chart to enlarge.
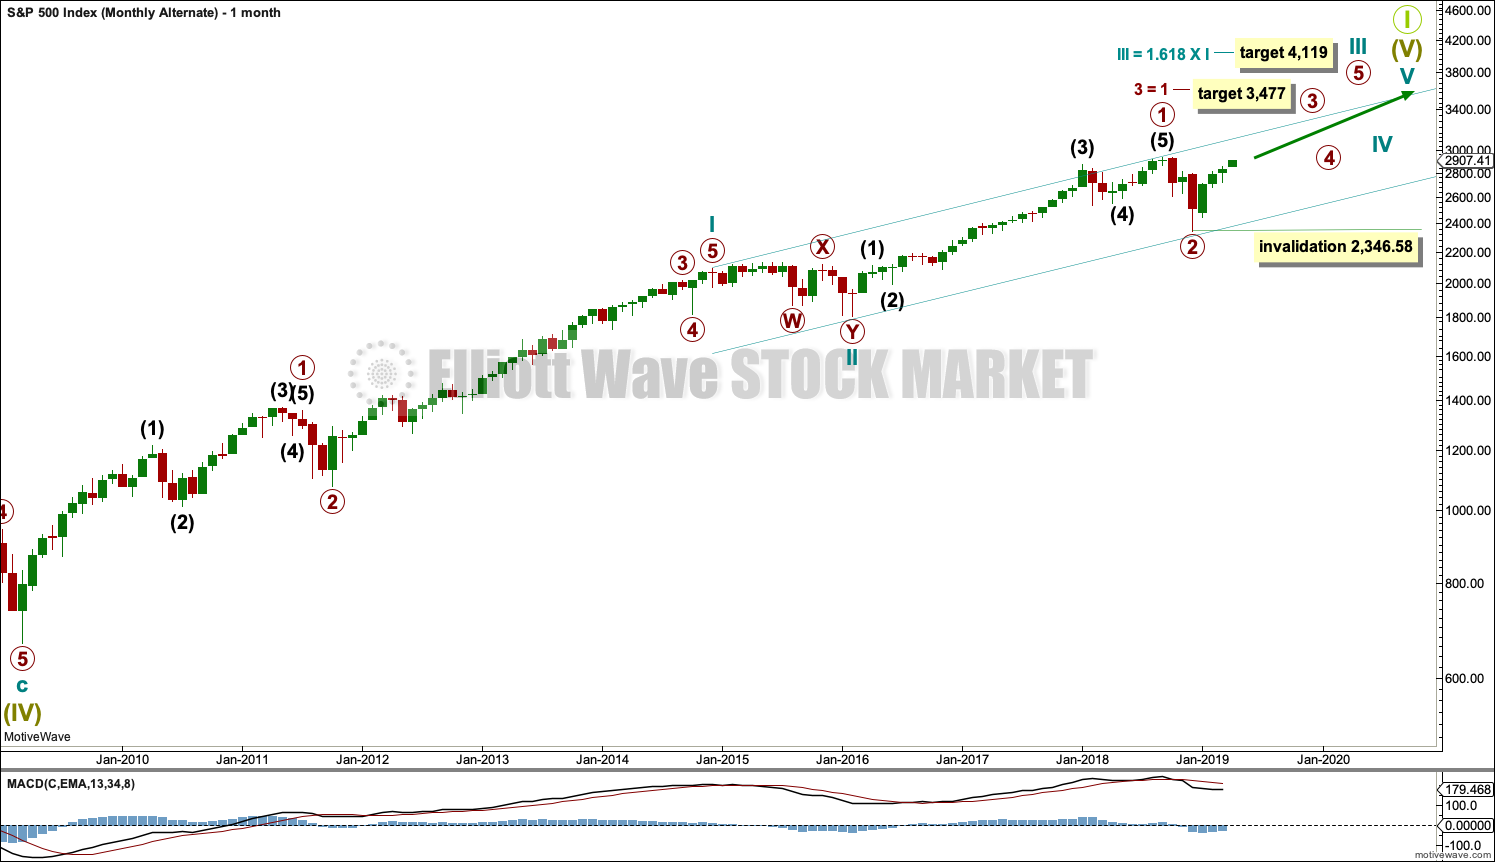
It is time to consider a more bullish wave count because the AD line is making new all time highs and the end of this bull market now would be extremely likely to be a bare minimum of 4 months away, and likely longer.
If the degree of labelling is moved down within cycle wave III, then it is possible that the last high was only primary wave 1. Cycle wave III may be extending.
Only two actionary waves within an impulse may extend. Cycle wave I was extended. If cycle wave III also extends, then cycle wave V may not extend.
A target is calculated for primary wave 3 to end. If price gets up to this target and the structure is incomplete, or if price keeps rising through the target, then a new higher target would then be calculated.
Within primary wave 3, no second wave correction may move beyond the start of its first wave below 2,346.58.
This wave count expects MACD to indicate stronger momentum as price makes a new all time high. If that happens, then this may be switched to be the main wave count.
The channel drawn here is an acceleration channel. The channel may be redrawn as price makes new highs. When cycle wave III may be complete, then this channel would be an Elliott channel and may show where cycle wave IV may find support.
This wave count has no limit on upwards movement.
SECOND ALTERNATE WAVE COUNT
MONTHLY CHART
Click chart to enlarge.
It is also possible that cycle wave I was over earlier and did not extend. Cycle wave III may have been over at the last all time high and did extend.
Within cycle wave III, both primary waves 2 and 4 are more time consuming than cycle waves II and IV. This is possible and does occasionally happen when waves extend as they do so both in price and time, but it does give the wave count an odd look.
The channel is drawn using Elliott’s first technique. It shows where cycle wave IV found support. However, the upper edge of the channel is breached by much of cycle wave III and not just the strongest portion of it. This does not have a typical look.
This wave count still agrees with MACD. Cycle wave III exhibits strongest momentum, and primary wave 3 within cycle wave III exhibits the strongest histogram within MACD.
This wave count has no limit on upwards movement.
TECHNICAL ANALYSIS
MONTHLY CHART
Click chart to enlarge. Chart courtesy of StockCharts.com.
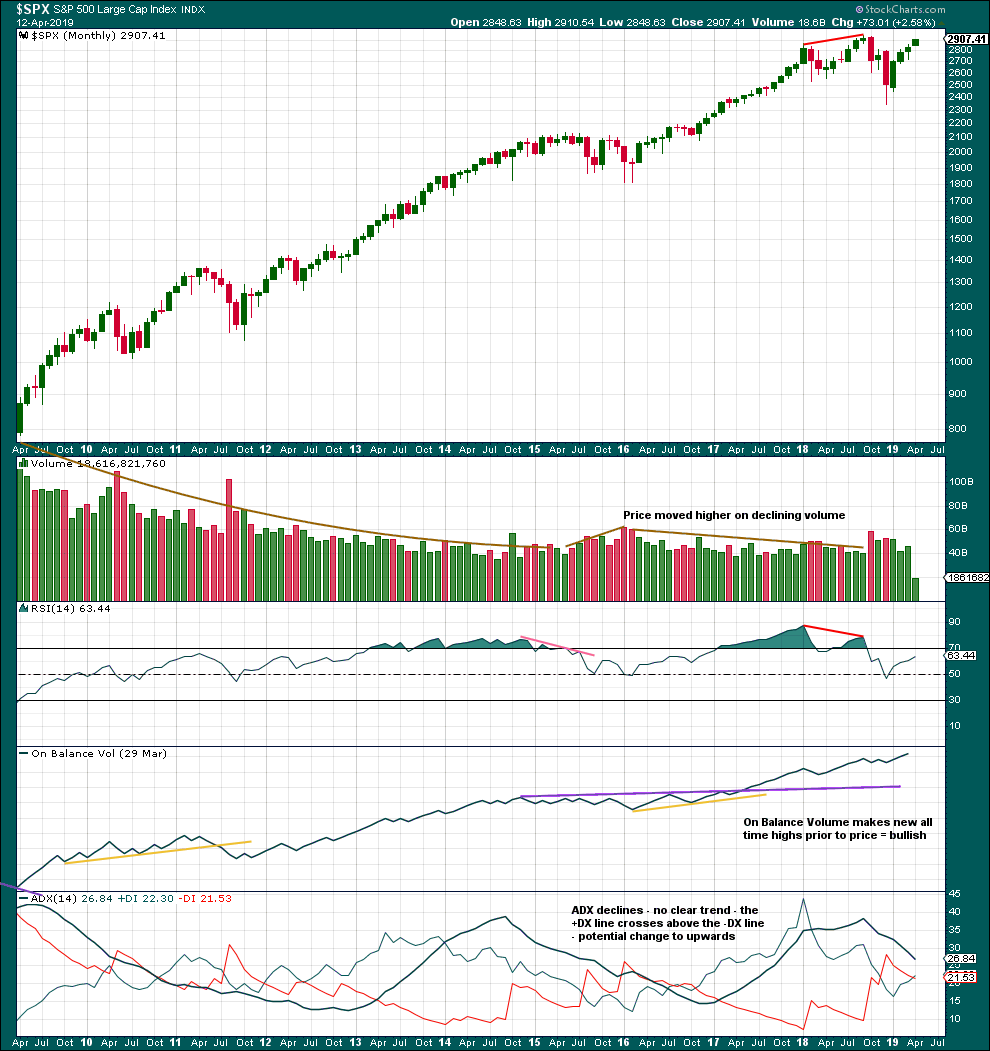
Price moving higher on declining volume has been a feature of this bull market since 2009. This may fit the larger picture that sees this bull market as a Super Cycle degree fifth wave. Fifth waves should exhibit some weakness; they do not always have support from volume.
RSI indicates the main monthly wave count may be more likely. It reached into overbought towards the end of both cycle waves I and III for that wave count.
WEEKLY CHART
Click chart to enlarge. Chart courtesy of StockCharts.com.
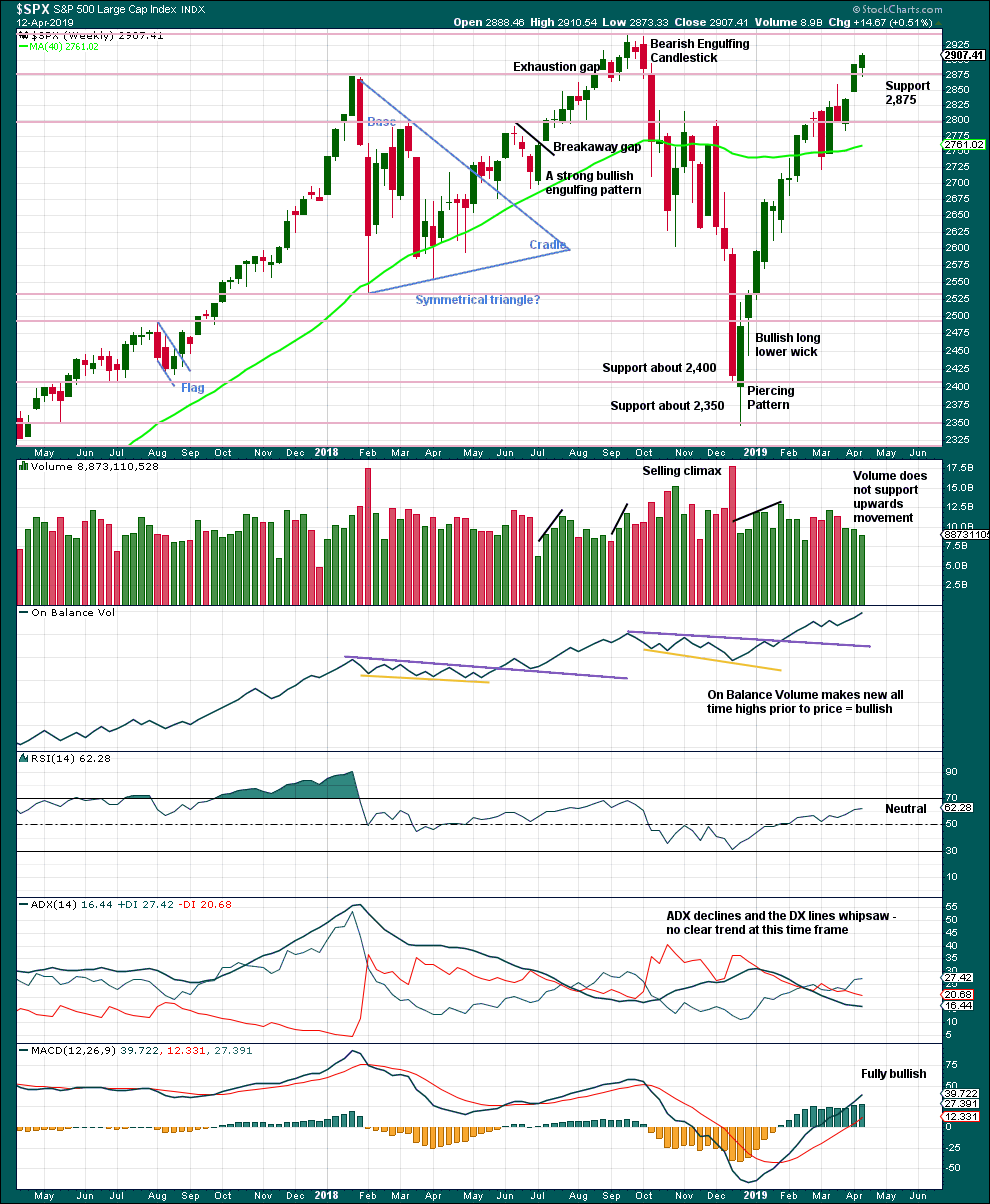
Resistance about 2,880 has been overcome. Next resistance is about the prior all time high about 2,940.
On Balance Volume makes another new all time high this week strongly supporting the Elliott wave count.
A decline in volume while price moves higher is not of concern given current market conditions. This has been a feature of this market for a long time and yet price continues higher.
DAILY CHART
Click chart to enlarge. Chart courtesy of StockCharts.com.
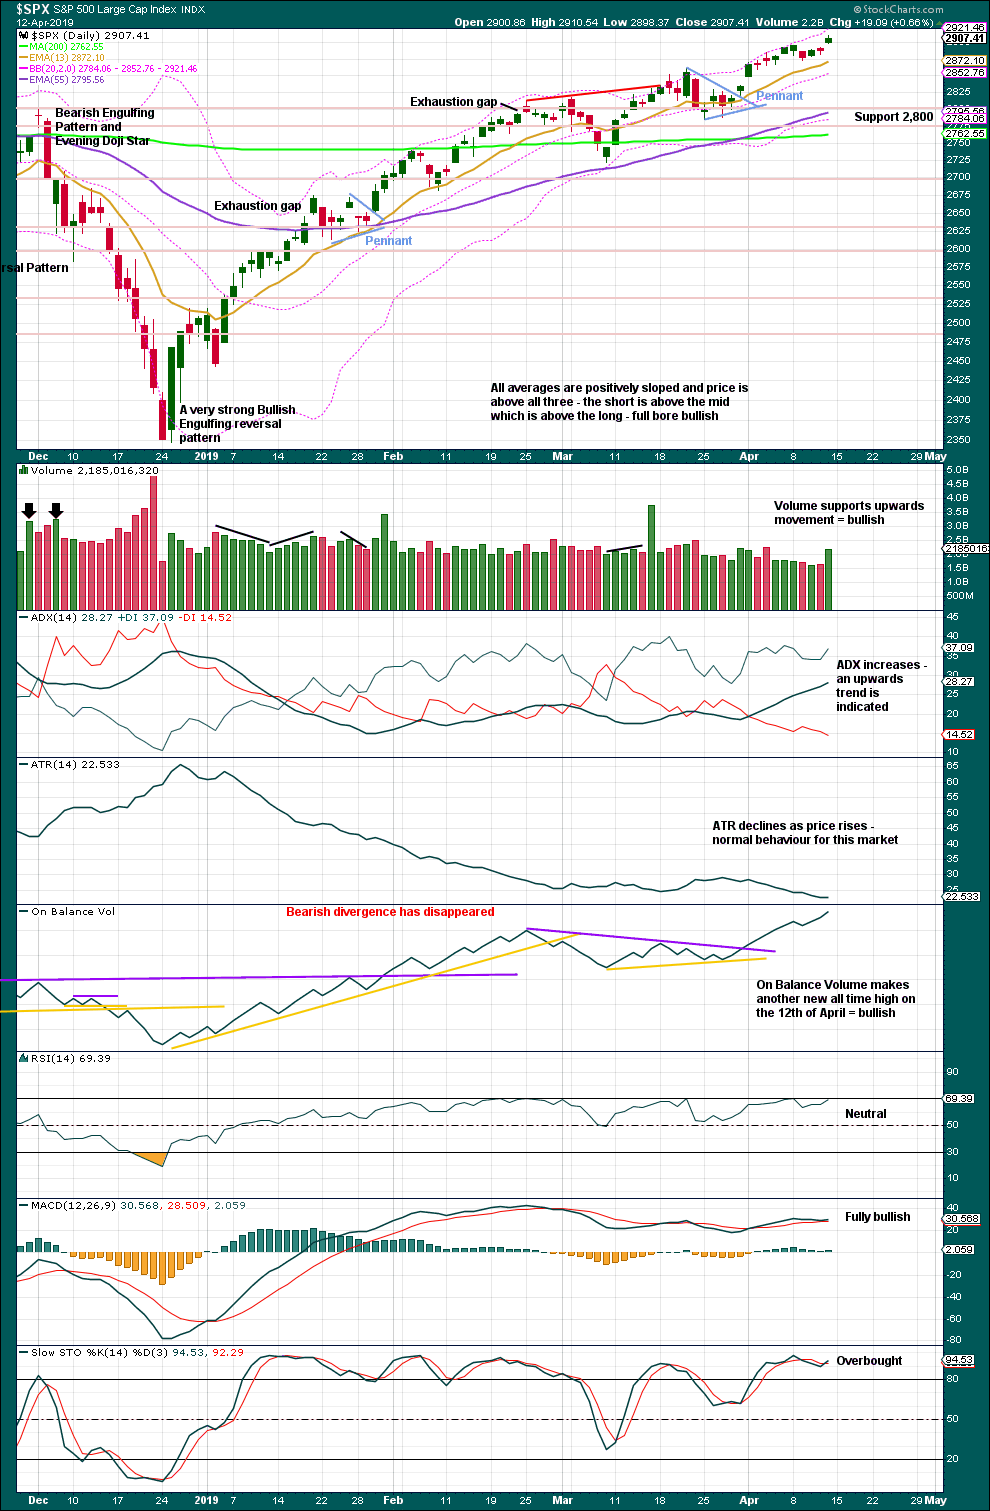
The December 2018 low is expected to remain intact. The two 90% upwards days on 26th December 2018 and 6th January 2019 indicate this upwards trend has internal strength.
Lowry’s data shows that on the 8th of April Selling Pressure has reached another new low for this bull market, and Buying Power has reached a new high for this rally. This indicates an expansion in demand and a contraction in supply, which has historically been associated with strong phases of bull markets. This strongly supports the Elliott wave count, which expects new all time highs to come this year.
While the last swing low of the 25th of March remains intact, there exists a series of higher highs and higher lows from the major low in December 2018. It would be safest to assume the upwards trend remains intact.
The pennant pattern is a reliable short-term continuation pattern. A target calculated using the flag pole is about 2,956.
A gap up on Friday may be another breakaway gap from a very small consolidation. It may provide support at 2,893.42. The breakaway is supported by volume for the short term.
BREADTH – AD LINE
WEEKLY CHART
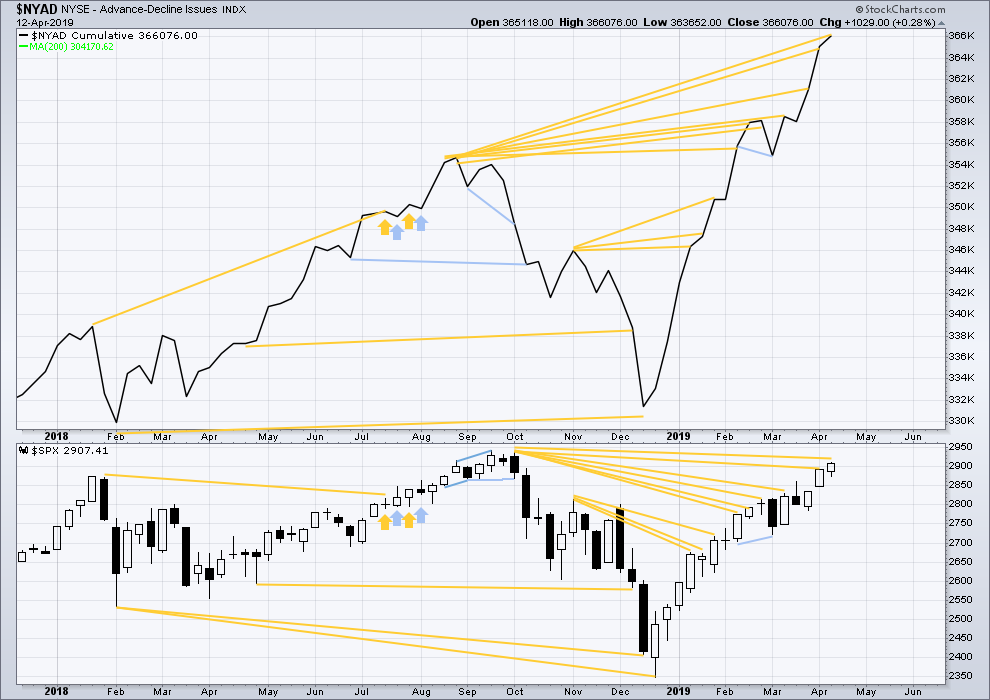
Click chart to enlarge. Chart courtesy of StockCharts.com. So that colour blind members are included, bearish signals
will be noted with blue and bullish signals with yellow.
Every single bear market from the Great Depression and onwards has been preceded by a minimum of 4 months divergence between price and the AD line. With the AD line making a new all time high again last week, the end of this bull market and the start of a new bear market must be a minimum of 4 months away, which is the end of July 2019 at this time.
This week the AD line makes another new all time high. Bullish mid-term divergence continues.
Both mid and large caps have made new swing highs above the prior highs of the 25th of February, but small caps have not. This indicates some selectivity within this upwards trend.
DAILY CHART
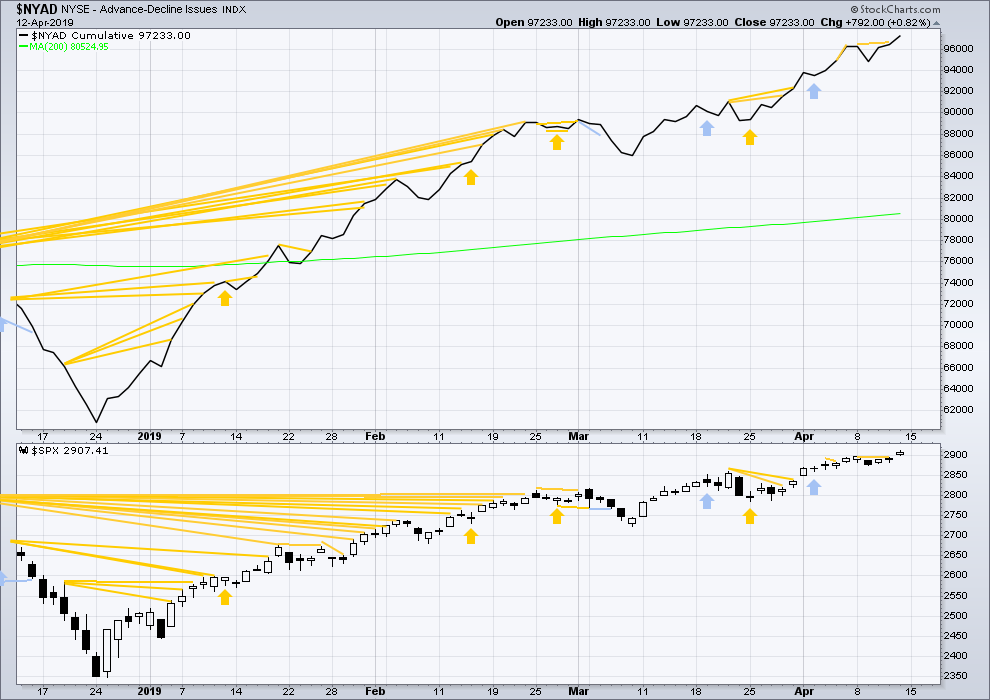
Click chart to enlarge. Chart courtesy of StockCharts.com. So that colour blind members are included, bearish signals
will be noted with blue and bullish signals with yellow.
Breadth should be read as a leading indicator.
Recent short-term bullish divergence has now been followed by upwards movement. Today both price and the AD line moved higher. Upwards movement has support from rising market breadth.
VOLATILITY – INVERTED VIX CHART
WEEKLY CHART
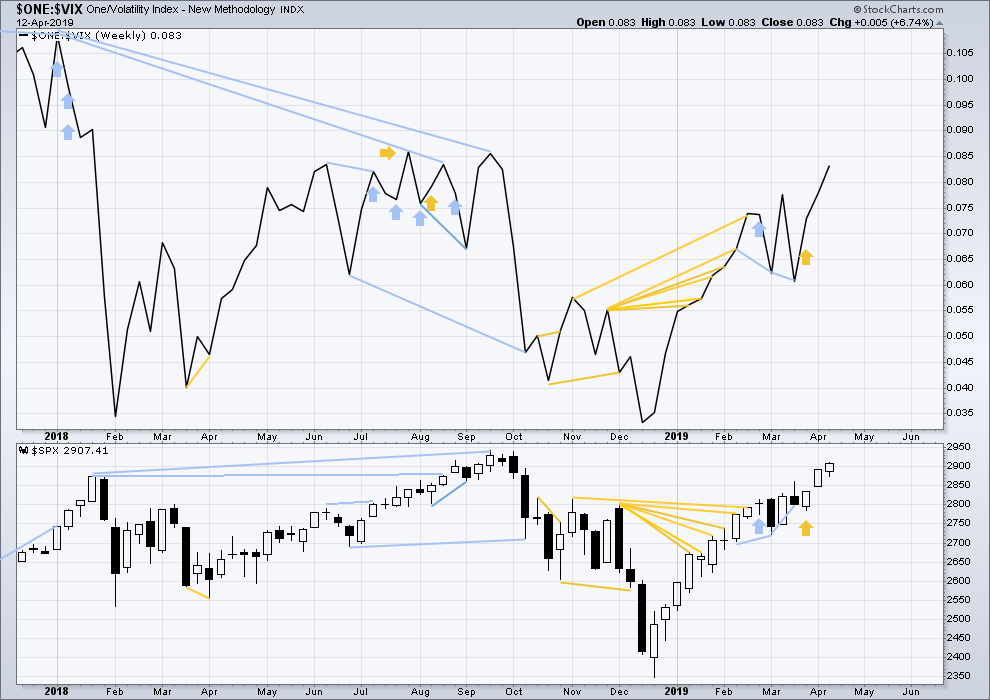
Click chart to enlarge. Chart courtesy of StockCharts.com. So that colour blind members are included, bearish signals
will be noted with blue and bullish signals with yellow.
This week both price and inverted VIX have moved higher. There is no mid or short-term divergence. Long-term divergence between all time highs remains.
DAILY CHART
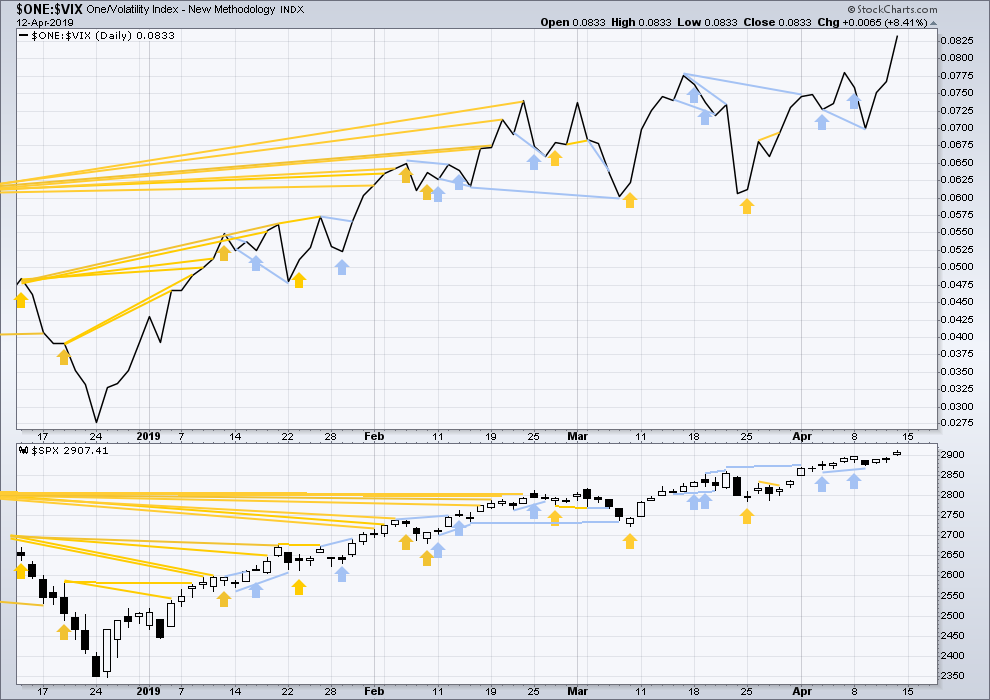
Click chart to enlarge. Chart courtesy of StockCharts.com. So that colour blind members are included, bearish signals
will be noted with blue and bullish signals with yellow.
Both price and inverted VIX moved higher on Friday. There is no new short-term divergence.
DOW THEORY
Dow Theory confirmed a bear market in December 2018. This does not necessarily mean a bear market at Grand Super Cycle degree though; Dow Theory makes no comment on Elliott wave counts. On the 25th of August 2015 Dow Theory also confirmed a bear market. The Elliott wave count sees that as part of cycle wave II. After Dow Theory confirmation of a bear market in August 2015, price went on to make new all time highs and the bull market continued.
DJIA: 23,344.52 – a close on the 19th of December at 23,284.97 confirms a bear market.
DJT: 9,806.79 – price has closed below this point on the 13th of December.
S&P500: 2,532.69 – a close on the 19th of December at 2,506.96 provides support to a bear market conclusion.
Nasdaq: 6,630.67 – a close on the 19th of December at 6,618.86 provides support to a bear market conclusion.
With all the indices moving now higher, Dow Theory would confirm a bull market if the following highs are made:
DJIA: 26,951.81
DJT: 11,623.58
S&P500: 2,940.91
Nasdaq: 8,133.30.
GOLD
A small range inside day fits short-term expectations for the Elliott wave count.
Summary: For the very short term, a little sideways or higher movement may find resistance about 1,298 on Monday. Thereafter, the downwards trend may resume.
The Elliott wave target is at 1,220. Risk is just above 1,310.17.
Three long-term targets are now calculated for cycle wave c to end. Confidence in a new downwards trend may be had with a new low below 1,160.75.
Grand SuperCycle analysis is here.
Last monthly charts are here. Video is here.
MAIN ELLIOTT WAVE COUNT
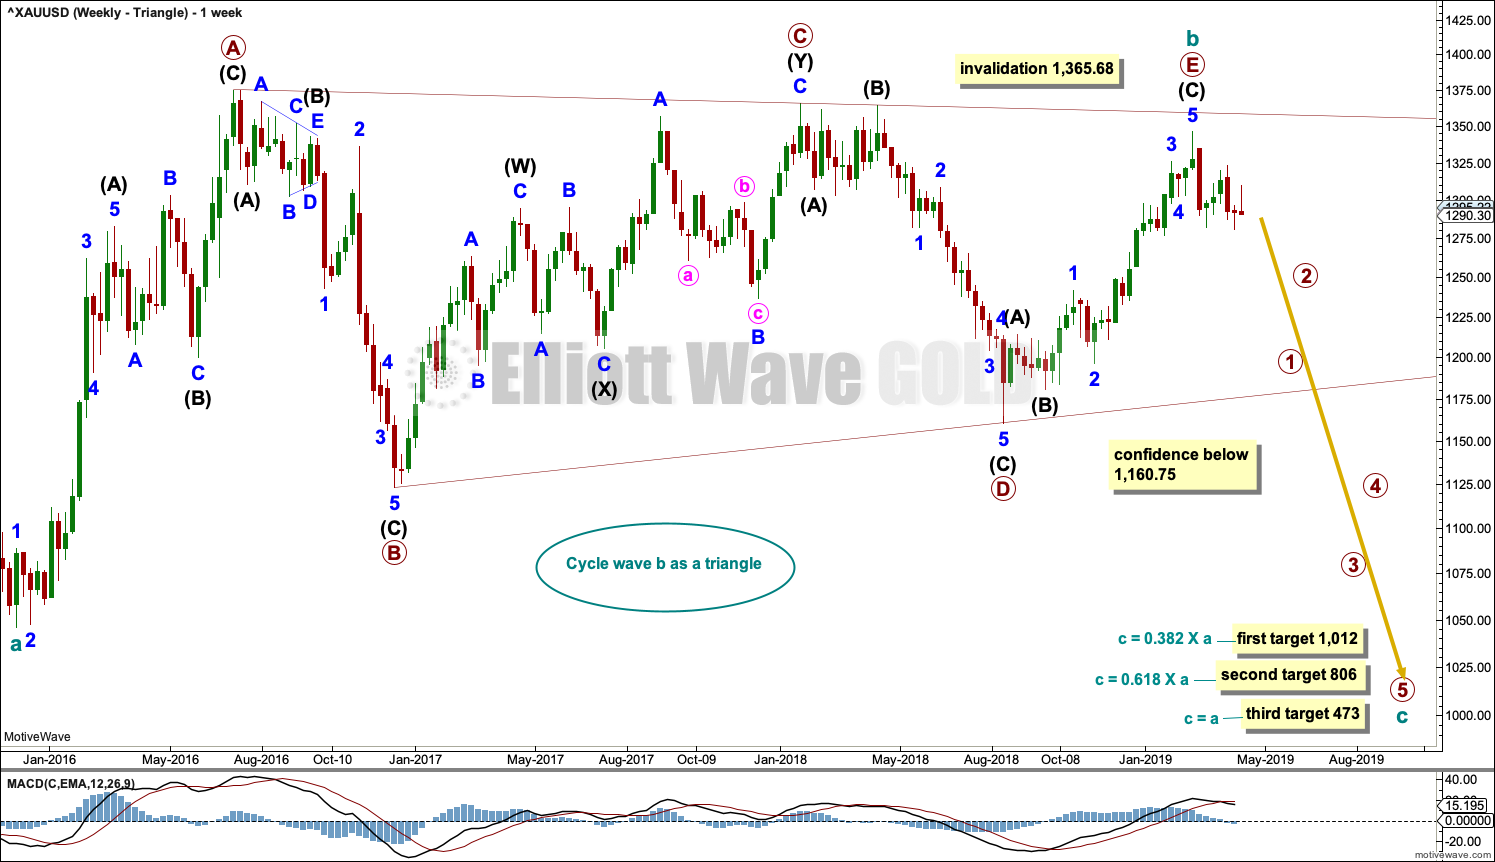
WEEKLY CHART – TRIANGLE
Click chart to enlarge.
This is the preferred wave count.
Cycle wave b may be a complete regular contracting triangle. If it continues further, then primary wave E may not move beyond the end of primary wave C above 1,365.68.
Four of the five sub-waves of a triangle must be zigzags, with only one sub-wave allowed to be a multiple zigzag. Wave C is the most common sub-wave to subdivide as a multiple, and this is how primary wave C for this example fits best.
There are no problems in terms of subdivisions or rare structures for this wave count. It has an excellent fit and so far a typical look.
This wave count would expect a cycle degree trend change has recently occurred. Cycle wave c would most likely make new lows below the end of cycle wave a at 1,046.27 to avoid a truncation.
Primary wave E has exhibited reasonable weakness as it came to an end. Triangles often end with declining ATR, weak momentum and weak volume.
If this weekly wave count is correct, then cycle wave c downwards should develop strength, ATR should show some increase, and MACD should exhibit an increase in downwards momentum.
Three targets are calculated for cycle wave c. Cycle wave a lasted 4.25 years. Cycle wave b may be over in 3.17 years. Cycle wave c may last a minimum of 2 years and possibly up to 5 years.
DAILY CHART – TRIANGLE

Click chart to enlarge.
Cycle wave c must subdivide as a five wave structure, either an impulse or an ending diagonal. An impulse is much more common and that shall be how it is labelled unless overlapping suggests a diagonal should be considered.
A new trend at cycle degree should begin with a five wave structure on the daily chart, which will be labelled minor wave 1.
Minor wave 2 is now labelled as a complete triple zigzag.
A base channel is drawn about minor waves 1 and 2. There will be bounces and consolidations on the way down. The last bounce has found resistance at the upper edge of the base channel. Towards its middle or end the power of a third wave may be able to break below support at the lower edge of the base channel.
Minor wave 3 may only subdivide as an impulse. Within the impulse, minute waves i and ii may now be complete and minute wave iii may only subdivide as an impulse. Within minute wave iii, no second wave correction may move beyond its start above 1,310.17.
It is possible that minute wave iii and / or minor wave 3 may end with a selling climax; either or both may exhibit a swift and strong fifth wave to end the impulse. This behaviour is typical of commodities, and this tendency is especially prevalent for third wave impulses.
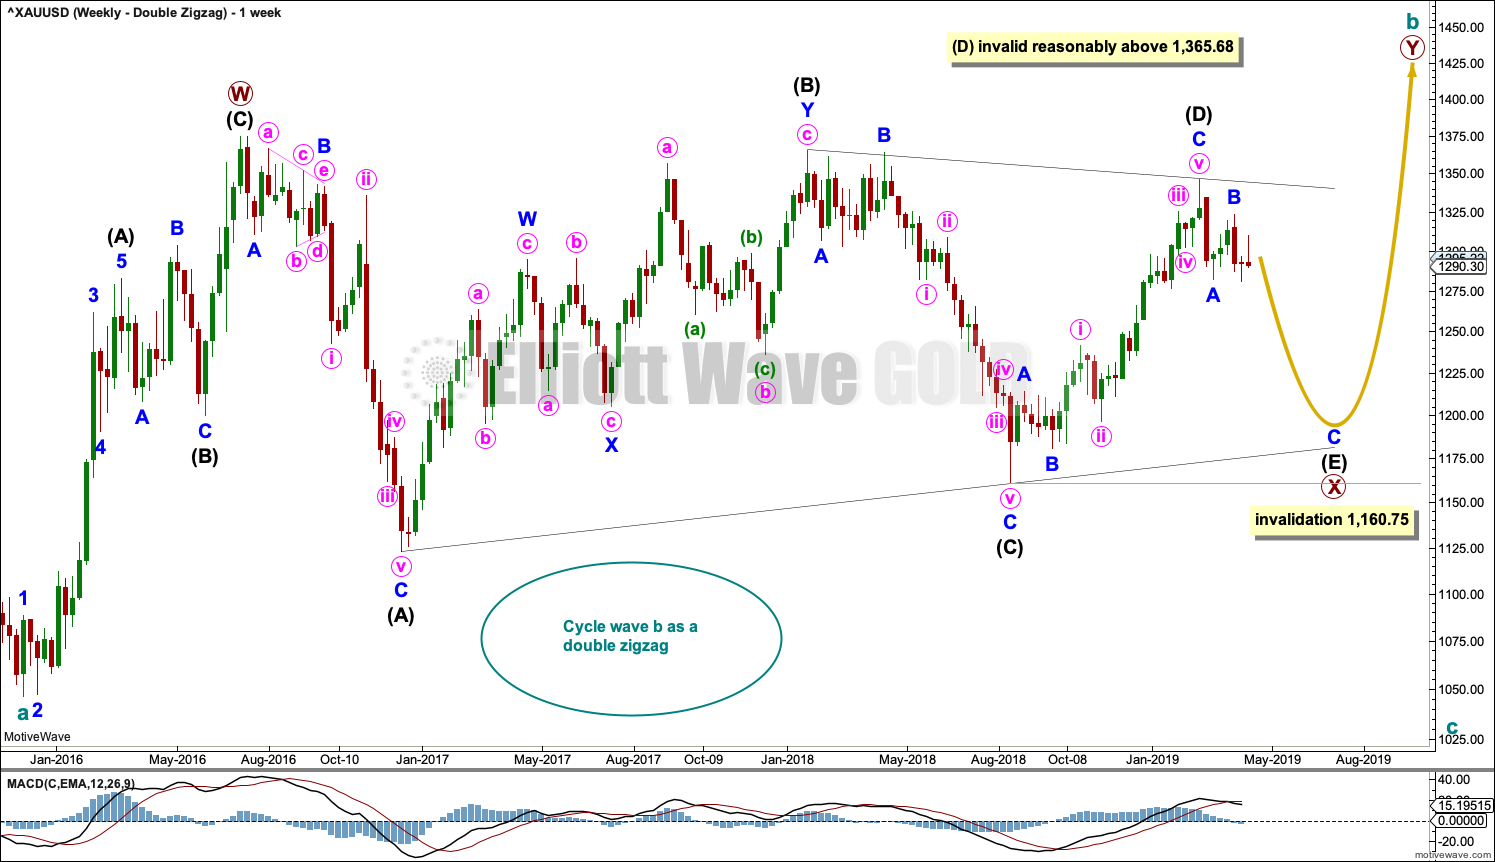
WEEKLY CHART – DOUBLE ZIGZAG
Click chart to enlarge.
It is possible that cycle wave b may be an incomplete double zigzag or a double combination.
The first zigzag in the double is labelled primary wave W. This has a good fit.
The double may be joined by a corrective structure in the opposite direction, a triangle labelled primary wave X. The triangle would be about four fifths complete.
Within multiples, X waves are almost always zigzags and rarely triangles. Within the possible triangle of primary wave X, it is intermediate wave (B) that is a multiple; this is acceptable, but note this is not the most common triangle sub-wave to subdivide as a multiple. These two points reduce the probability of this wave count.
Intermediate wave (D) may be complete. The (B)-(D) trend line is almost perfectly adhered to with the smallest overshoot within intermediate wave (C). This is acceptable.
Intermediate wave (E) should continue to exhibit weakness: ATR should continue to show a steady decline, and MACD may begin to hover about zero.
Intermediate wave (E) may not move beyond the end of intermediate wave (C) below 1,160.75.
This wave count may now expect downwards movement for several weeks.
Primary wave Y would most likely be a zigzag because primary wave X would be shallow; double zigzags normally have relatively shallow X waves.
Primary wave Y may also be a flat correction if cycle wave b is a double combination, but combinations normally have deep X waves. This would be less likely.
This wave count has good proportions and no problems in terms of subdivisions.
Intermediate wave (E) should subdivide as a zigzag labelled minor waves A-B-C. Zigzags subdivide 5-3-5, exactly the same the start of an impulse.
The preferred wave count labels downwards movement minor waves 1-2-3, and this wave count labels downwards movement minor waves A-B-C. At the daily chart level, the subdivisions for both wave counts are seen in the same way.
ALTERNATE ELLIOTT WAVE COUNT
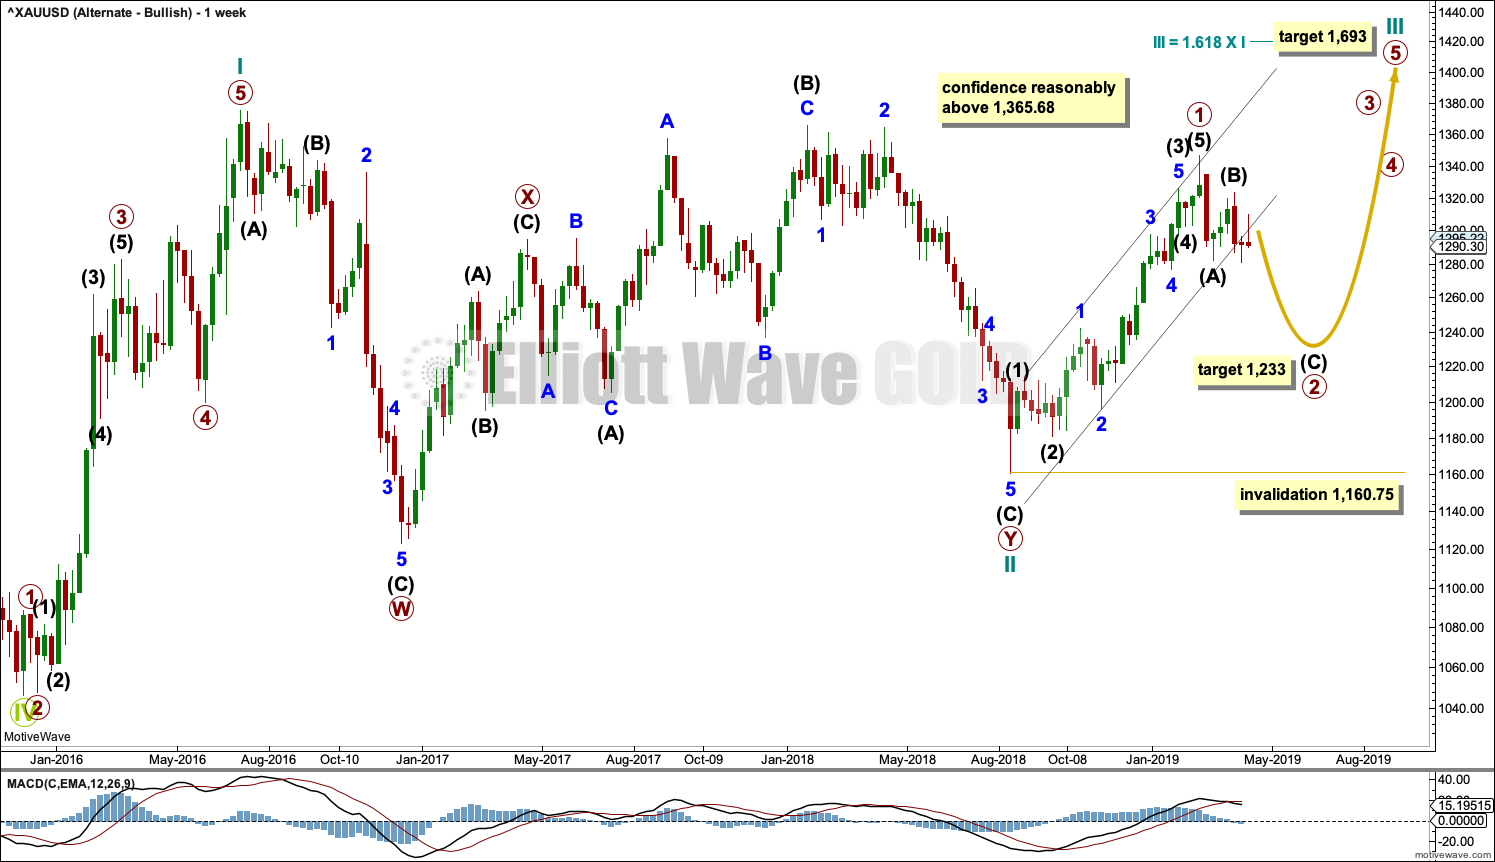
WEEKLY CHART
Click chart to enlarge.
If Gold is in a new bull market, then it should begin with a five wave structure upwards on the weekly chart. However, the biggest problem with this wave count is the structure labelled cycle wave I because this wave count must see it as a five wave structure, but it looks more like a three wave structure.
Commodities often exhibit swift strong fifth waves that force the fourth wave corrections coming just prior to be more brief and shallow than their counterpart second waves. It is unusual for a commodity to exhibit a quick second wave and a more time consuming fourth wave, and this is how cycle wave I is labelled. The probability of this wave count is low due to this problem.
Cycle wave II subdivides well as a double combination: zigzag – X – expanded flat.
Cycle wave III may have begun. Within cycle wave III, primary wave 1 may now be complete. The target for primary wave 2 is the 0.618 Fibonacci ratio of primary wave 1. Primary wave 2 may not move beyond the start of primary wave 1 below 1,160.75.
A black channel is drawn about primary wave 1. Primary wave 2 may breach the lower edge of this channel.
Cycle wave III so far for this wave count would have been underway now for 34 weeks. It should be beginning to exhibit some support from volume, increase in upwards momentum and increasing ATR. However, ATR continues to decline and is very low, and momentum is weak in comparison to cycle wave I. This wave count lacks support from classic technical analysis.
TECHNICAL ANALYSIS
WEEKLY CHART
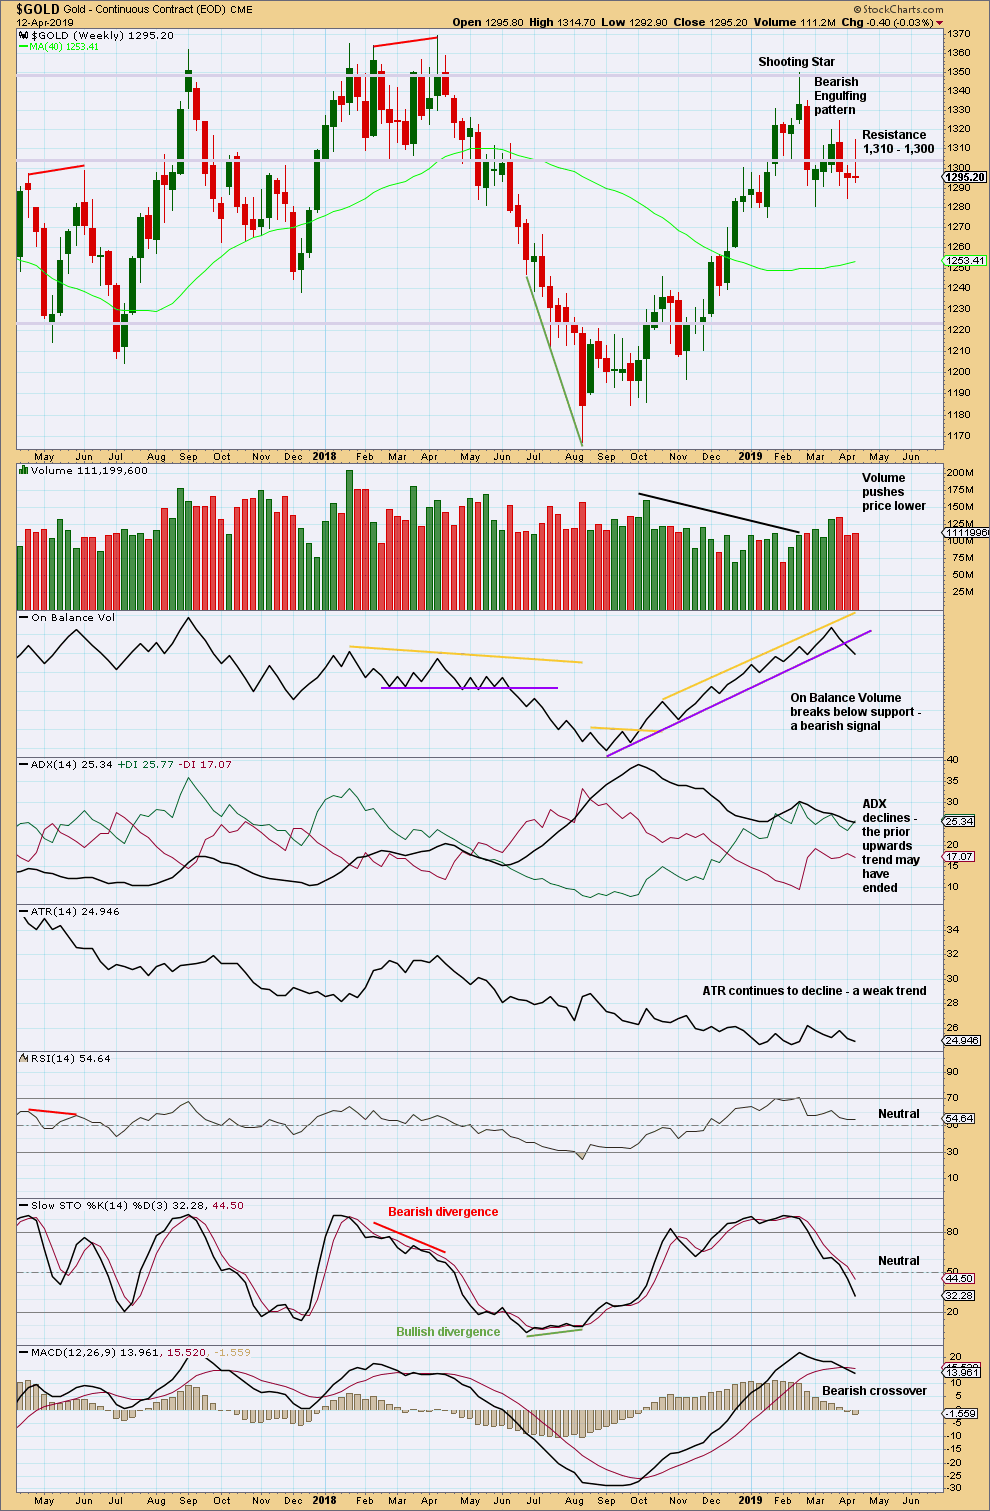
Click chart to enlarge. Chart courtesy of StockCharts.com.
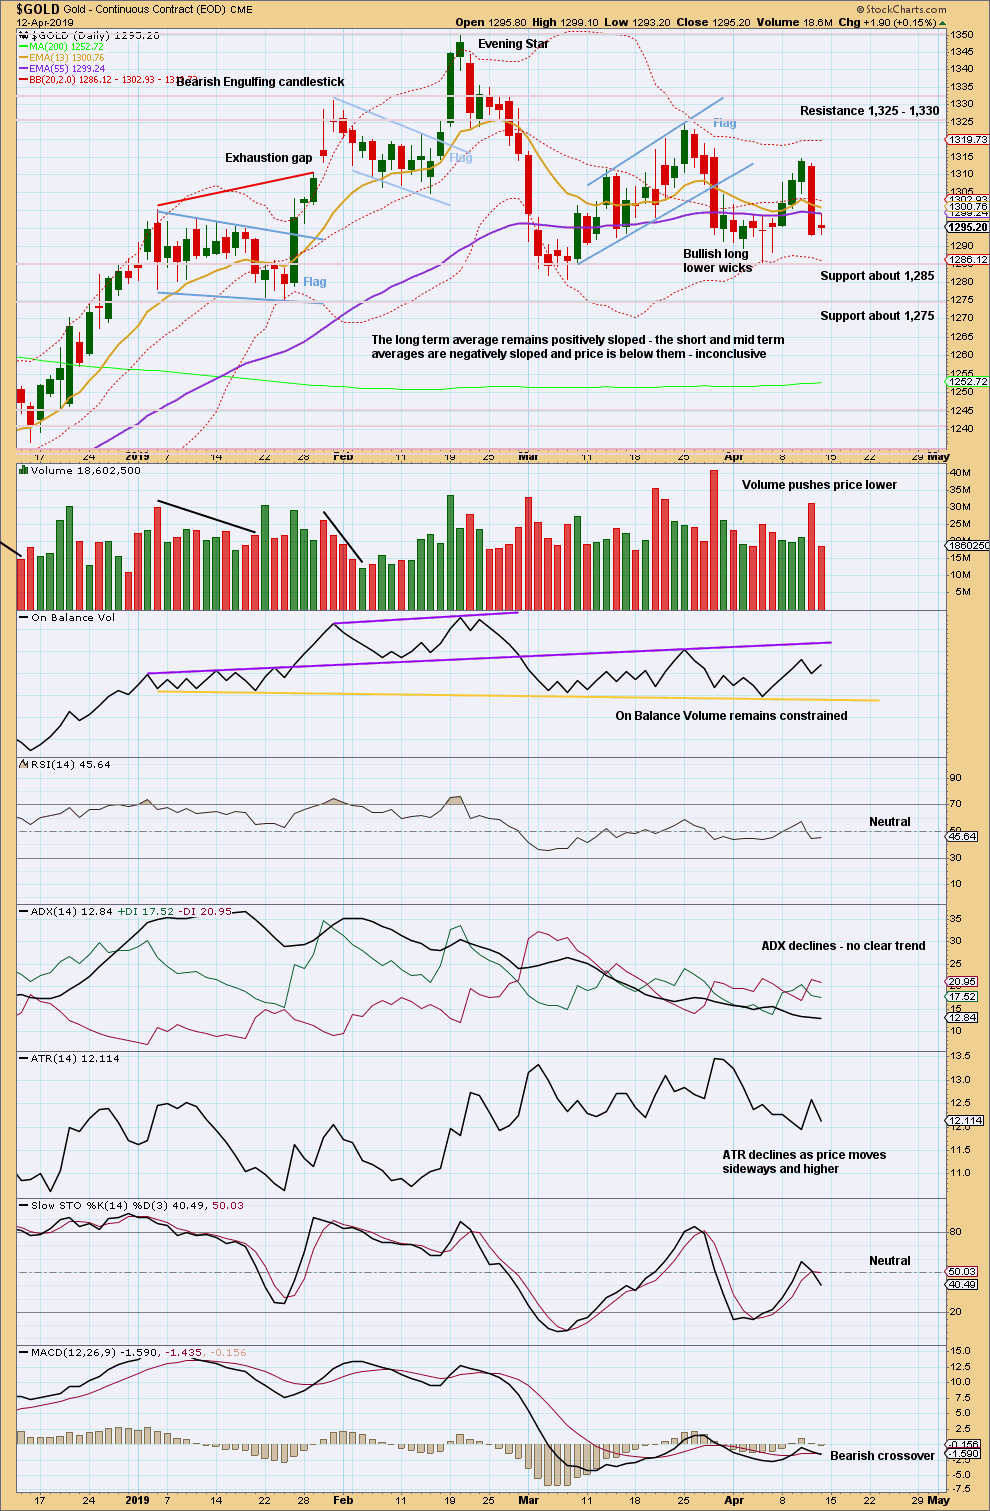
Support and resistance about 1,310 – 1,300 has now been breached in both directions multiple times. This area of prior strong support and resistance has by now been weakened.
For this last week, volume pushes price lower and the candlestick closes with a long upper wick. This indicates more downwards movement as likely next week.
DAILY CHART
Click chart to enlarge. Chart courtesy of StockCharts.com.
From August 2018 Gold moved higher with a series of higher highs and higher lows. This series remained intact until the 1st of March 2019 when a lower low was made. At that stage, it was possible that Gold had seen a trend change.
Friday completed a small inside day with the balance of volume upwards. Volume did not support upwards movement within the session indicating it may be a small counter trend movement. This fits the Elliott wave count.
GDX WEEKLY CHART
Click chart to enlarge. Chart courtesy of StockCharts.com.
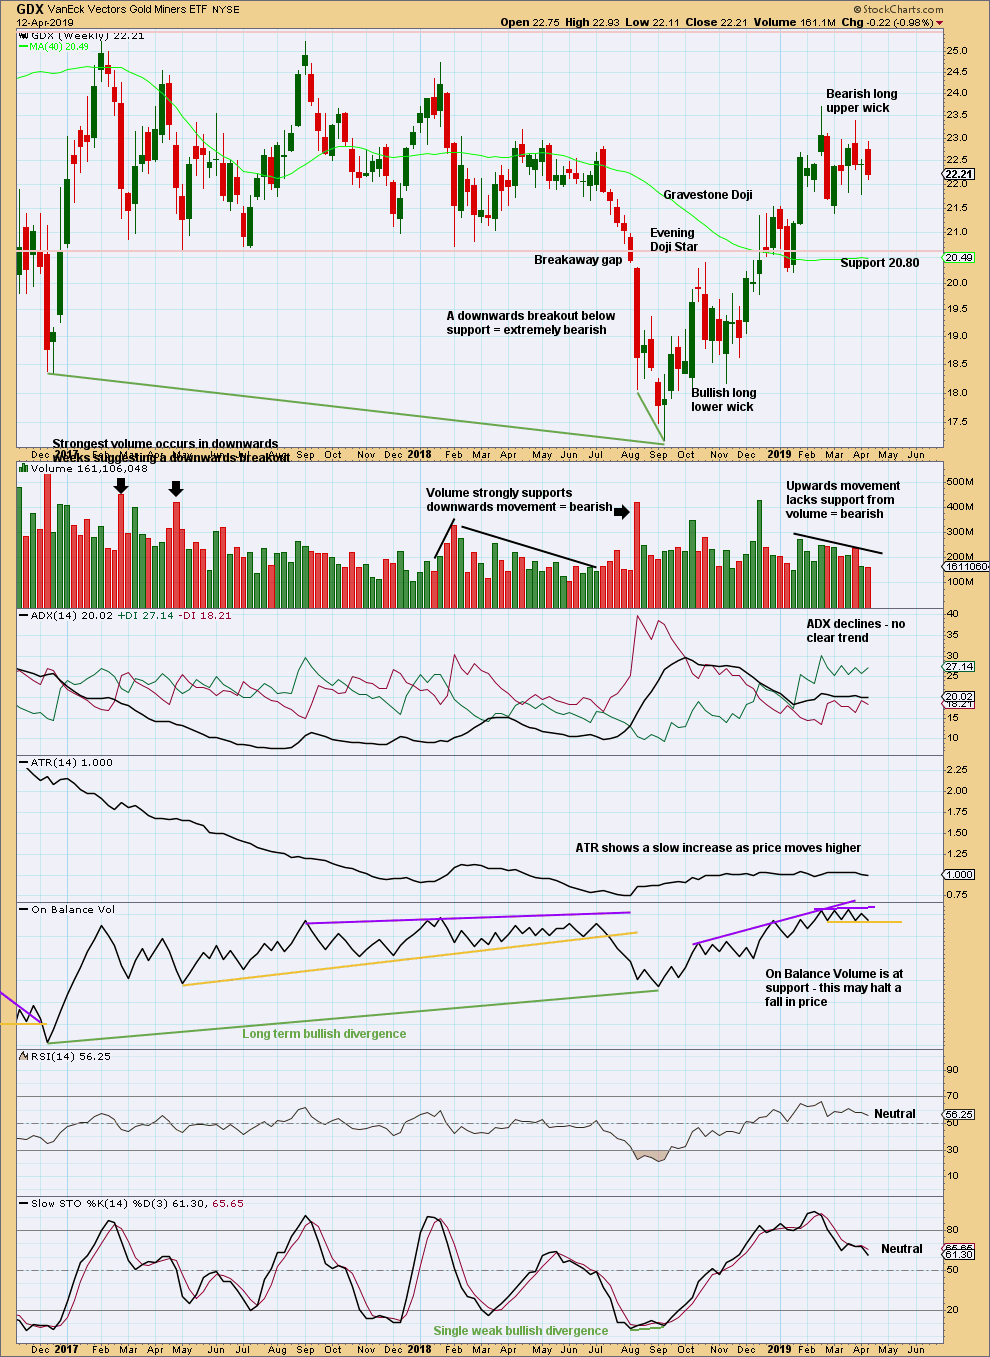
This week price moved higher, but the balance of volume was downwards and the candlestick has closed red. Volume declined. It would be best to look inside the week at daily volume bars to assess the short-term volume profile.
On Balance Volume has a new short-term range. A breakout would provide a signal.
GDX DAILY CHART
Click chart to enlarge. Chart courtesy of StockCharts.com.
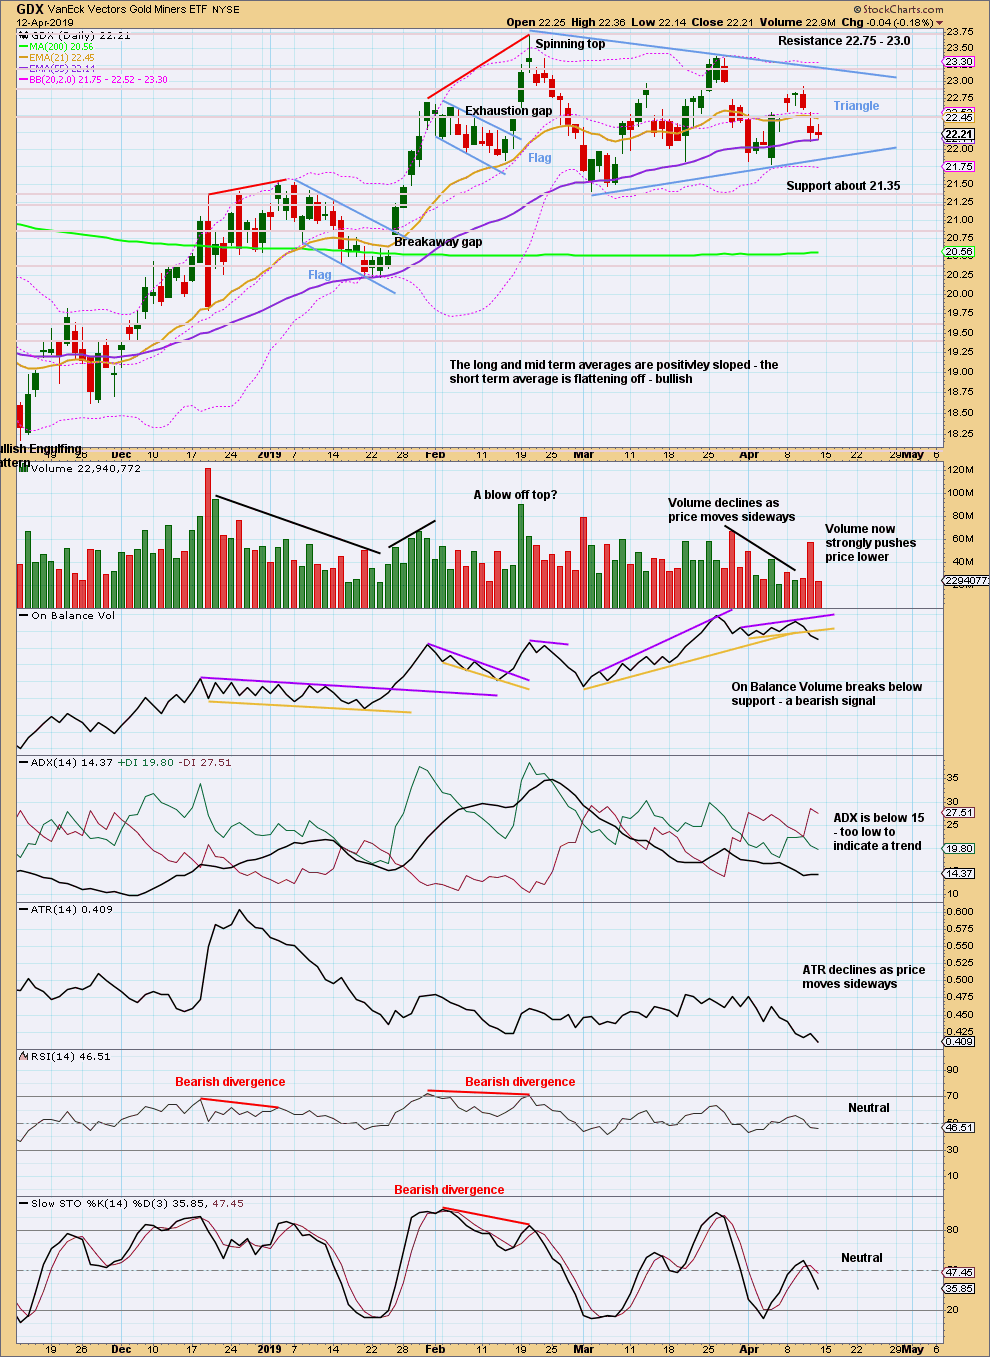
At the daily chart level, the view of an upwards trend may be in doubt with a new swing low on the 1st of March 2019 that moved below the prior swing low of the 14th of February 2019. At that stage, the series of higher highs and higher lows was no longer intact and a trend change was possible.
Since then price has not made another higher high.
Currently, price is range bound with resistance about 22.75 and support about 21.35.
A triangle may be forming; this is now identified on the chart. Classic analysis triangles may be either continuation or reversal patterns. A breakout is required to indicate the next direction. At that stage, a target may be calculated.
Strength in downwards movement suggests a downwards breakout may be imminent.
US OIL
Again, upwards movement continued to reach 1.01 above the target for the week.
Summary: While price remains within the channel on the daily chart, assume the bounce will continue.
If the channel is breached by a full daily candlestick below and not touching the lower edge, assume the bounce is over and a third wave down has begun.
The larger picture still sees Oil in a new downwards trend to end reasonably below 26.06.
MAIN ELLIOTT WAVE COUNT
MONTHLY CHART
Click chart to enlarge.
Classic technical analysis favours a bearish wave count for Oil at this time.
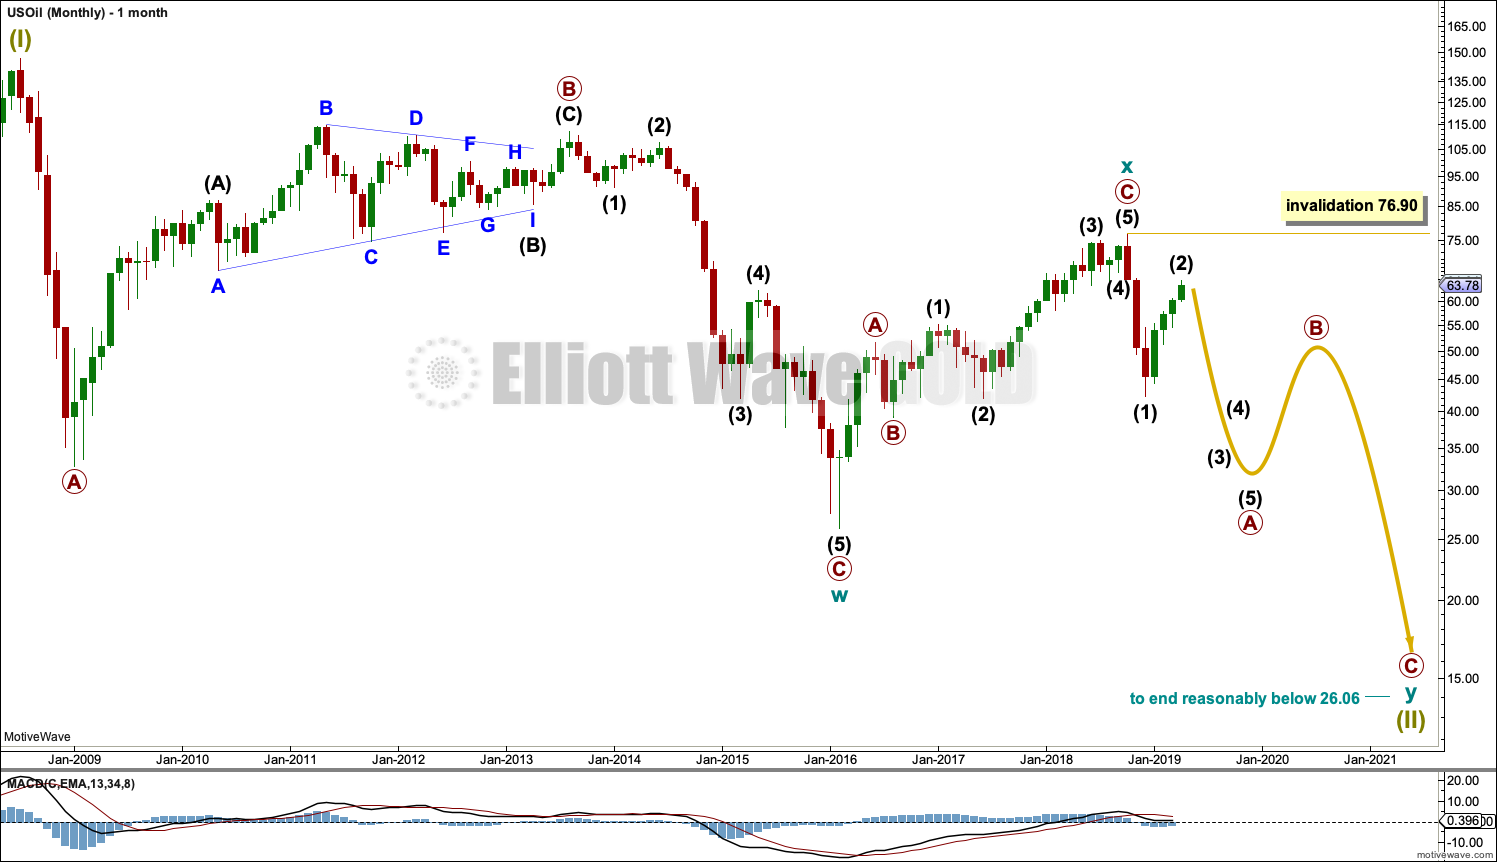
The large fall in price from the high in June 2008 to February 2016 is seen as a complete three wave structure. This large zigzag may have been only the first zigzag in a deeper double zigzag.
Upwards movement from February 2016 to October 2018 will not fit readily as a five wave structure but will fit very well as a three. With a three wave structure upwards, this indicates the bear market may not be over.
The first zigzag down is labelled cycle wave w. The double is joined by a now complete three in the opposite direction, a zigzag labelled cycle wave x.
The purpose of a second zigzag in a double is to deepen the correction when the first zigzag does not move price deep enough. Cycle wave y would be expected to move reasonably below the end of cycle wave w to deepen the correction. Were cycle wave y to reach equality with cycle wave w that takes Oil into negative price territory, which is not possible. Cycle wave y would reach 0.618 the length of cycle wave w at $2.33.
A better target calculation would be using the Fibonacci ratios between primary waves A and C within cycle wave y. This cannot be done until both primary waves A and B are complete.
Within cycle wave y, no second wave correction nor B wave may move beyond its start above 76.90.
WEEKLY CHART
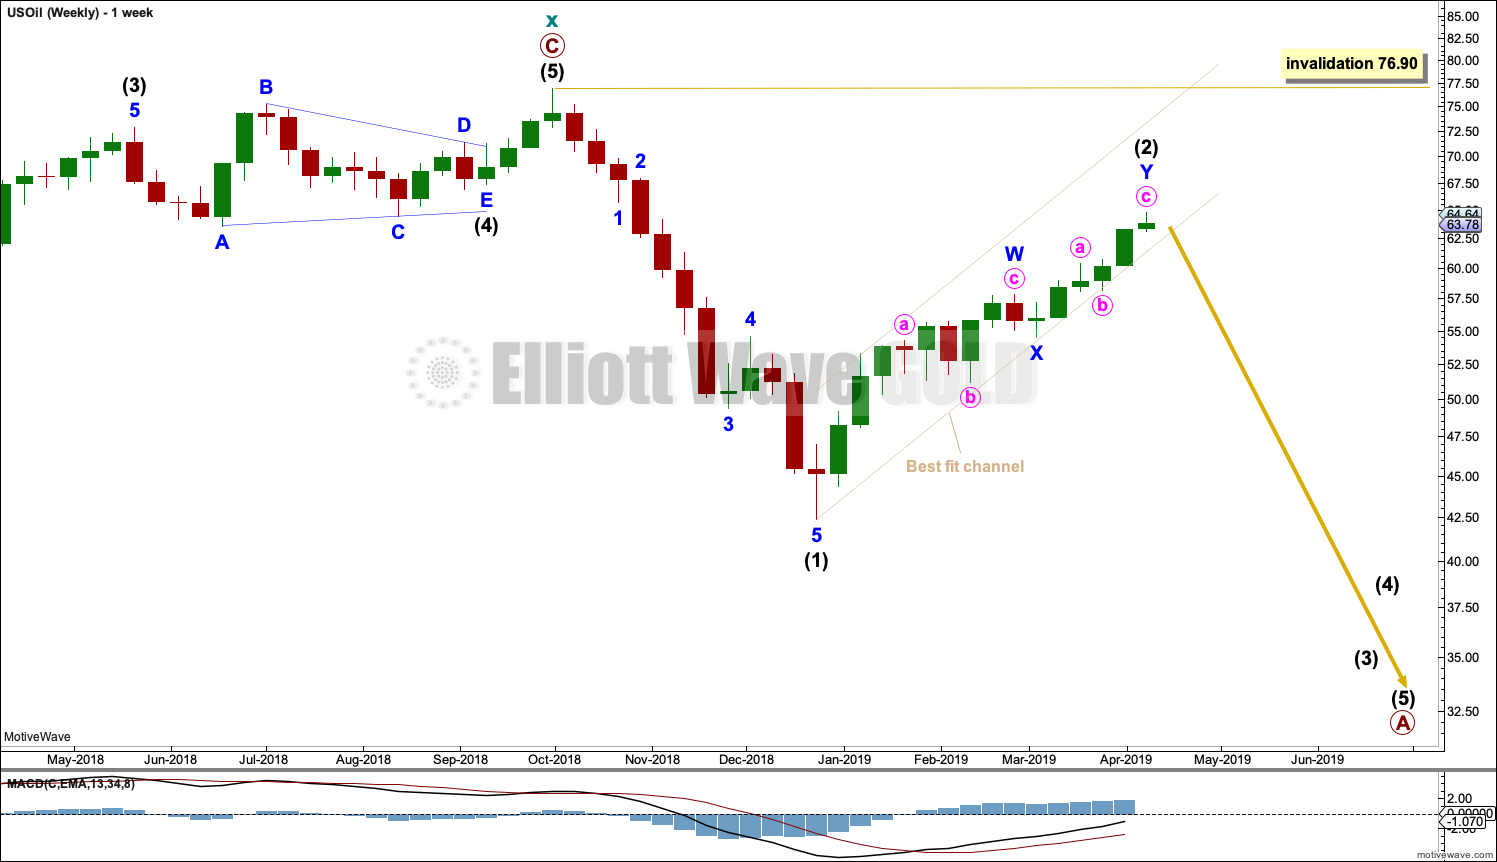
Click chart to enlarge.
This weekly chart is focussed on the start of cycle wave y.
Cycle wave y is expected to subdivide as a zigzag. A zigzag subdivides 5-3-5. Primary wave A must subdivide as a five wave structure if this wave count is correct.
Within primary wave A, intermediate wave (1) may now be complete.
Intermediate wave (2) is a possibly almost complete double zigzag.
Intermediate wave (2) may not move beyond the start of intermediate wave (1) above 76.90.
DAILY CHART
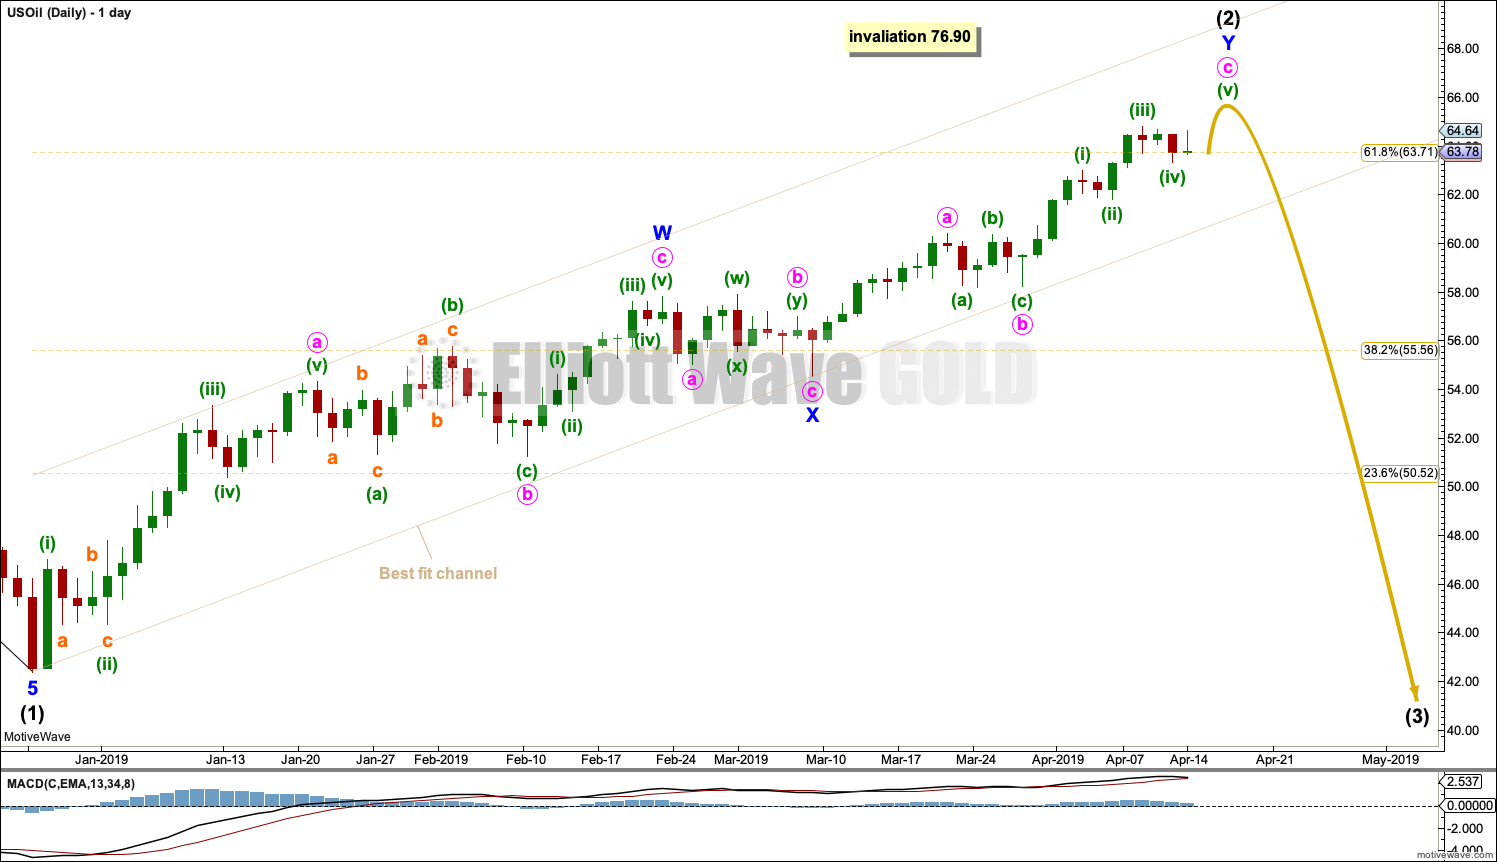
Click chart to enlarge.
Always assume the trend remains the same until proven otherwise.
Intermediate wave (2) may be an incomplete double zigzag. The first zigzag may be complete, labelled minor wave W. The double may be joined by a three in the opposite direction, a zigzag labelled minor wave X.
Labelling within minor wave Y is this week changed because it still may be incomplete. The last small downwards wave fits only as a three on the hourly chart. This indicates the trend may still be up. Minor wave Y may require only a final fifth wave to complete.
The channel is drawn as a best fit. If this channel is breached by a full candlestick below and not touching it, then that at this stage would indicate a trend change.
Intermediate wave (2) may not move beyond the start of intermediate wave (1) above 76.90.
TECHNICAL ANALYSIS
MONTHLY CHART
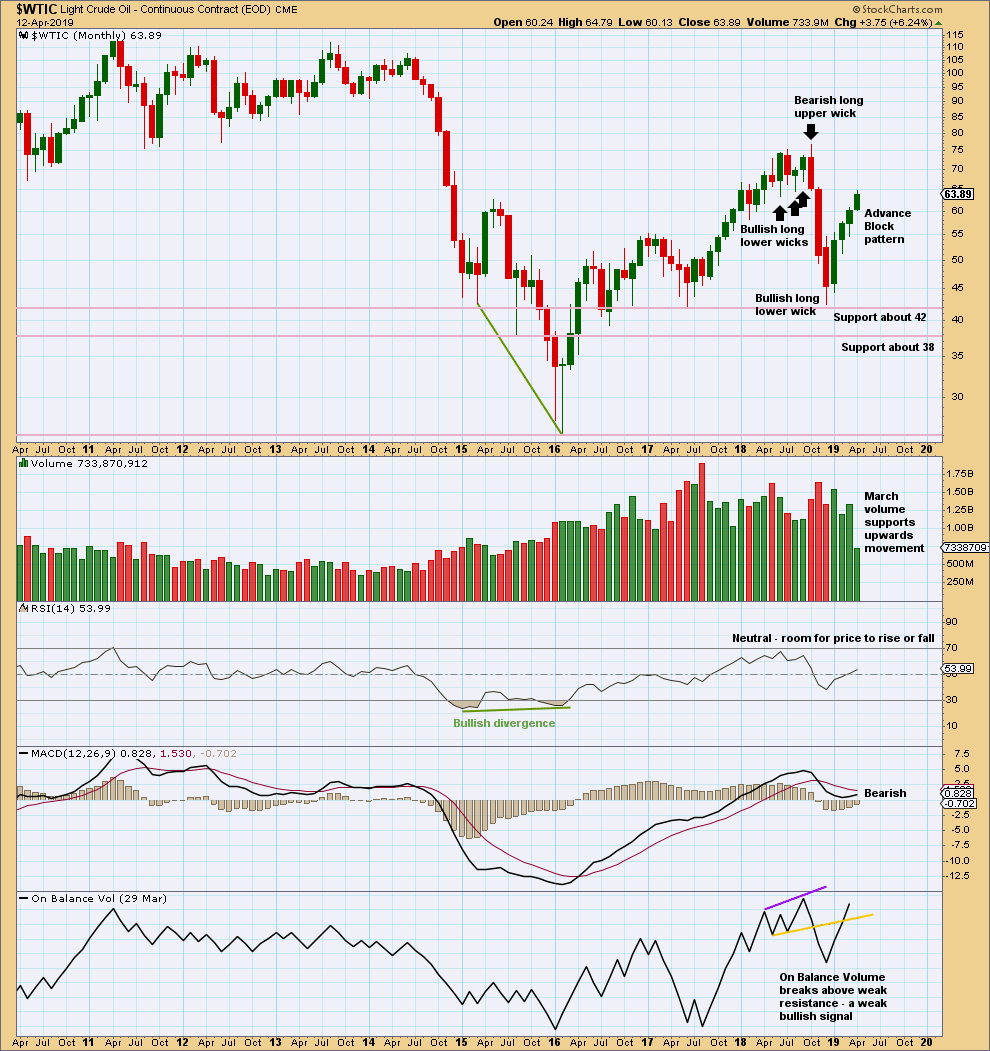
Click chart to enlarge. Chart courtesy of StockCharts.com.
The Advance Block pattern signals developing weakness. But the long lower wicks of the last two monthly candlesticks and some support from volume for March suggest more upwards movement for April.
This upwards bounce may be tiring.
WEEKLY CHART
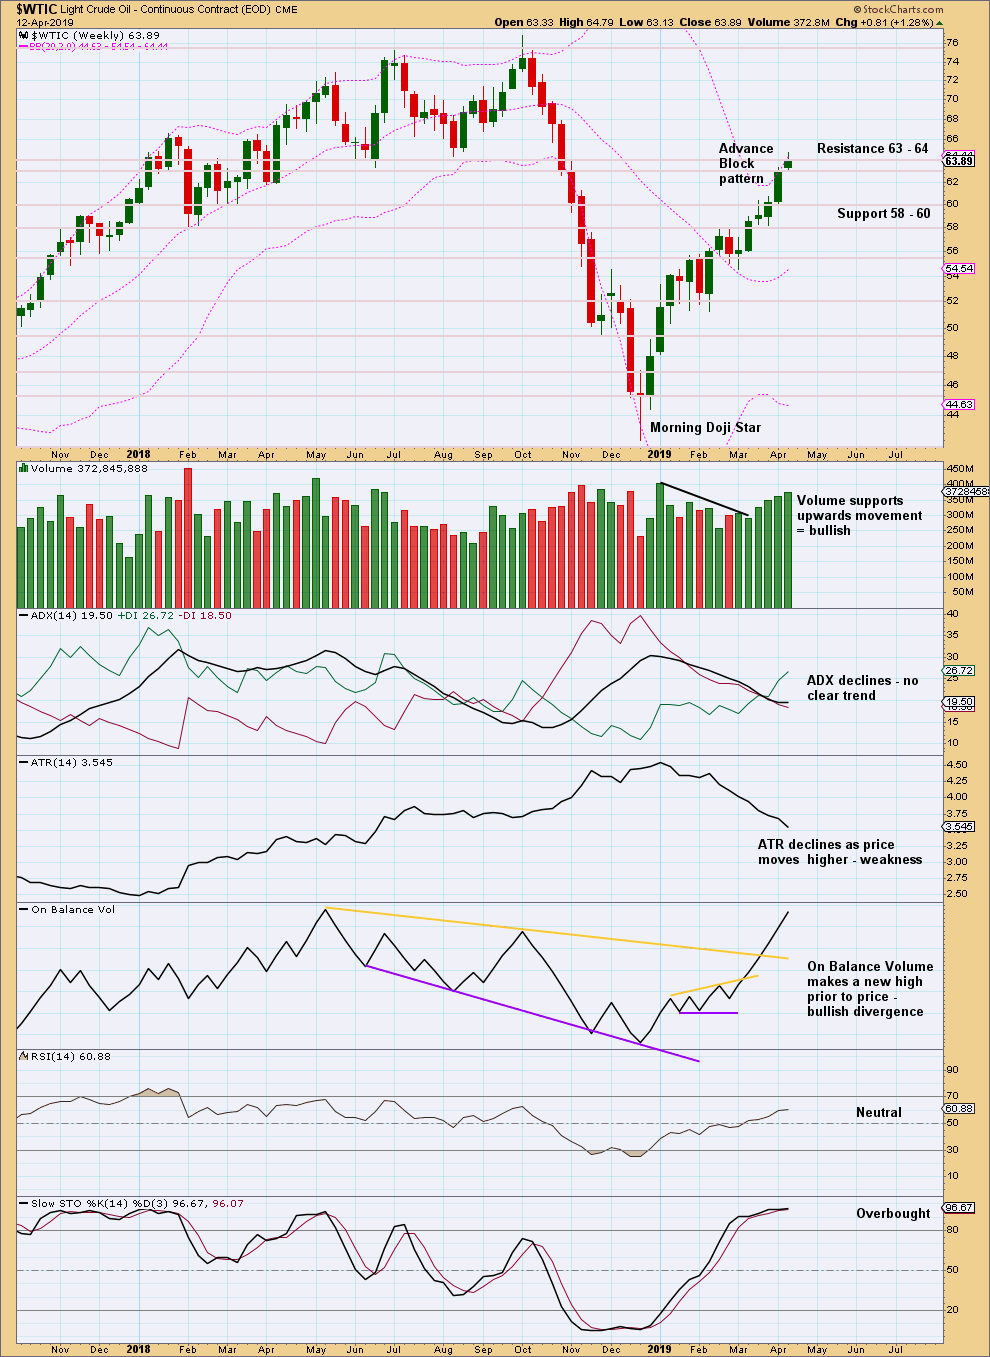
Click chart to enlarge. Chart courtesy of StockCharts.com.
Volume again supports the idea of more upwards movement next week. Volume and On Balance Volume are both bullish.
The Advance Block candlestick pattern is a reversal pattern, but little weight should be given to it due to the contradictory message from volume.
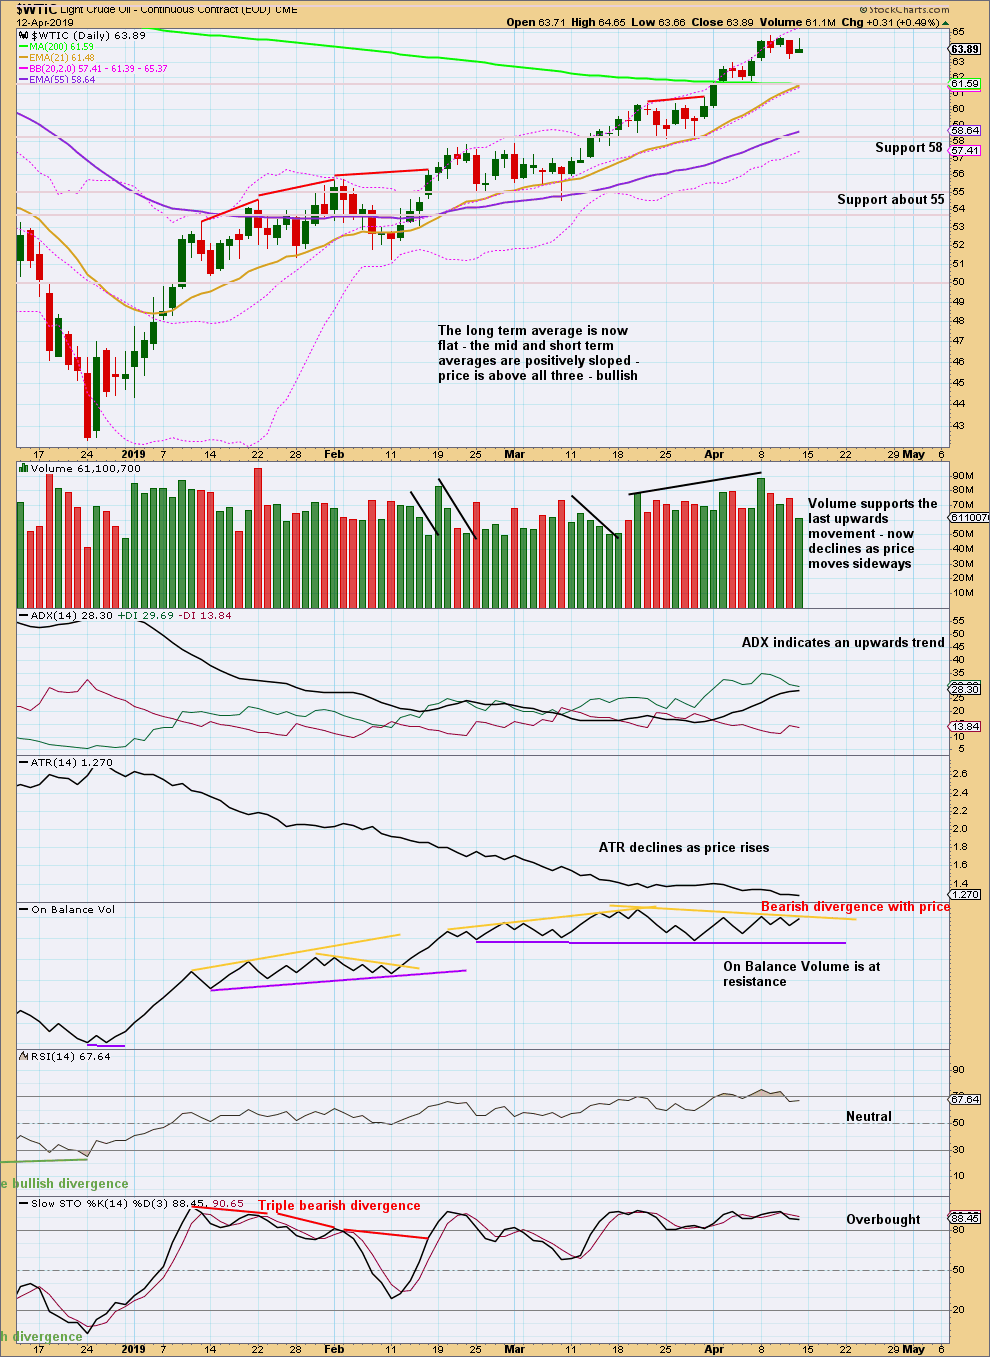
DAILY CHART
Click chart to enlarge. Chart courtesy of StockCharts.com.
Since the 24th of December 2018 there has been a series of higher highs and higher lows, the basic definition of an upwards trend. Assume this will continue until proven it has ended. A lower low below the low of the 28th of March 2019 would provide evidence the bounce is over.
Stochastics may continue to remain overbought and may exhibit further divergence before the bounce ends.
While On Balance Volume has made a new high at the weekly chart level, for the shorter term at the daily chart level there is now some evidence of weakness as it does not confirm last highs.
—
Always practice good risk management as the most important aspect of trading. Always trade with stops and invest only 1-5% of equity on any one trade. Failure to manage risk is the most common mistake new traders make.
Lara
I was using freestockcharts.com but its getting more complicated to use that. You had mentioned a stock charting service you use before. Can you tel me again? Thanks in advance.
Rich
StockCharts.com
It’s not free, but it’s well priced and very good.
Dear Laura,
According to your daily wave count for USOIL, would the current count for minor wave Y be invalidated if USOIL moves higher than around 66, since wave 3 cannot be the shortest wave?
Thanks for your analysis.
Rosa
Hi Lara, sorry for the autocorrect misspelling of your name.
Well spotted, and you’re absolutely right. The limit is now exactly 66.00.
As soon as price makes a new high above 64.79 it could be over. With the labelling I have I’d be expecting minuette (v) to be quite short.
Lara,
Could Gold be in a symmetrical triangle?
From a classic TA POV, yes, it could be.
But it doesn’t fit an Elliott wave triangle rules. Wave C would be below wave A, which violates the rules for both a contracting and barrier triangle.
Thank you for your response! I’m waiting until this pattern breaks out one way or the other.
Bill,
It looks to me like you may have a breakout to the downside today or very soon. Lara’s main wave count on gold looks to be right on. Even the alternates are calling for more downside. Good luck and have a great day.
Rodney,
Not arguing Lara’s main count. Nice job with DUST! Looks like today’s move could be bullish for DUST. Good luck!
Hi Lara,
Hope all is well… Great Work as always.
Thanks for the monthly analysis for the S&P 500… It is greatly appreciated.
Here are my thoughts.
I was bearish in October seeing the swift down action and because price was getting to your bearish targets very quickly and breaking your then Elliott wave channel… However, I changed my mind when I really started to believe the AD line theory even through the depths of Christmas Eve.
I continue to favour your first alternate monthly wave count as the more probable wave count.
Here are my reasons (some of them are fundamental that you do not watch and I respect that a lot since you do not want to cloud your picture with too much noise):
1) the AD line is extremely strong. I cannot see it petering out anytime soon considering its current momentum. I know that you are seeing that as well.
2) Sentiment is very far from euphoric. 99% of the investors was not expecting new highs at the beginning of January. Everybody was talking about 2008 all over again. To talk about 4000 on the S&P 500 was embarrassing… Nobody was believing it. And you have shown us that the volume has been decreasing in this bull market and has been typical in the last 10 years…. I might have some reasons that might explain why… The first one is that inflows in Equity mutual funds are still in negative territory since 2007 and fixed income inflows are still skyrocketing… The second one is that the retail investor is not in this bull run. This bull run is considered as the “most hated bull market” ever. Most investors, even some of the professionals, have still the crash of 2008 in mind and they are continuously trying to find the top of this market… Therefore there is still a very high “wall of worry” in these markets. This would explain the decreasing volume in the markets and I would think it would be typical behaviour in a cycle degree wave 1. Compared to the 1999-2000 Nasdaq sentiment, there is no comparison… Nobody talks about the markets currently in the retail world. Fixed income is still the main driver.
3) the QQQ:$SPX ratio in stockcharts.com continues its upward trend since 2003. As you know, companies like AMZN, MSFT, AAPL, GOOGL, FB, NFLX have much bigger weights in QQQ (Nasdaq 100) than in the $SPX. These companies have been driving the indices higher for the past 16 years… Because of their massive market capitalization, my theory in this case is that this bull run will be over ONLY when this ratio fails its upward trend. Also, these above companies chart patterns are suggesting that we will have parabolic tops in each one of them suggesting my forecast to be the same for the indices.
4) Commodity prices are weak. During the 1995-2000 spike in the indices, commodity prices were decreasing, the economy was slowing and interest rates were coming down after the 1994 bond downdraft. That led the way to a massive bubble in growth companies… I am seeing it occurring again today as we have the same conditions as in 1995.
5) The 10 year US bond yield rate is going down prolonging this low interest rate cycle for another few years…. This supports the continuing lofty prices for growth companies.
6) You said in the video that you are expecting “a huge huge bear market to happen but not yet” after this bull run… If you are expecting a huge bear market (for which I agree with), I believe we need to exhaust completely the buyers from this market… The best way to do this is to have a parabolic top. That would have a great look for the 90 year massive bull run and it would make a lot of sense…. It always puzzles me to see long upward trends to finish with a “dire” sentiment. Is it more common to see a long term impulse Super Cycle to finish with a parabolic top?
7) Central Banks in Europe and Japan are continuously printing money… That money is going where the highest yield can be generated…. It is going into the US markets, the best market in the world currently…. Now, the Fed is dovish… Current interest policies are bullish for the US market overall.
These above observations are my own and they seemed to be lining up perfectly for the S&P 500 for your first alternate monthly wave count as the more probable outcome.
Thanks Lara… I appreciate your excellent work.
Mathieu
Hi Mathieu,
I appreciate your analysis. Might I suggest that the QQQ to SPX ratio actually may go parabolic too (vs declining) and the weakness in breadth shows up in commodities, multinationals and small/mid caps?Further, instead of focusing on an ultimate SPX target, maybe the NDX makes a laser move to 10,000. Either way it goes, the short opportunity after these moves should be phenomenal. I also agree that sentiment is clearly signaling a lot more upside.
Thank you for sharing your thoughts.
Corey
Hey Corey,
-I agree that QQQ:$SPX ratio might go parabolic as well at the peak.
-for the breadth, not sure if I totally understand the scope of breath) I would say no (on the NYSE AD line weakness) because it would have shown up already in the 2014-15 period when the commodities were weak. I do not focus on the breath of the commodities… I just focus on the NYSE AD line for which Lara has introduced to me.
-For me personally, I focus on the strongest relative stocks in those markets… I would agree that the NDX will outperform the S&P 500. I believe Technology and Healthcare are the best sectors to be in currently.
Cheers,
Mathieu
Hi Mathieu,
I’ve been rather concerned with sentiment actually. For my preferred wave count for the S&P500 I would have expected it to be more bullish. And as you rightly point out, it’s just not. Yes, that is concerning for the main count.
This is one reason why I’m considering more bullish alternates for this market.
Thanks for your comment, its added more depth to this analysis.
Thanks Lara…. I appreciate it…
Just now, I noticed that the Russell 2000 ($RUT in stockcharts.com) is very weak.
I am sensing a stronger correction, maybe of primary degree…
A lot of my stocks (small to mid caps) that I trade are very weak… Larger caps have been stronger in the past couple of weeks.
Cheers,
Mathieu
Mathieu,
I enjoyed reading your post. I don’t disagree with you on RUT as it doesn’t look good. I’d like to be optimistic an say after a nice wave 1 to 2-25-19 we are in wave 2. Alternate would be ABC with RUT in wave B.
Large caps have been boosting share prices with buy backs instead of dividends. Whereas the US could have a bullish move up left our friends in the EU might be in the start of a recession. If my opinion isn’t correct about the EU anyone feel free to correct me.
Hey Bill,
I don’t know… I did not do a full Elliott wave analysis of the RUT… I am far from an expert in Elliott wave… Lara is a genius at it…
But relatively, it has been weak compared to QQQ, Nasdaq and S&P 500… This is currently the only caveat of Lara’s alternative wave count for which I am leaning more on.
Cheers,
Mathieu