
A bounce was expected to end about 1,289. Upwards movement reached a high at 1,290.90 where price sharply reversed, just 1.90 above the target.
Summary: Expect the downwards trend to resume. Look out now for a possible strong increase in downwards momentum.
The mid-term Elliott wave target is at 1,220. The classic analysis target is at 1,217. Risk is just above the upper edge of the base channel on the daily chart.
Three long-term targets are now calculated for cycle wave c to end. Confidence in a new downwards trend may be had with a new low below 1,160.75.
Grand SuperCycle analysis is here.
Last monthly charts are here. Video is here.
MAIN ELLIOTT WAVE COUNT
WEEKLY CHART – TRIANGLE
Click chart to enlarge.
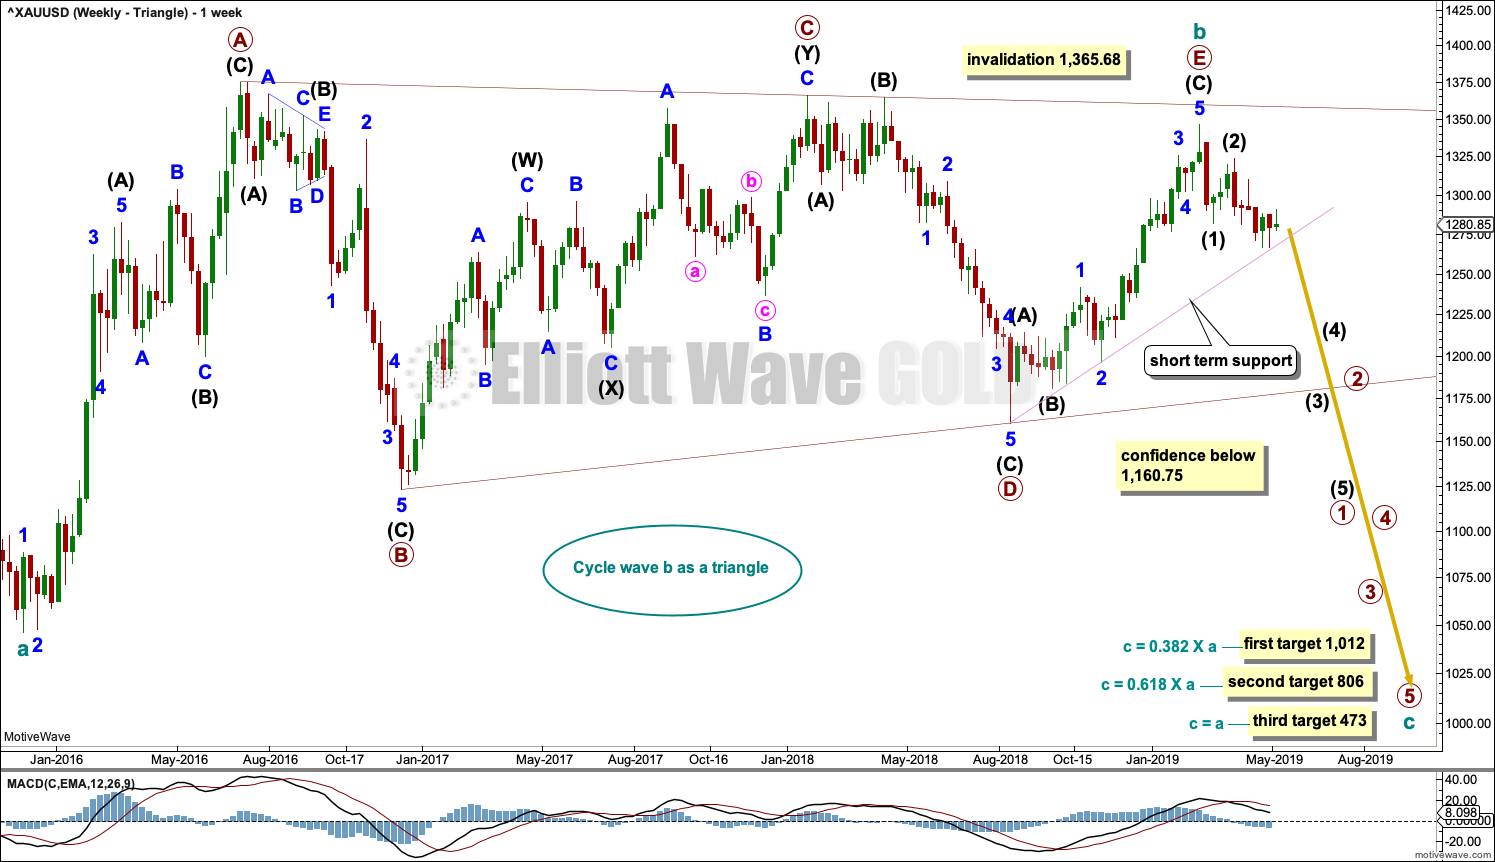
The basic Elliott wave structure is five waves up followed by three waves back (in a bull market). At this time, my preferred Elliott wave count sees Gold as still within three waves back, which began at the all time high in September 2011.
Five waves up are labelled 1,2,3,4,5. Three waves back are labelled A,B,C.
This wave count sees Gold as now just over halfway through the three waves back. The three wave structure is labelled cycle waves a, b and now c just beginning. The Elliott wave corrective structure at Super Cycle degree is a zigzag, which subdivides 5-3-5. Cycle wave a subdivides as a five, cycle wave b is a complete structure, and now cycle wave c is expected to subdivide as as five wave structure.
Cycle wave b for this wave count is seen as a complete regular contracting triangle. Triangles are reasonably common structures for B waves, and the most common type of Elliott wave triangle is a regular contracting triangle.
Within the five sub-waves of an Elliott triangle, one sub-wave usually subdivides as a more complicated double zigzag and the most common sub-wave to do so is wave C. Contracting triangles most commonly end with wave E falling short of the A-C trend line. This triangle follows the most common pattern, and it must be judged in Elliott wave terms to have a high probability.
Within a zigzag, cycle wave c may exhibit a Fibonacci ratio to cycle wave a. Three targets are calculated for cycle wave c to end based upon Fibonacci Ratios to cycle wave a. As price approaches the first target if the structure is incomplete or if price keeps falling through it, then attention will turn to the next target. The same approach will be used for the third target.
DAILY CHART – TRIANGLE
Click chart to enlarge.
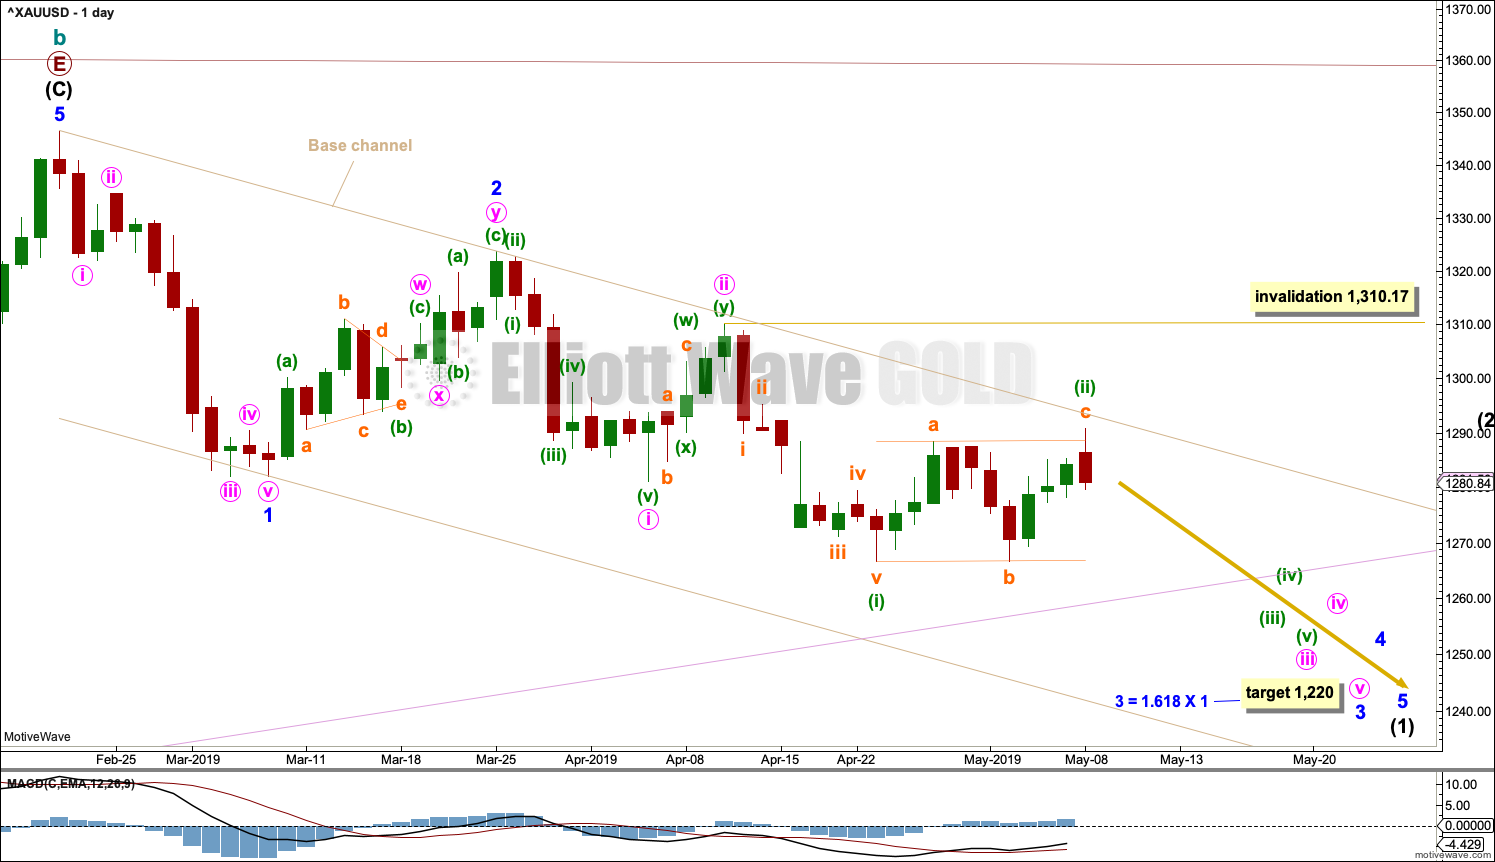
Cycle wave c must subdivide as a five wave structure, either an impulse or an ending diagonal. An impulse is much more common and that shall be how it is labelled unless overlapping suggests a diagonal should be considered.
A new trend at cycle degree should begin with a five wave structure on the daily chart, which will be labelled minor wave 1.
A base channel is drawn about minor waves 1 and 2. There will be bounces and consolidations on the way down. The last bounce has found resistance at the upper edge of the base channel. Towards its middle or end the power of a third wave may be able to break below support at the lower edge of the base channel. The upper edge of the base channel may be used to calculate a trailing stop for short positions.
Minor wave 3 may only subdivide as an impulse. Within the impulse, minute waves i and ii may now be complete . Minute wave iii may only subdivide as an impulse. Within minute wave iii, minuette wave (i) may be complete. Minuette wave (ii) may today be complete as a regular flat correction. Draw a small channel about minuette wave (ii). Minuette wave (ii) may have ended today with a small overshoot of the small channel containing it. This is a typical look for a regular flat.
This wave count now expects there may now be a completed series of three overlapping first and second waves. This expects an increase in downwards momentum as the middle of a third wave unfolds.
It is possible that minute wave iii and / or minor wave 3 may end with a selling climax; either or both may exhibit a swift and strong fifth wave to end the impulse. This behaviour is typical of commodities, and this tendency is especially prevalent for third wave impulses.
HOURLY CHART
Click chart to enlarge.
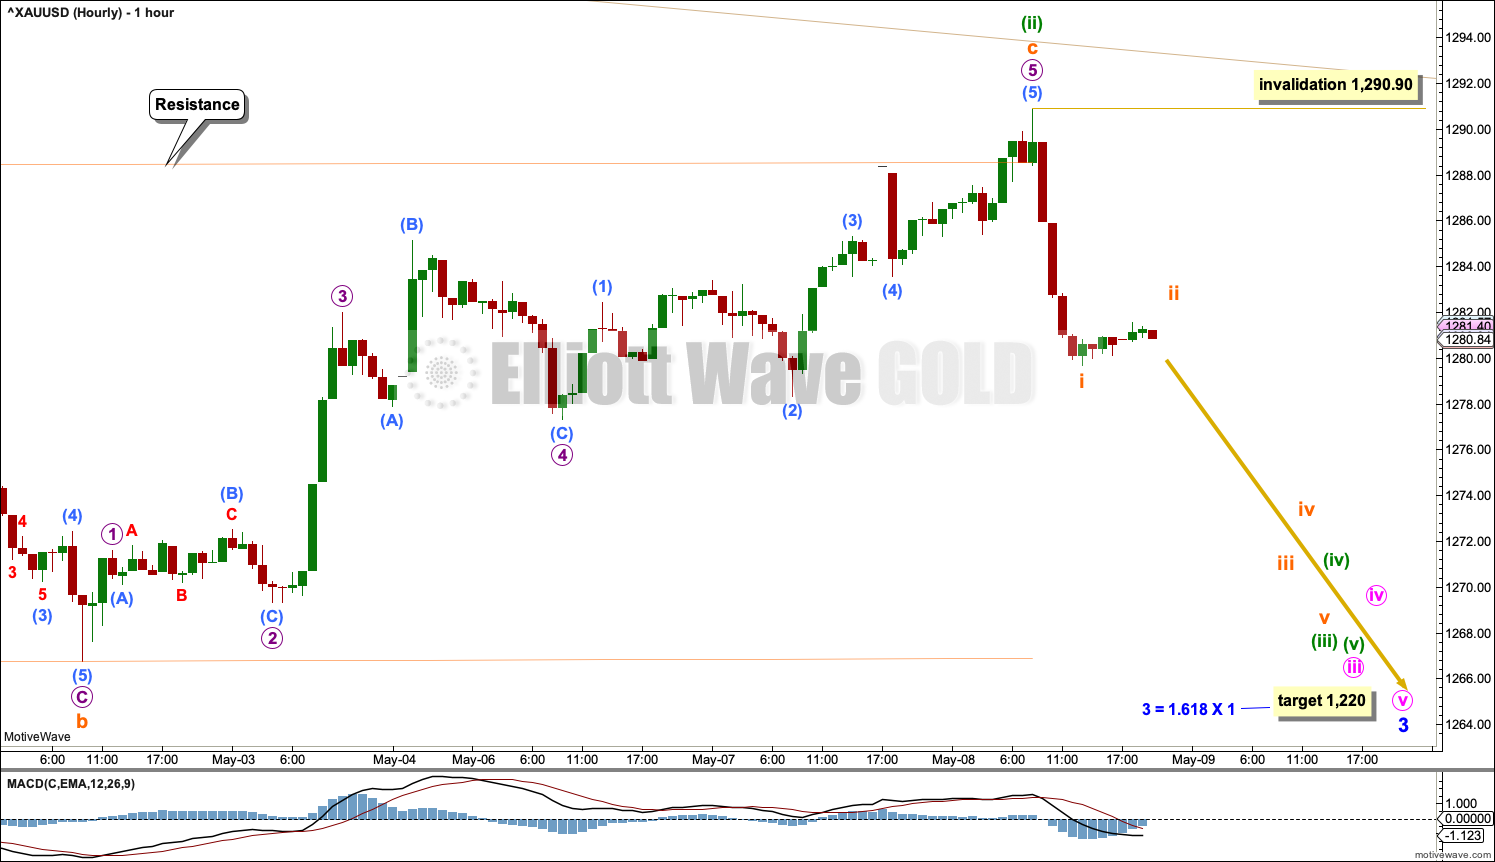
Minuette wave (ii) may be complete as a regular flat correction.
Minuette wave (iii) may only subdivide as an impulse. Within minuette wave (iii), subminuette wave ii may not move beyond the start of subminuette wave i above 1,290.90.
This wave count now sees a series of four overlapping first and second waves complete. A strong increase in downwards momentum may be now close by.
WEEKLY CHART – DOUBLE ZIGZAG
Click chart to enlarge.
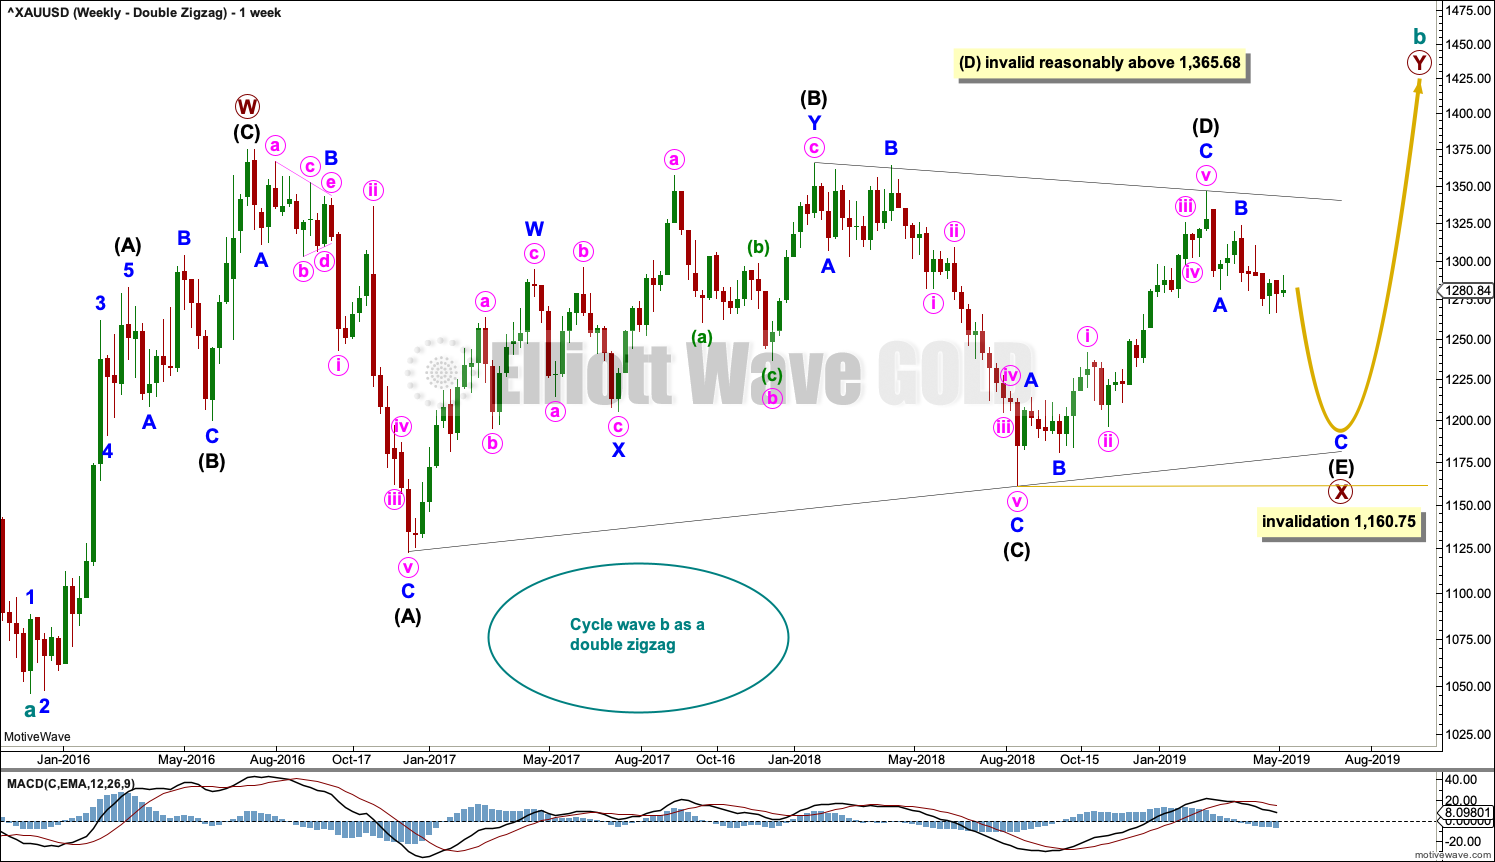
This wave count is identical to the first weekly chart up to the low labelled cycle wave a. Thereafter, a different Elliott wave corrective structure is considered for cycle wave b.
It is possible that cycle wave b may be an incomplete double zigzag or a double combination.
The first zigzag in the double is labelled primary wave W. This has a good fit.
The double may be joined by a corrective structure in the opposite direction, a triangle labelled primary wave X. The triangle would be about four fifths complete.
Within multiples, X waves are almost always zigzags and rarely triangles. Within the possible triangle of primary wave X, it is intermediate wave (B) that is a multiple; this is acceptable, but note this is not the most common triangle sub-wave to subdivide as a multiple. These two points reduce the probability of this wave count in terms of Elliott wave.
Intermediate wave (E) should continue to exhibit weakness: ATR should continue to show a steady decline, and MACD may begin to hover about zero.
Intermediate wave (E) may not move beyond the end of intermediate wave (C) below 1,160.75.
This wave count may now expect downwards movement for several weeks.
Primary wave Y would most likely be a zigzag because primary wave X would be shallow; double zigzags normally have relatively shallow X waves.
Primary wave Y may also be a flat correction if cycle wave b is a double combination, but combinations normally have deep X waves. This would be less likely.
This wave count has good proportions and no problems in terms of subdivisions.
Intermediate wave (E) should subdivide as a zigzag labelled minor waves A-B-C. Zigzags subdivide 5-3-5, exactly the same the start of an impulse.
The preferred wave count labels downwards movement minor waves 1-2-3, and this wave count labels downwards movement minor waves A-B-C. At the daily and hourly chart levels, the subdivisions for both wave counts are seen in the same way.
ALTERNATE ELLIOTT WAVE COUNT
WEEKLY CHART
Click chart to enlarge.
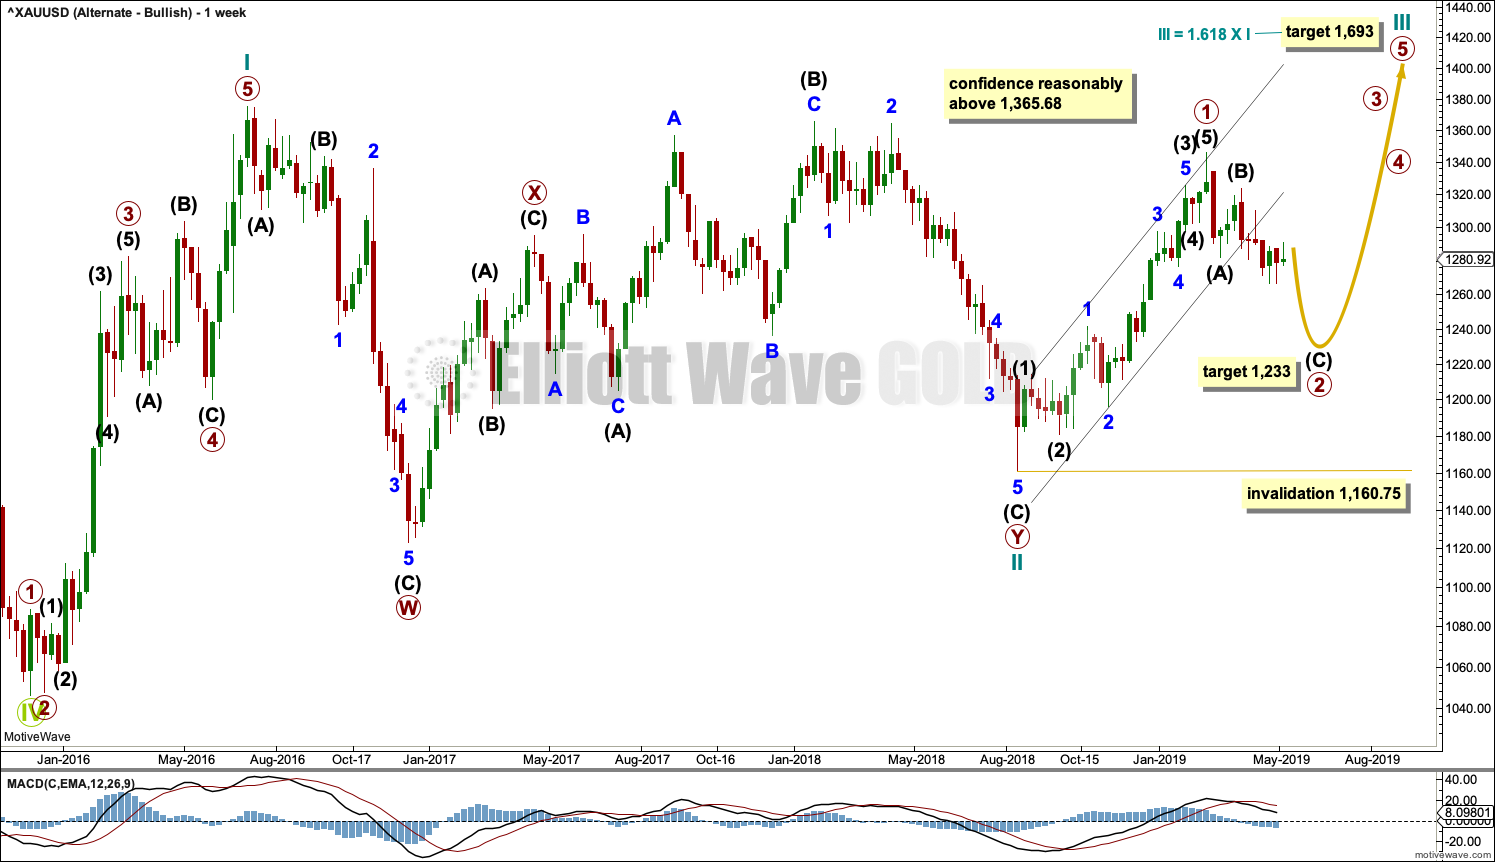
This wave count sees the three waves back now complete at the last major low for Gold in November 2019.
If Gold is in a new bull market, then it should begin with a five wave structure upwards on the weekly chart. However, the biggest problem with this wave count is the structure labelled cycle wave I because this wave count must see it as a five wave structure, but it looks more like a three wave structure.
Commodities often exhibit swift strong fifth waves that force the fourth wave corrections coming just prior and just after to be more brief and shallow than their counterpart second waves. It is unusual for a commodity to exhibit a quick second wave and a more time consuming fourth wave, and this is how cycle wave I is labelled. The probability of this wave count is low due to this problem.
Cycle wave II subdivides well as a double combination: zigzag – X – expanded flat.
Cycle wave III may have begun. Within cycle wave III, primary wave 1 may now be complete. The target for primary wave 2 is the 0.618 Fibonacci ratio of primary wave 1. Primary wave 2 may not move beyond the start of primary wave 1 below 1,160.75.
A black channel is drawn about primary wave 1. Primary wave 2 may breach the lower edge of this channel.
Cycle wave III so far for this wave count would have been underway now for 38 weeks. It should be beginning to exhibit some support from volume, increase in upwards momentum and increasing ATR. However, ATR continues to decline and is very low, and momentum is weak in comparison to cycle wave I. This wave count lacks support from classic technical analysis.
TECHNICAL ANALYSIS
WEEKLY CHART
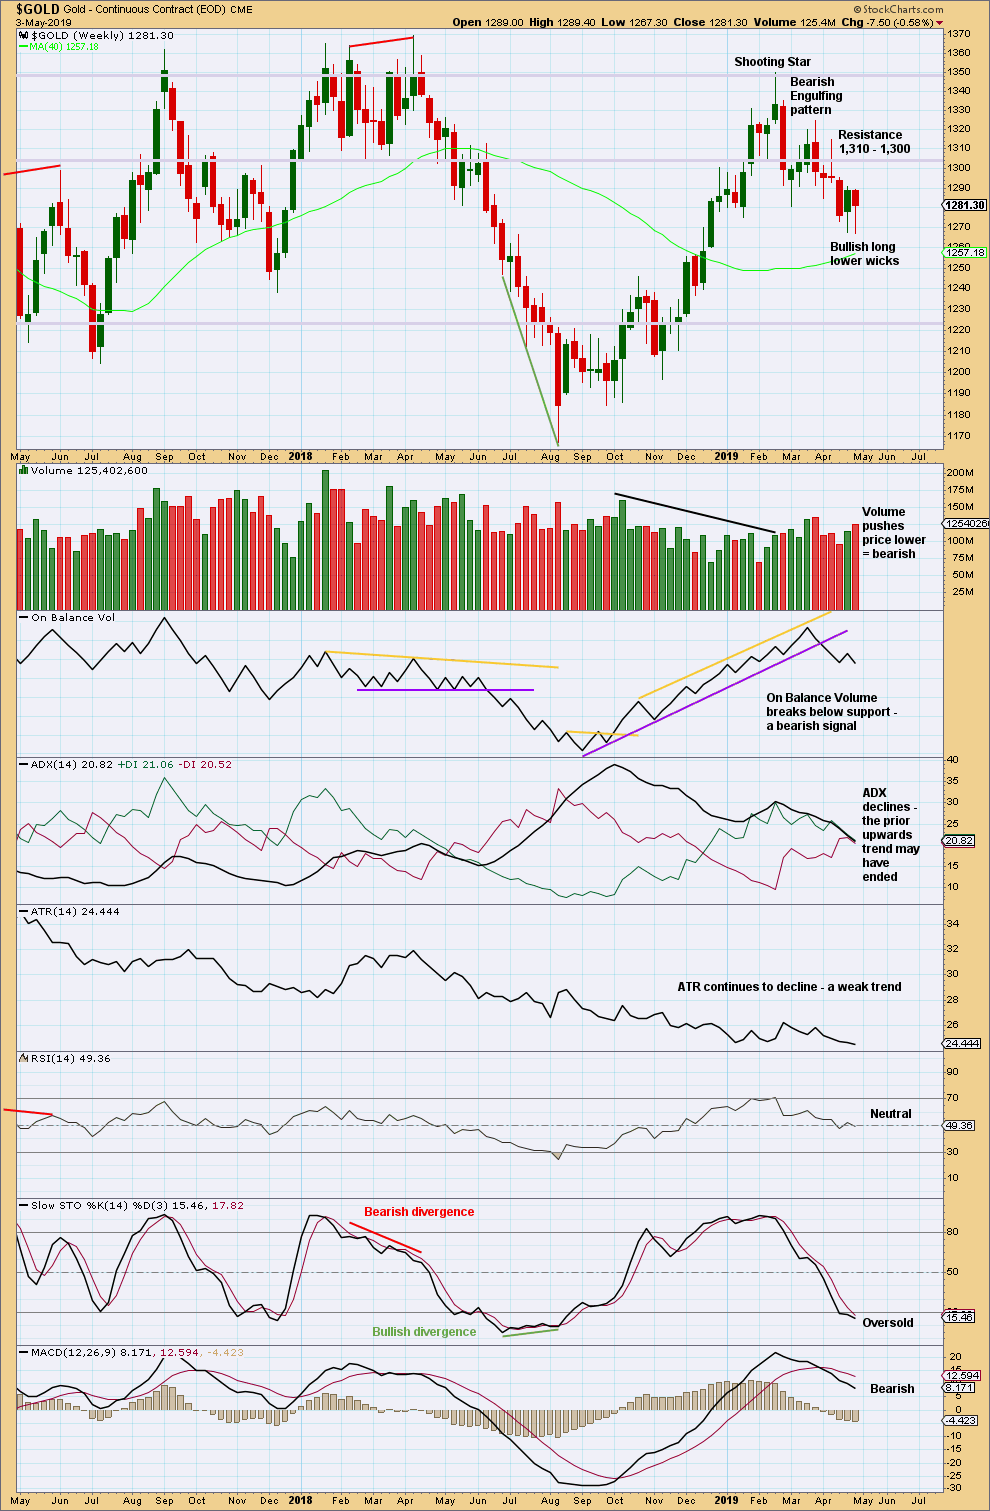
Click chart to enlarge. Chart courtesy of StockCharts.com.
Two long lower wicks now suggest a bounce here may continue, but volume suggests it may be shallow and short lived.
DAILY CHART
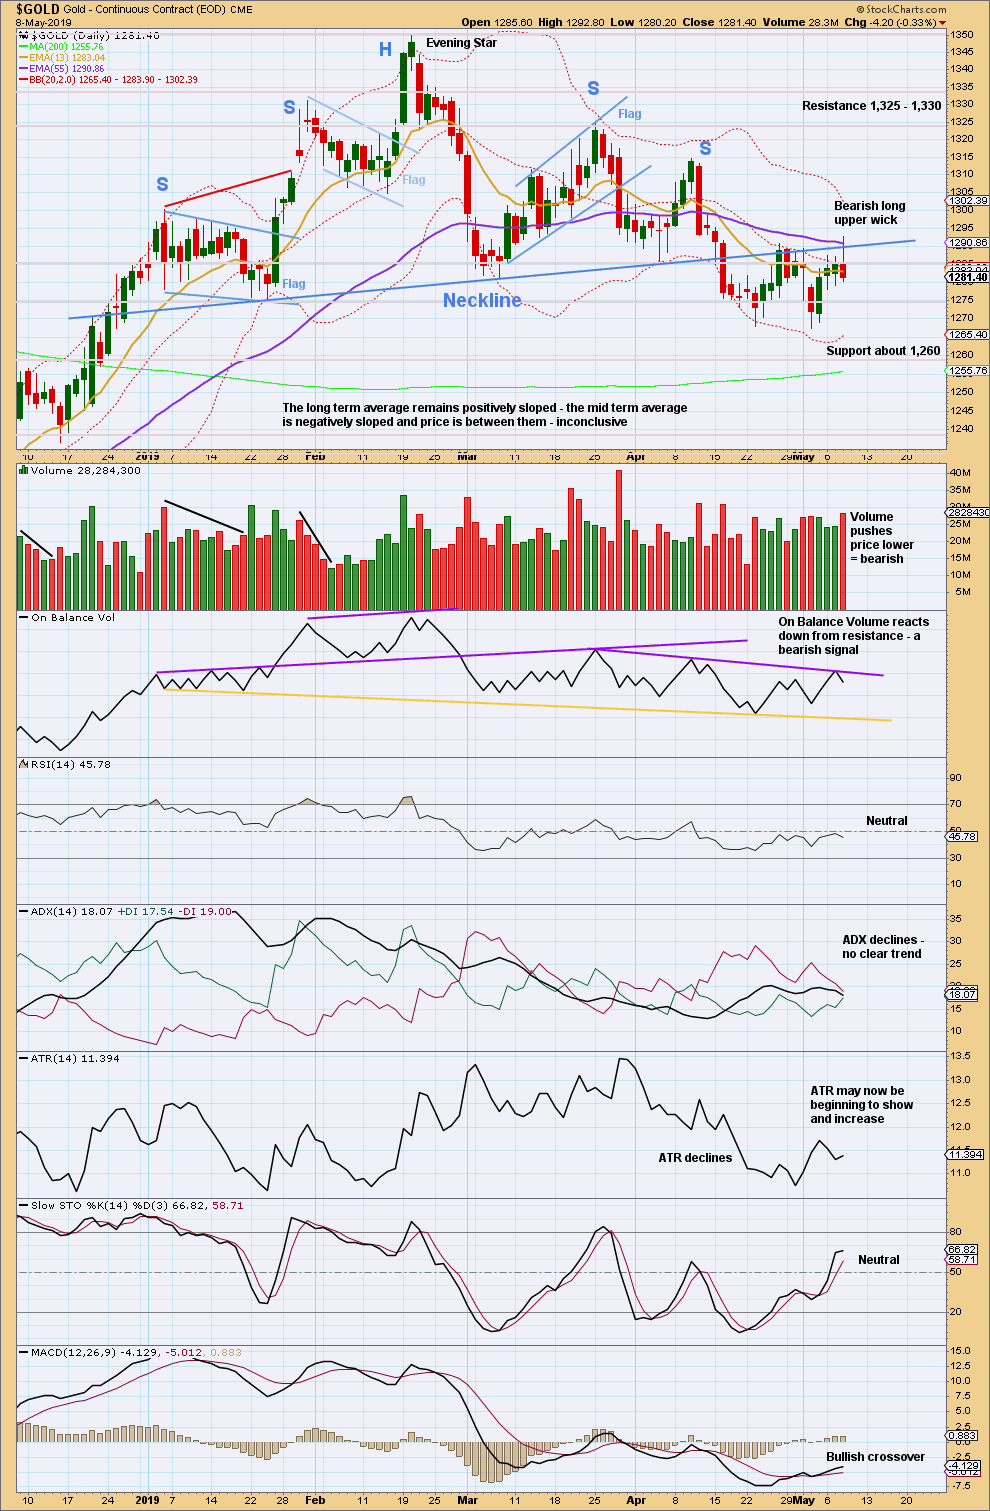
Click chart to enlarge. Chart courtesy of StockCharts.com.
From August 2018 Gold moved higher with a series of higher highs and higher lows. This series remained intact until the 1st of March 2019 when a lower low was made. At that stage, it was possible that Gold had seen a trend change.
There is now a new series of three lower swing highs and three lower swing lows (today may have been a slight continuation of the third swing high). This supports the idea that there has been a trend change and Gold is in a new downwards trend.
A complex Head and Shoulders pattern is identified. The neck line has been breached. A target is at 1,217.
Today price has reacted again downwards about the neck line of the Head and Shoulders pattern. The long upper wick and support from volume for downwards movement strongly suggest this small bounce may be complete. Expect a lower low to follow.
GDX WEEKLY CHART
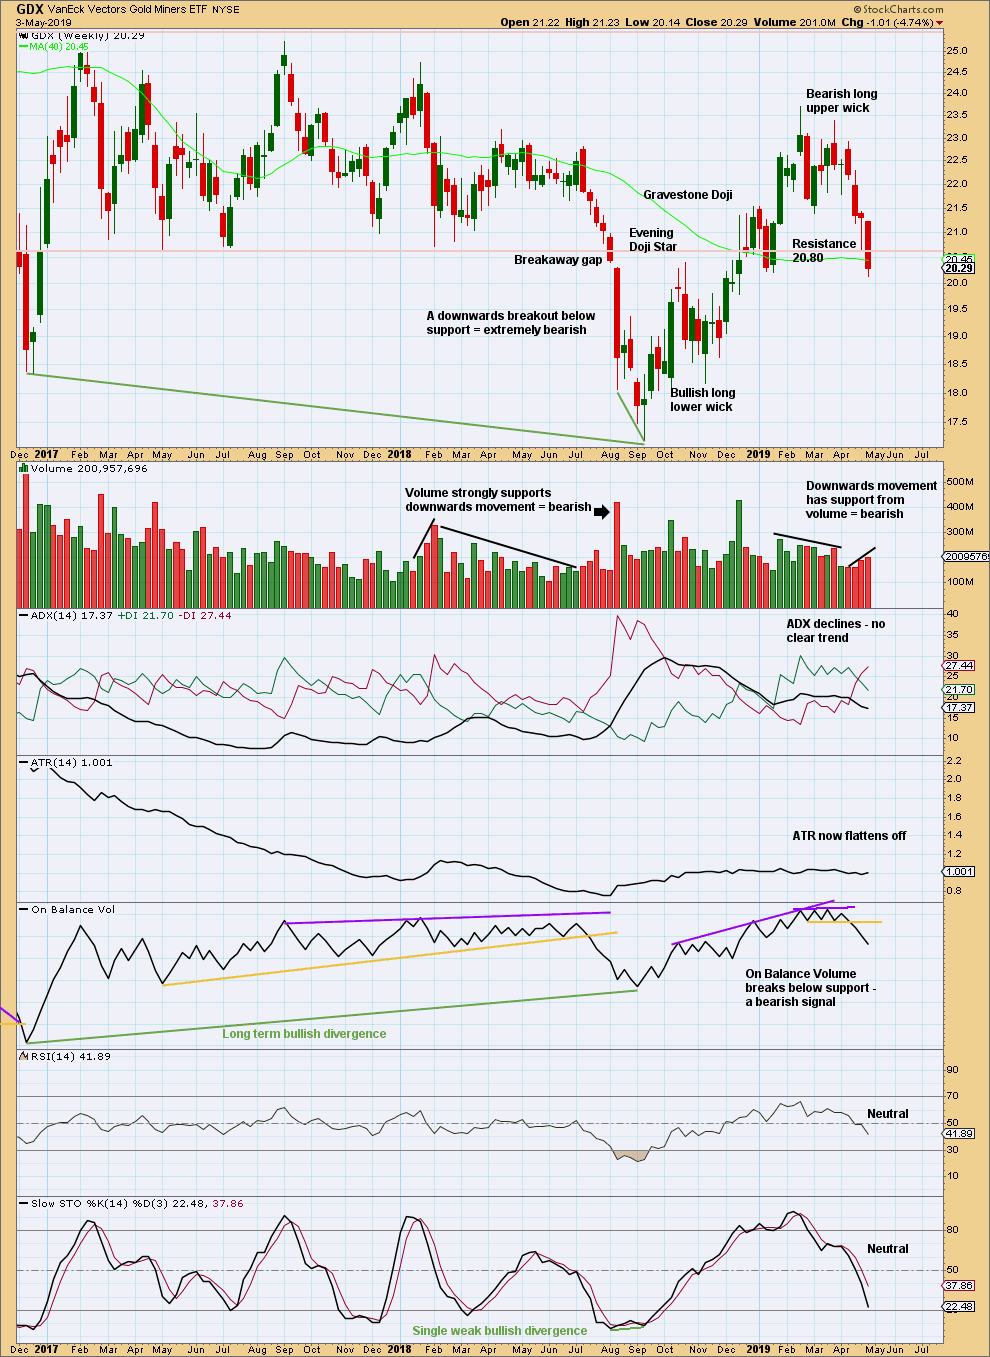
Click chart to enlarge. Chart courtesy of StockCharts.com.
There is now a series of two lower highs and lower lows at the weekly chart level. GDX may have seen a trend change to downwards, but ADX does not yet agree. The bearish signal from On Balance Volume supports this view.
Price has closed below 20.80. With volume pushing price lower, expect downwards movement to continue.
GDX DAILY CHART
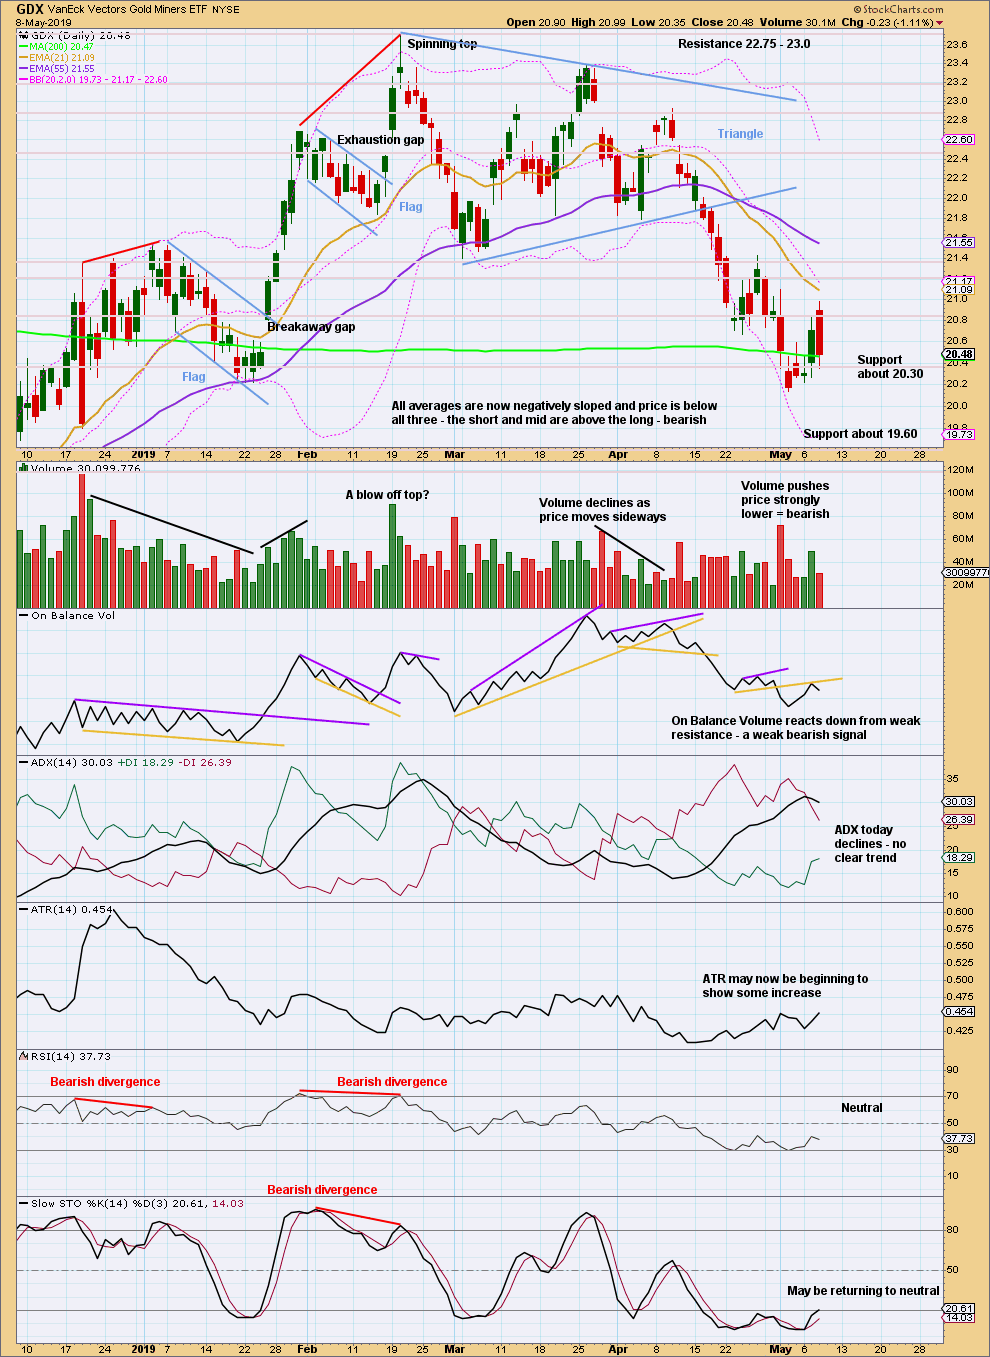
Click chart to enlarge. Chart courtesy of StockCharts.com.
A target calculated from the triangle width is now at 19.58.
The last swing high of the 26th of April at 21.43 may remain intact.
Published @ 10:20 p.m. EST.
—
Careful risk management protects your trading account(s).
Follow my two Golden Rules:
1. Always trade with stops.
2. Risk only 1-5% of equity on any one trade.
—
New updates to this analysis are in bold.
Hourly chart updated:
Subminutte ii may be now almost complete, I’m having difficulty seeing it as over at todays high. It may need one more high to end the structure.
Hi Lara
What’s your best guess for timeframe to gold target $1220?
Thanks
Maybe about another 5 weeks. This is a pretty general guess though, and if I’m wrong it could be quicker. Third waves tend to accelerate through the middle and can explode at the end.