
Two main Elliott wave counts are published today. Confidence and invalidation points will be used to indicate which is correct.
Summary: The main view today remains bullish. A mid-term target is now at 1,324 where a consolidation within the new upwards trend may develop. Confidence in this view would be had with a new high above 1,323.61.
However, if price continues lower in the next few hours and breaks below the acceleration channel on the hourly chart, then seriously consider the alternate daily chart. It is possible that a strong third wave down may be beginning, and its target is at 1,219. Confidence in this view would be had with a new low below 1,266.76.
Grand SuperCycle analysis is here.
Last monthly charts are here. Video is here.
MAIN ELLIOTT WAVE COUNT
WEEKLY CHART – TRIANGLE
Click chart to enlarge.
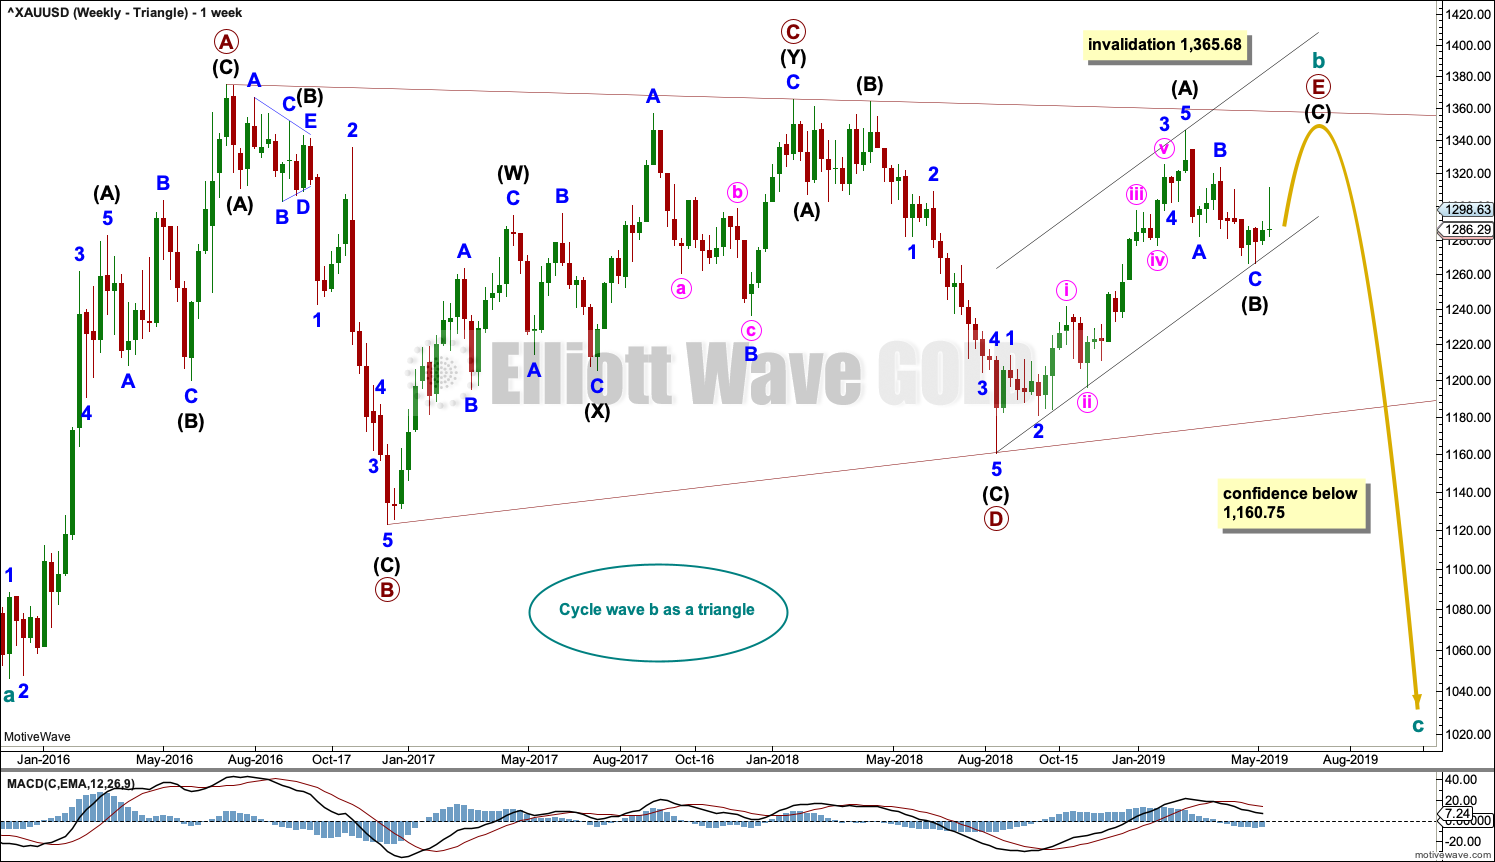
The basic Elliott wave structure is five waves up followed by three waves back (in a bull market). At this time, the preferred Elliott wave count sees Gold as still within three waves back, which began at the all time high in September 2011.
Five waves up are labelled 1,2,3,4,5. Three waves back are labelled A,B,C.
This wave count sees Gold as now about two thirds through the three waves back. The three wave structure is labelled cycle waves a, b and c.
The triangle for cycle wave b may still be incomplete. The final sub-wave of primary wave E may be an incomplete zigzag. Within the zigzag of primary wave E, intermediate wave (C) would be very likely to make at least a slight new high above the end of intermediate wave (A) to avoid a truncation.
Primary wave E may either undershoot or overshoot the A-C trend line. Primary wave E may not move beyond the end of primary wave C above 1,365.68.
Within the five sub-waves of an Elliott triangle, one sub-wave usually subdivides as a more complicated double zigzag and the most common sub-wave to do so is wave C.
DAILY CHART – TRIANGLE
Click chart to enlarge.
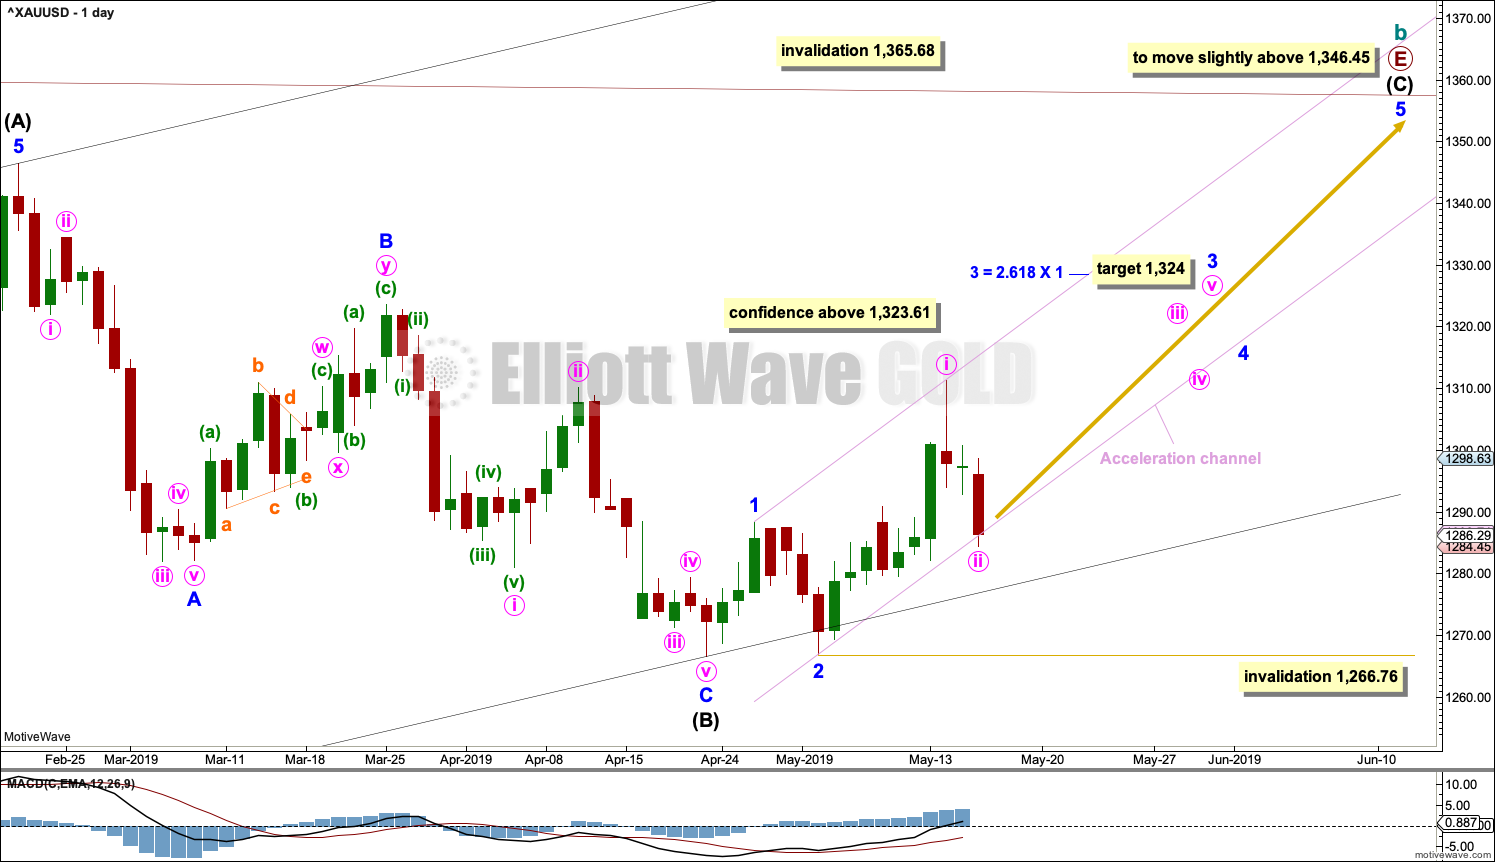
The final zigzag of primary wave E must subdivide 5-3-5. Intermediate wave (C) must subdivide as a five wave motive structure, most likely an impulse.
Within the impulse of intermediate wave (C), minor waves 1 and 2 may be complete.
Minor wave 3 may only subdivide as an impulse. A target is calculated for it to end.
Draw an acceleration channel about upwards movement. Draw the first trend line from the end of minor wave 1 to the last high, then place a parallel copy on the end of minor wave 2. Keep redrawing the channel as price continues higher.
Within minor wave 3, minute waves i and ii may be complete. Minute wave ii may have found support about the lower edge of the acceleration channel. If it continues lower, then minute wave ii may not move beyond the start of minute wave i below 1,266.76.
This wave count now expects to see a strong increase in upwards momentum as a third wave at two degrees unfolds.
HOURLY CHART

Click chart to enlarge.
Within the impulse of minor wave 3, minute wave ii may have ended at the low for today’s session. Minute wave ii subdivides as a complete three wave zigzag.
If price continues lower and breaks below the lower edge of the acceleration channel, then the alternate below should be seriously considered.
It is still possible that minute wave v to end minor wave 3 may end with a blow off top.
WEEKLY CHART – TRIANGLE – ALTERNATE
Click chart to enlarge.
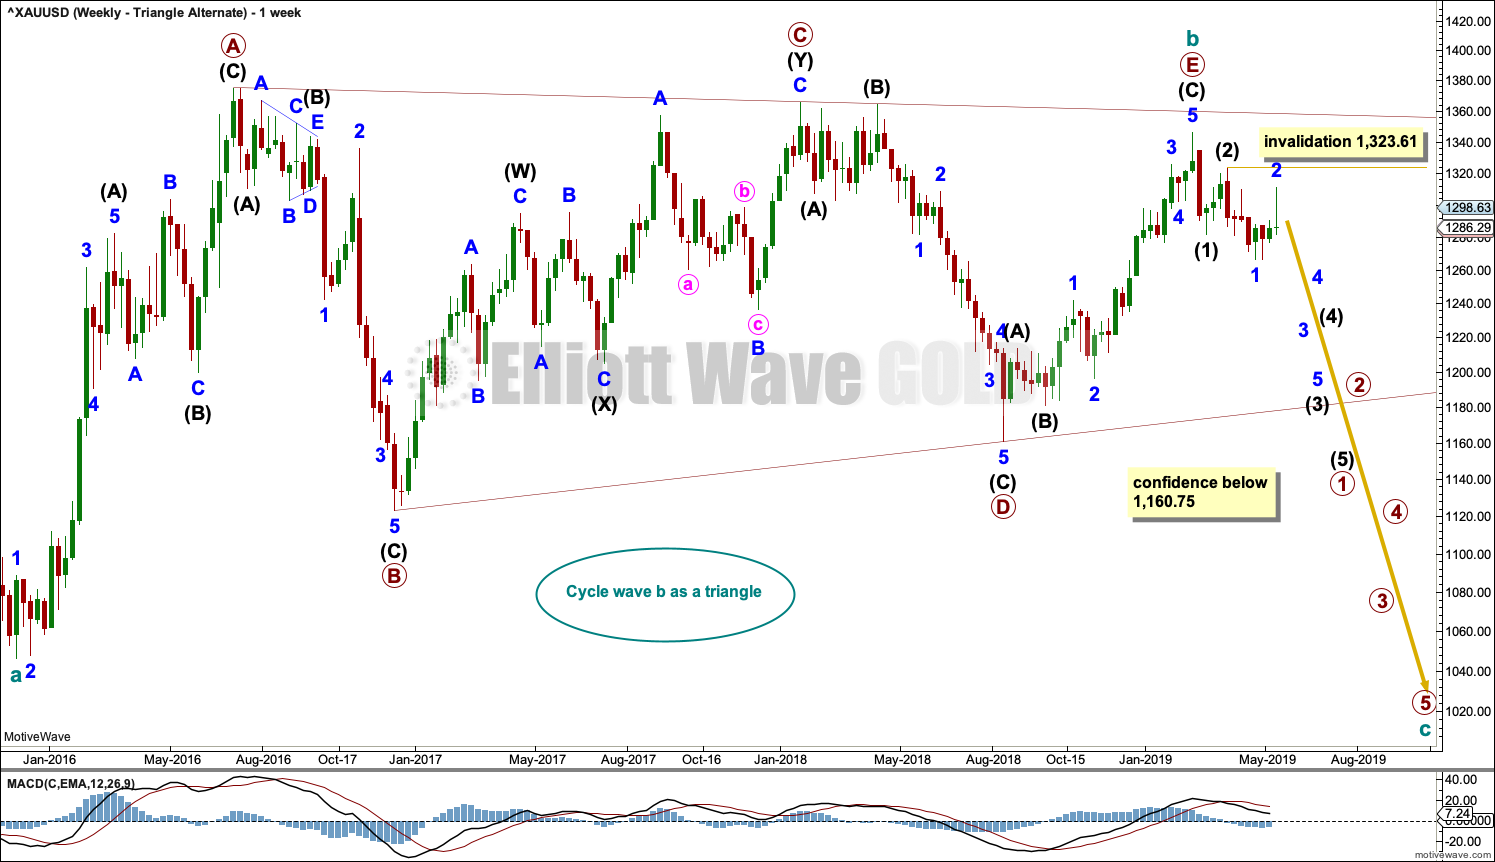
This wave count was the preferred count up until the 13th of May. It remains possible that the triangle of cycle wave b is complete and cycle wave c downwards has begun.
Within the final wave of the triangle, primary wave E may be a complete zigzag.
Cycle wave c must subdivide as a five wave structure at primary degree, with primary waves 1, 2, 3, 4 and 5. So far primary wave 1 for this wave count would be incomplete.
Primary wave 1 must subdivide as a five wave structure at intermediate degree. So far intermediate waves (1) and (2) may be complete.
Intermediate wave (3) may only subdivide as a five wave impulse at minor degree. So far minor waves 1 and 2 may be complete. If minor wave 2 continues higher, it may not move beyond the start of minor wave 1 above 1,323.61.
DAILY CHART – TRIANGLE – ALTERNATE
Click chart to enlarge.
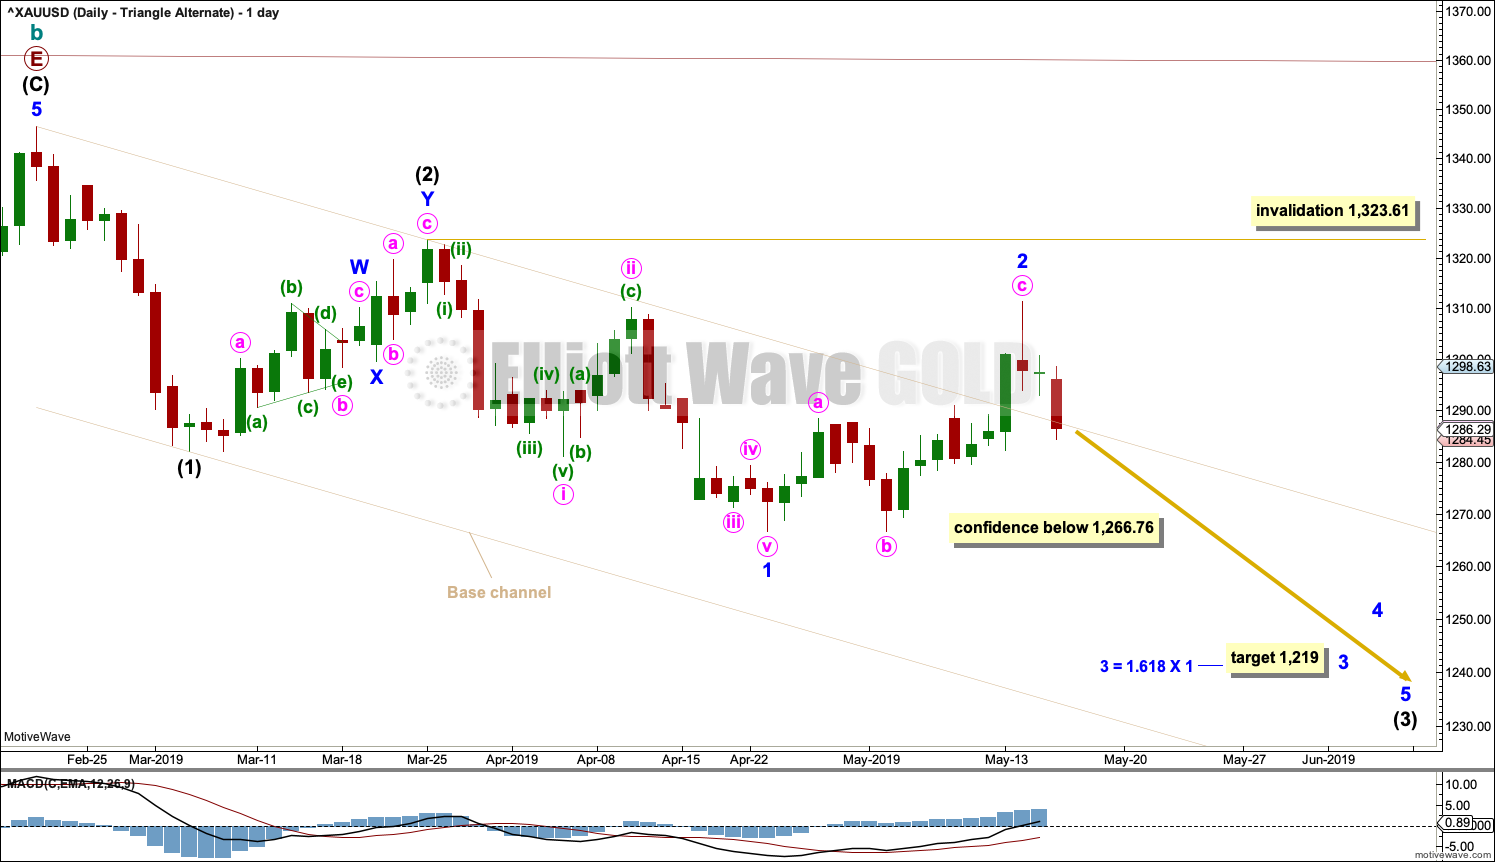
A target is calculated for minor wave 3 to end based upon the most common Fibonacci ratio to minor wave 1.
A base channel is drawn about intermediate waves (1) and (2). The first trend line of a base channel is drawn from the start of the first wave to the end of the second wave, then a parallel copy is placed upon the end of the first wave. Lower degree second wave corrections in a bear market usually find resistance at the upper edge of the base channel. In this instance, minor wave 2 did not find resistance at the upper edge of the base channel; the channel is breached, which does not invalidate the wave count but does reduce the probability.
This wave count requires a new low below 1,266.76 now for confidence.
This wave count now expects to see a strong increase in downwards momentum.
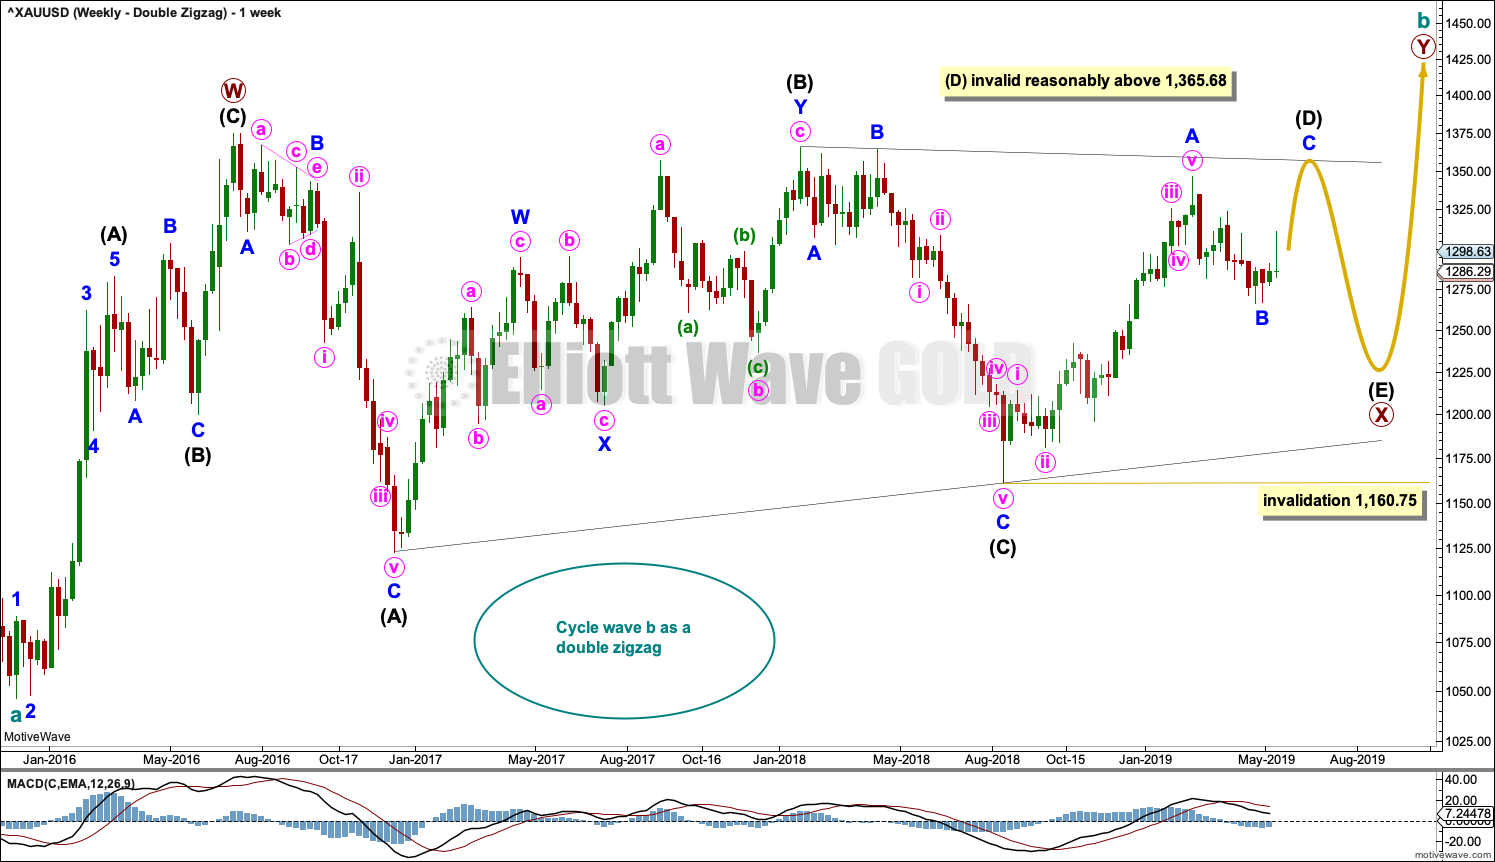
WEEKLY CHART – DOUBLE ZIGZAG
Click chart to enlarge.
This wave count is identical to the first weekly chart up to the low labelled cycle wave a. Thereafter, a different Elliott wave corrective structure is considered for cycle wave b.
It is possible that cycle wave b may be an incomplete double zigzag or a double combination.
The first zigzag in the double is labelled primary wave W. This has a good fit.
The double may be joined by a corrective structure in the opposite direction, a triangle labelled primary wave X. The triangle may be incomplete.
Within multiples, X waves are almost always zigzags and rarely triangles. Within the possible triangle of primary wave X, it is intermediate wave (B) that is a multiple; this is acceptable, but note this is not the most common triangle sub-wave to subdivide as a multiple. These two points reduce the probability of this wave count in terms of Elliott wave.
Intermediate wave (D) of a contracting triangle may not move beyond the end of intermediate wave (B) above 1,365.68.
Intermediate wave (D) of a barrier triangle may end about the same level as intermediate wave (B); as long as the (B)-(D) trend line remains essentially flat the triangle will remain valid. This is the only Elliott wave rule that is not black and white. In practice, intermediate wave (D) may end slightly above intermediate wave (B) at 1,365.68 and this wave count would remain valid.
Primary wave Y would most likely be a zigzag because primary wave X would be shallow; double zigzags normally have relatively shallow X waves.
Primary wave Y may also be a flat correction if cycle wave b is a double combination, but combinations normally have deep X waves. This would be less likely.
This wave count has good proportions and no problems in terms of subdivisions.
It is also possible for this wave count that intermediate wave (D) was over at the last high and that intermediate wave (E) downwards may continue, in the same way as the alternate wave count above.
ALTERNATE ELLIOTT WAVE COUNT
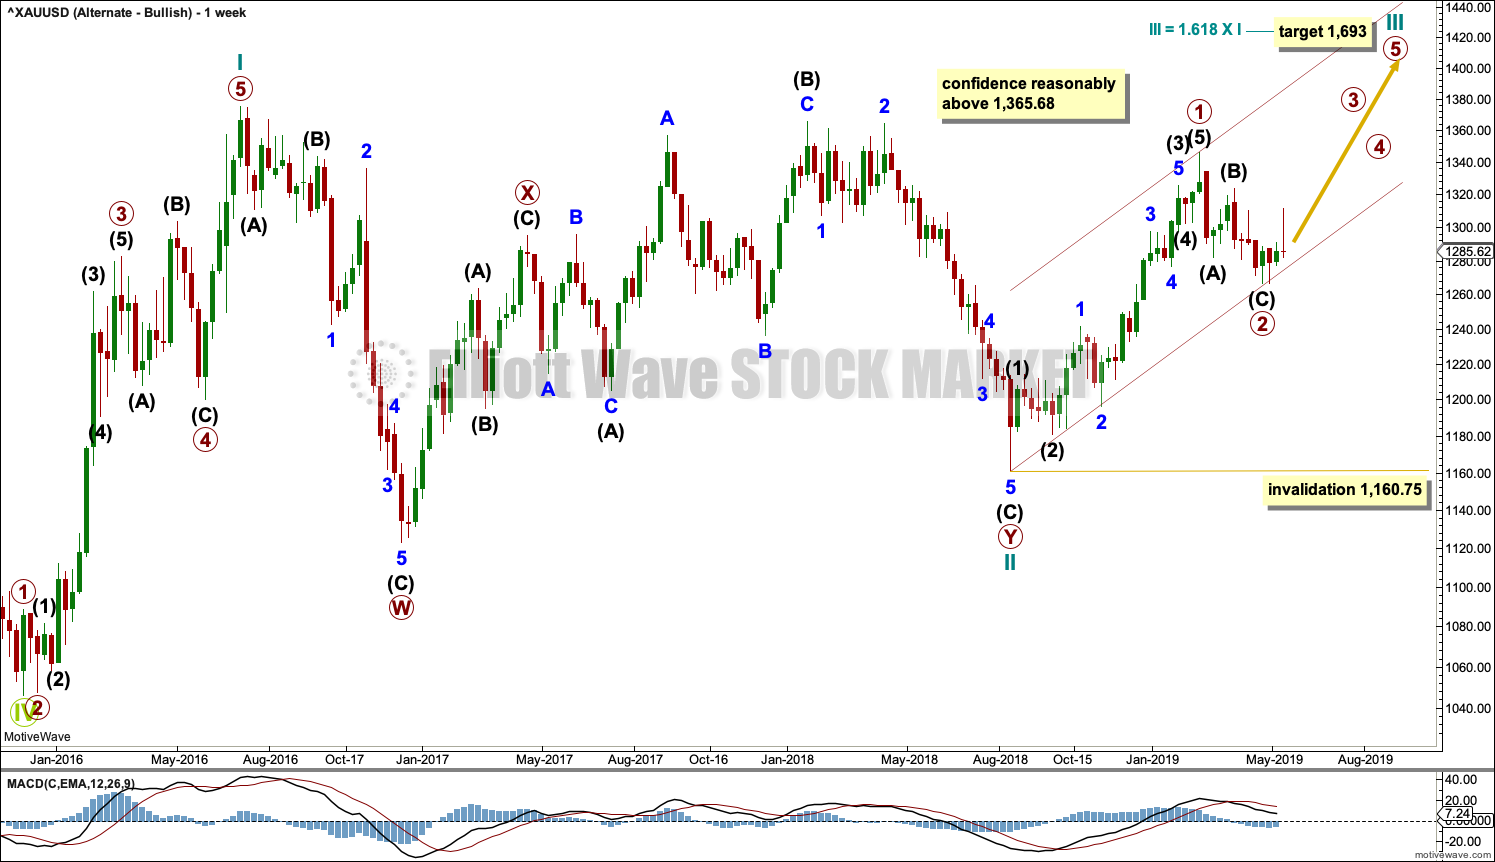
WEEKLY CHART
Click chart to enlarge.
This wave count sees the three waves back now complete at the last major low for Gold in November 2019.
If Gold is in a new bull market, then it should begin with a five wave structure upwards on the weekly chart. However, the biggest problem with this wave count is the structure labelled cycle wave I because this wave count must see it as a five wave structure, but it looks more like a three wave structure.
Commodities often exhibit swift strong fifth waves that force the fourth wave corrections coming just prior and just after to be more brief and shallow than their counterpart second waves. It is unusual for a commodity to exhibit a quick second wave and a more time consuming fourth wave, and this is how cycle wave I is labelled. The probability of this wave count is low due to this problem.
Cycle wave II subdivides well as a double combination: zigzag – X – expanded flat.
Cycle wave III may have begun. Within cycle wave III, primary waves 1 and 2 may now be complete. If it continues lower as a double zigzag, then primary wave 2 may not move beyond the start of primary wave 1 below 1,160.75.
Cycle wave III so far for this wave count would have been underway now for 39 weeks. It should be beginning to exhibit some support from volume, increase in upwards momentum and increasing ATR. However, ATR continues to decline and is very low, and momentum is weak in comparison to cycle wave I. This wave count lacks support from classic technical analysis.
TECHNICAL ANALYSIS
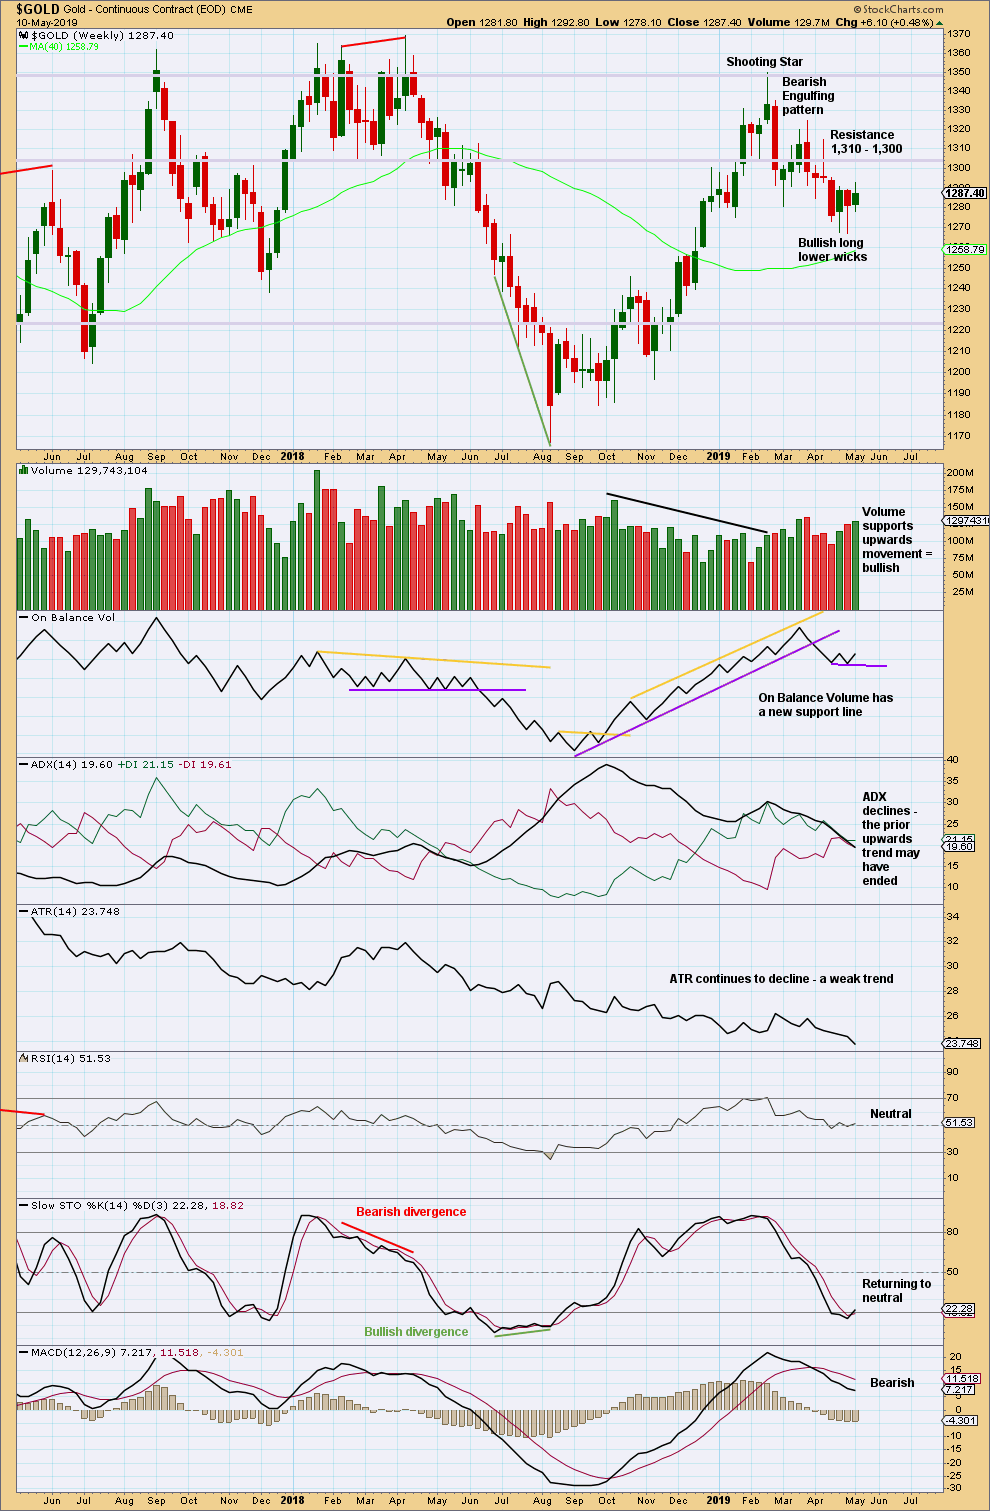
WEEKLY CHART
Click chart to enlarge. Chart courtesy of StockCharts.com.
A small range week has some support from volume, but the small range and lack of any bullish candlestick pattern does not make a convincing bounce. This may be a smaller counter trend movement that may continue a little higher before it is done.
However, the strong upwards day for Monday’s session now puts that view in doubt. Price is back at now weak resistance about 1,300 to 1,310.
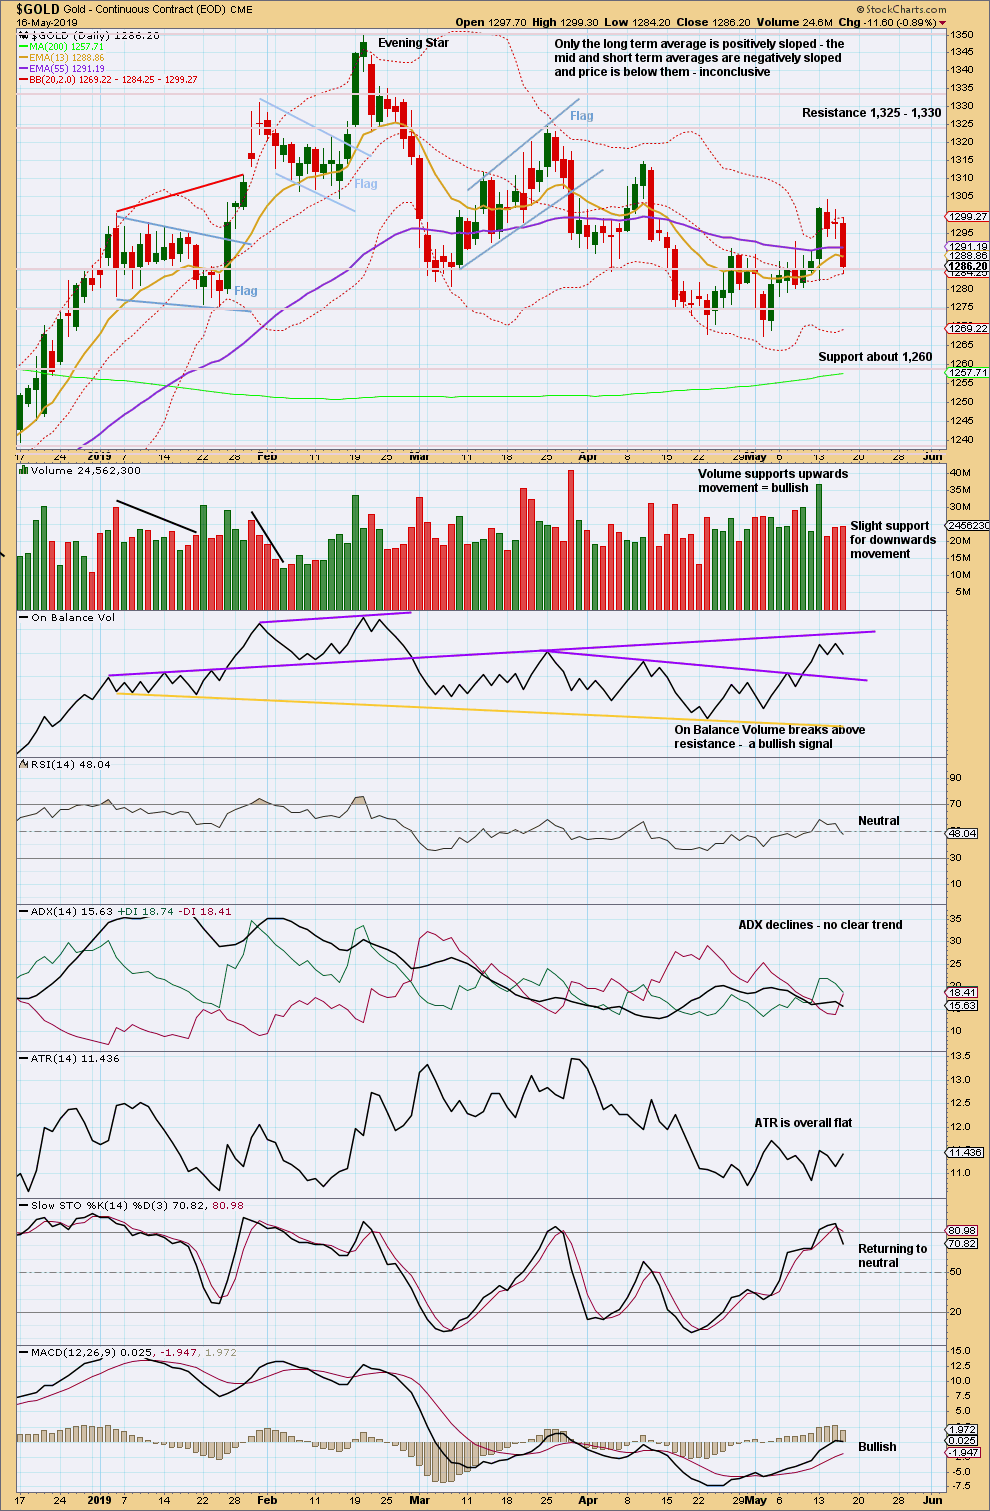
DAILY CHART
Click chart to enlarge. Chart courtesy of StockCharts.com.
From August 2018 Gold moved higher with a series of higher highs and higher lows. This series remained intact until the 1st of March 2019 when a lower low was made. At that stage, it was possible that Gold had seen a trend change.
There is now a new series of three lower swing highs and three lower swing lows. While the last high of the 10th of April remains intact, a new trend change would remain possible.
For the very short term, some small increase in volume today suggests a little more downwards movement ahead. However, very strong volume for the 13th of May still suggests overall a bullish short-term volume profile.
GDX WEEKLY CHART
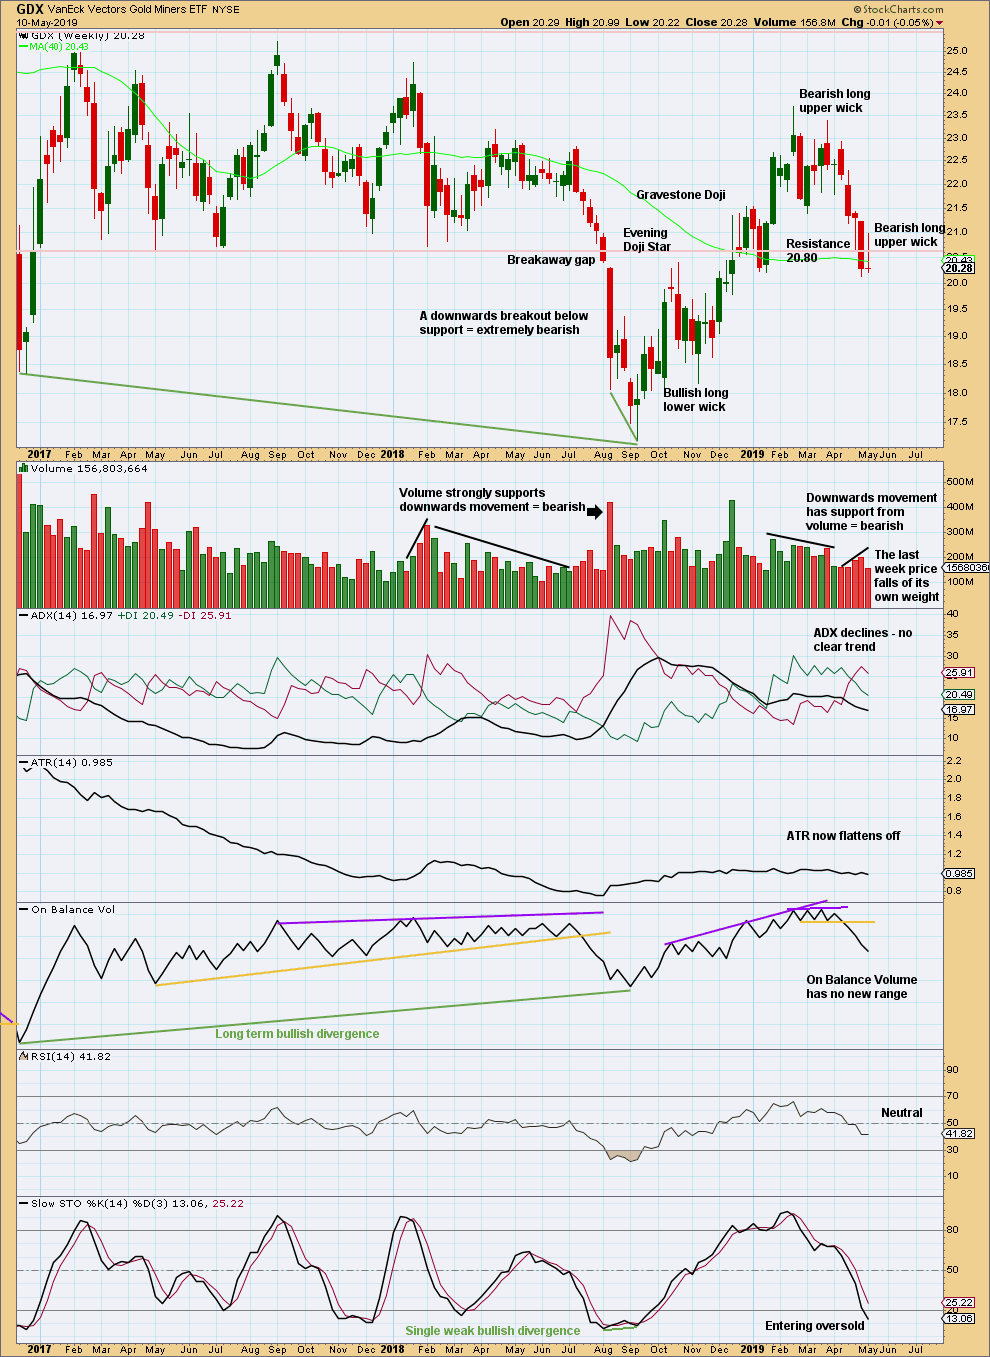
Click chart to enlarge. Chart courtesy of StockCharts.com.
There is now a series of two lower highs and lower lows at the weekly chart level. GDX may have seen a trend change to downwards, but ADX does not yet agree. The bearish signal from On Balance Volume supports this view.
Price has closed below 20.80. Expect downwards movement to continue.
GDX DAILY CHART
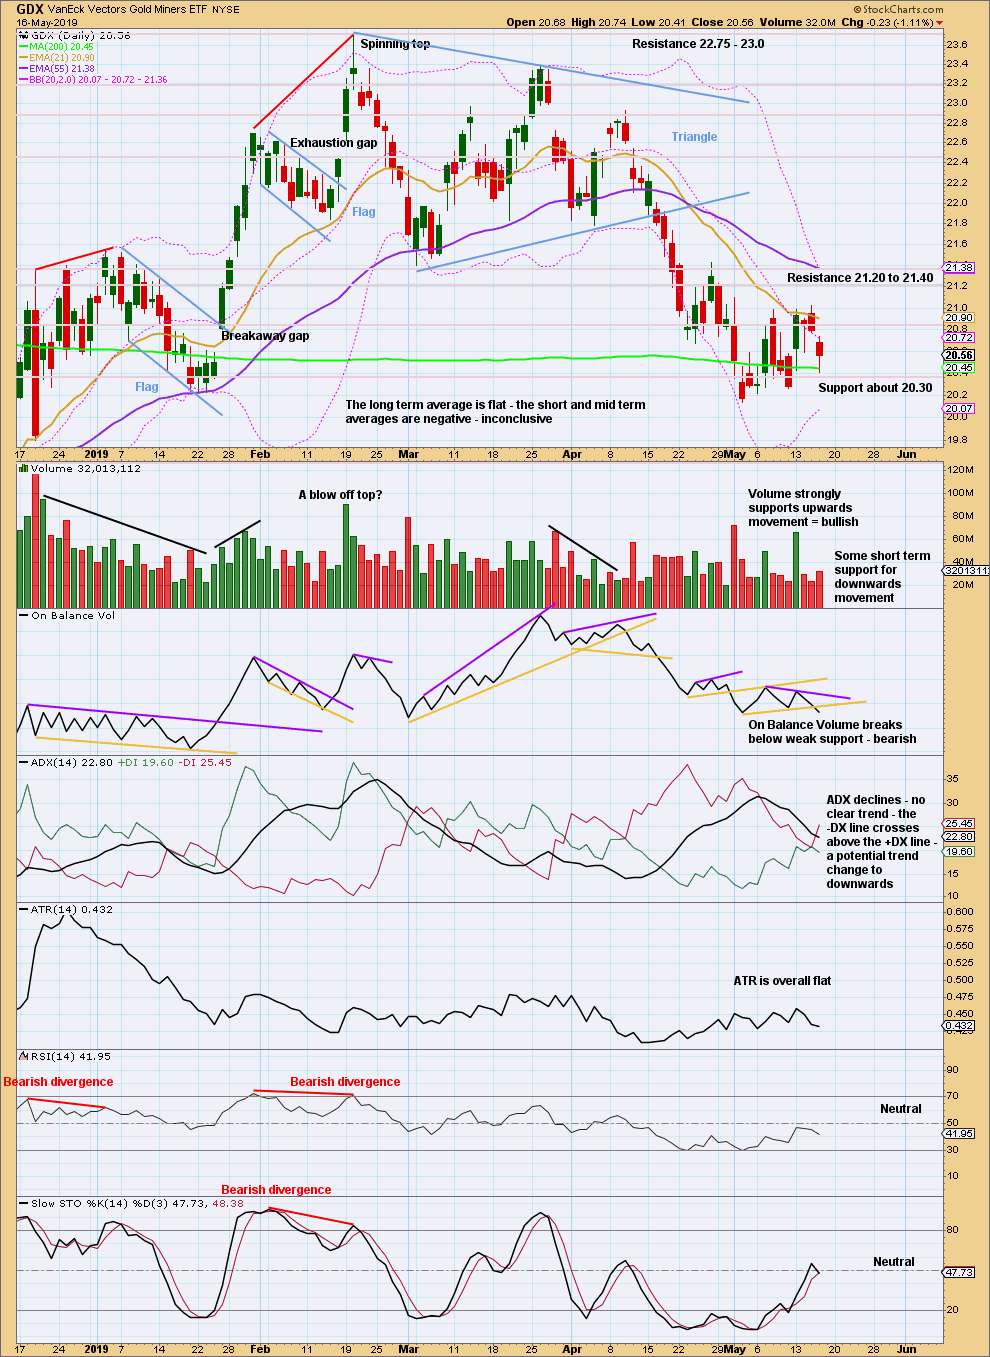
Click chart to enlarge. Chart courtesy of StockCharts.com.
A target calculated from the triangle width is now at 19.58.
The last swing high of the 26th of April at 21.43 may remain intact.
Today a bearish signal from On Balance Volume supports the idea that GDX may be still within a downwards trend to the target.
Published @ 09:04 p.m. EST.
—
Careful risk management protects your trading account(s).
Follow my two Golden Rules:
1. Always trade with stops.
2. Risk only 1-5% of equity on any one trade.
—
New updates to this analysis are in bold.
I’m updating a daily chart today.
This is the alternate. Which I may need to switch back to the main, or just label the two daily charts 1 and 2 and sit on the fence.
Price is back within the base channel after minor 2 breached it. Base channels mostly work to show where lower degree second wave corrections find support or resistance, but not always. Sometimes Gold can breach a base channel early on in a movement as it forms deeper and more time consuming second waves. Then it accelerates through to the middle of a third wave, exploding at the end. This forms curved impulses, very typical of this market. It makes channels very difficult to draw.
Now that for this idea minor 2 should be clearly over, the invalidation point and risk may be moved down.
If the target for minor 3 is wrong it may not be low enough.
For the main / first daily chart (as it is labelled in the analysis published above, it may not be after the close of this session) note that price is now back down at the lower edge of the black channel. This is the black channel that is drawn on the weekly chart about all of primary wave E.
For this count, this channel must provide support. If this channel is breached I would confidently discard this wave count. Because this late in a movement (late within primary wave E that is) the channel should be respected. Gold does not behave well with channels often, but it misbehaves early on in a movement. At the end the problem should be on the other side, an overshoot of a channel in the direction of the trend showing strength as it forms blow off tops or selling climaxes. Not a breach of a channel against a trend this late in the trend. That is not normal behaviour for this market.
Risk is now at 1,266.76 for this count, not too far away.
If there is strength in downward movement today and / or a bearish signal from On Balance Volume, this count may be discarded.
Bottom line: price is range bound with resistance at 1,311 and support at 1,267.
A breakout may be expected to be followed by strong movement in the direction of the breakout.
A hedge here may be a good option.
Possible reward to the downside may be about 1,219 but also may be reasonably below this point.
Reward to the upside may be about 1,346.
I feel like we’re here… finally… the defining points/pics of which way we’re really going. It’s exciting. Really like the explanations you (Lara) provided in today’s update.
I’m profiting & positioned for more downside, but we will see. Happy trading next week everyone. [exclamation point]
Thank you so much dsprospering.
I feel like I’ve done a horrible flip flop this week, bearish to bullish and now back to bearish. As you know, I don’t like sitting on fences, I find it rather uncomfortable.
So it’s good to hear you’re able to use this analysis to position for the next movement.
Argh … I hope this jumps back – which Fed days can !!
I had what would have been a beautiful short set up, until talk of another sweep higher in the Big ‘b’
Fingers crossed !!!
Price is still within minor 1 territory. If the alternate is correct (and I may need to switch again or sit on the fence) then any short position opened before minor 3 moves below the end of minor 1 may be held throughout minor 4.
Because when minor 3 is done, minor 4 may be expected to be relatively brief and shallow and must remain below minor 1 price territory.
So it may be held until the end of intermediate (3).
Perhaps a hedge?