
A reasonably strong downwards day fits the expectation from the main Elliott wave count.
Summary: Resistance is about 1,310 and support is about 1,265.
A downwards breakout this week may still be more likely. The target would then be at 1,219 (which may not be low enough).
However, the target would be at 1,346 if there is an upwards breakout with support from volume.
Grand SuperCycle analysis is here.
Last monthly charts are here. Video is here.
MAIN ELLIOTT WAVE COUNT
WEEKLY CHART – TRIANGLE
Click chart to enlarge.
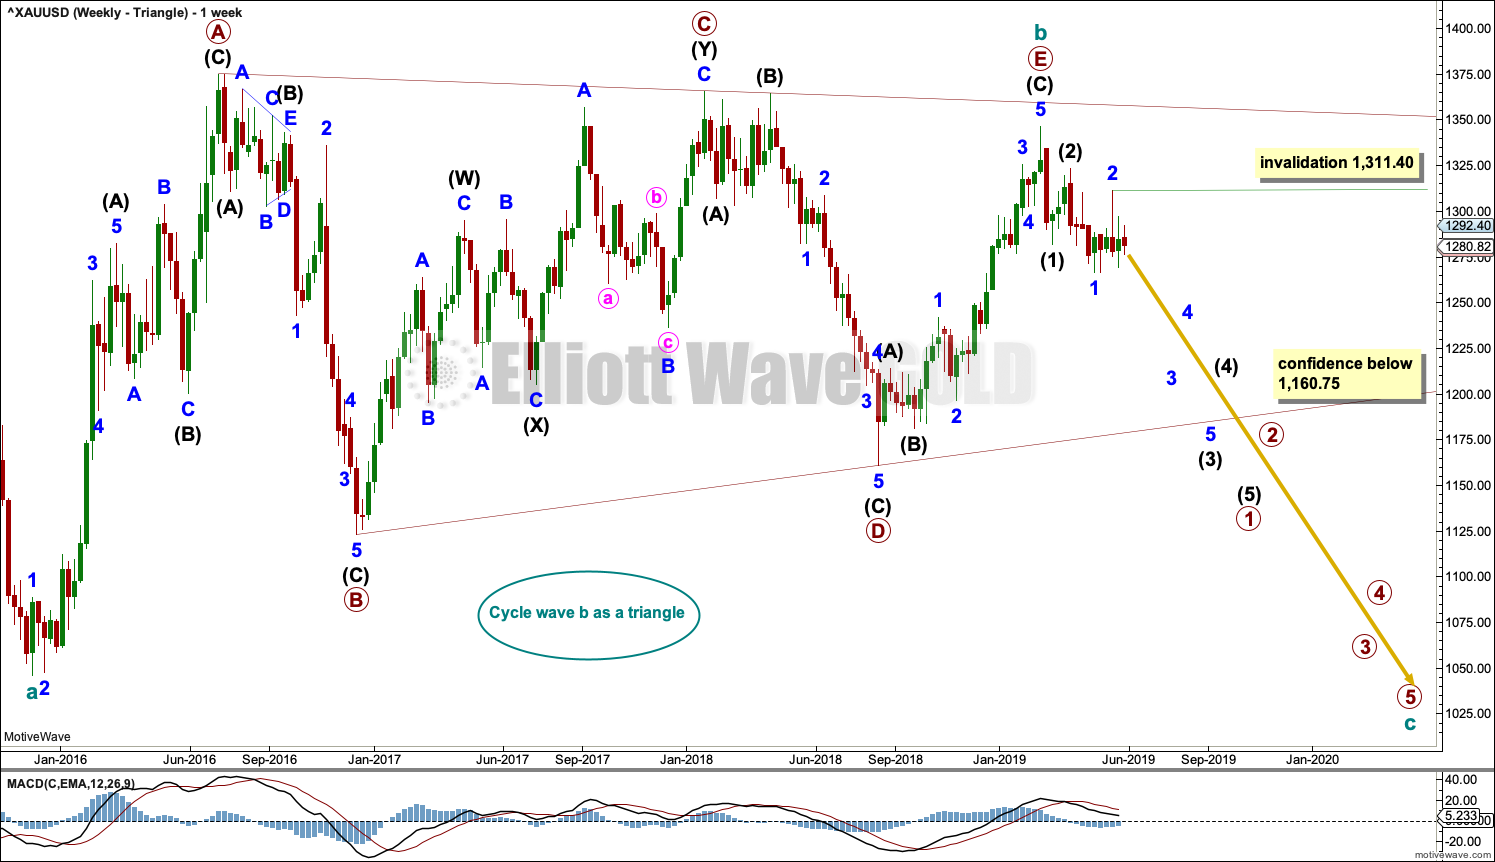
The basic Elliott wave structure is five waves up followed by three waves back (in a bull market). At this time, the preferred Elliott wave count sees Gold as still within three waves back, which began at the all time high in September 2011.
Five waves up are labelled 1,2,3,4,5. Three waves back are labelled A,B,C.
This wave count sees Gold as now about two thirds through the three waves back. The three wave structure is labelled cycle waves a, b and c.
It remains possible that the triangle of cycle wave b is complete and cycle wave c downwards has begun.
Within the final wave of the triangle, primary wave E may be a complete zigzag.
Cycle wave c must subdivide as a five wave structure at primary degree, with primary waves 1, 2, 3, 4 and 5. So far primary wave 1 for this wave count would be incomplete.
Primary wave 1 must subdivide as a five wave structure at intermediate degree. So far intermediate waves (1) and (2) may be complete.
Intermediate wave (3) may only subdivide as a five wave impulse at minor degree. So far minor waves 1 and 2 may be complete.
Minor wave 3 may only subdivide as a five wave impulse at minute degree. Within minor wave 3, minute wave ii may not move beyond the start of minute wave i above 1,311.40.
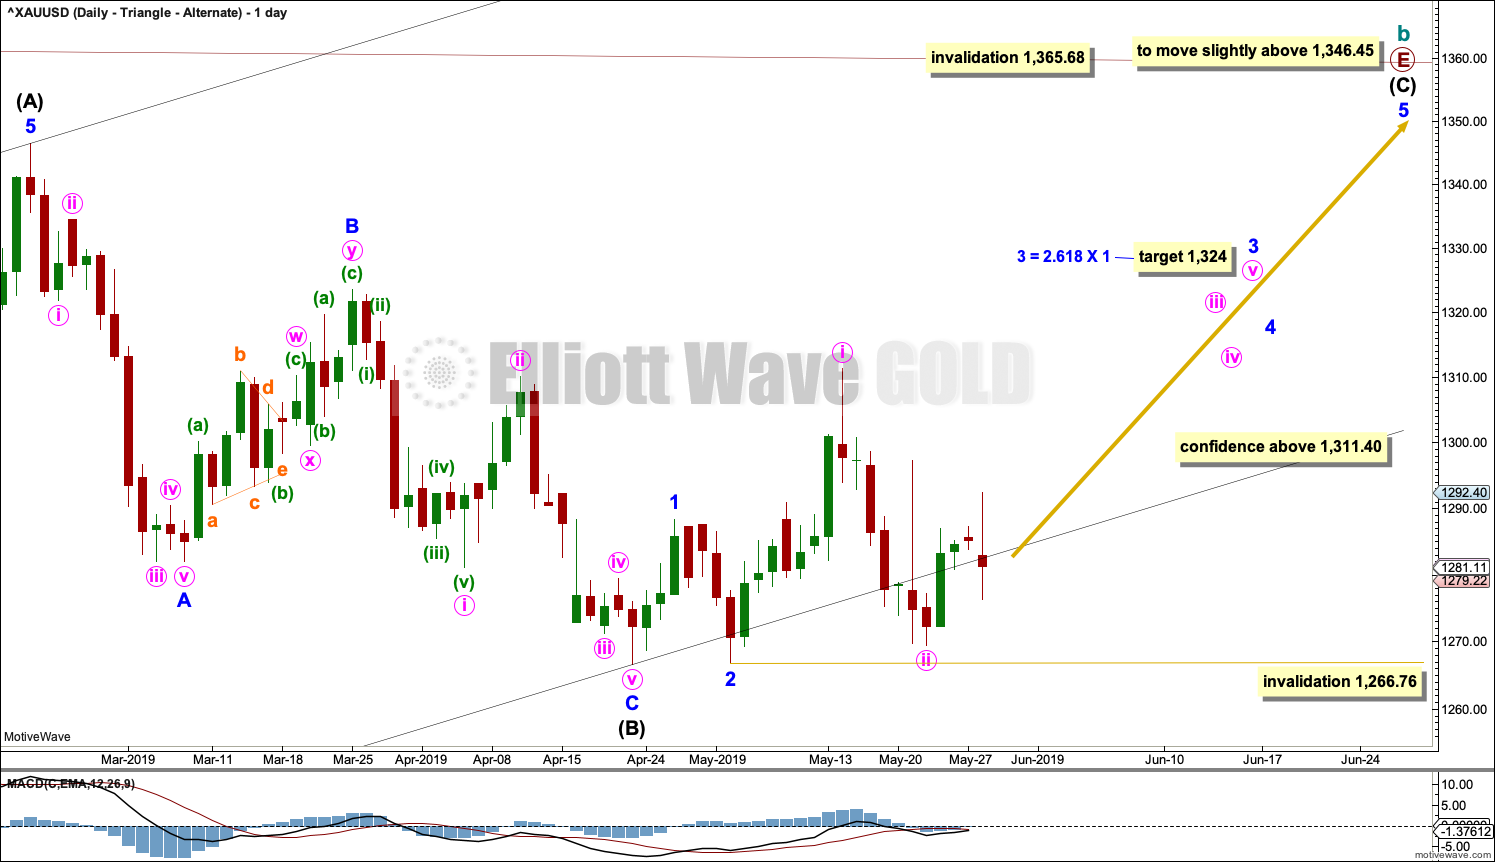
DAILY CHART – TRIANGLE
Click chart to enlarge.
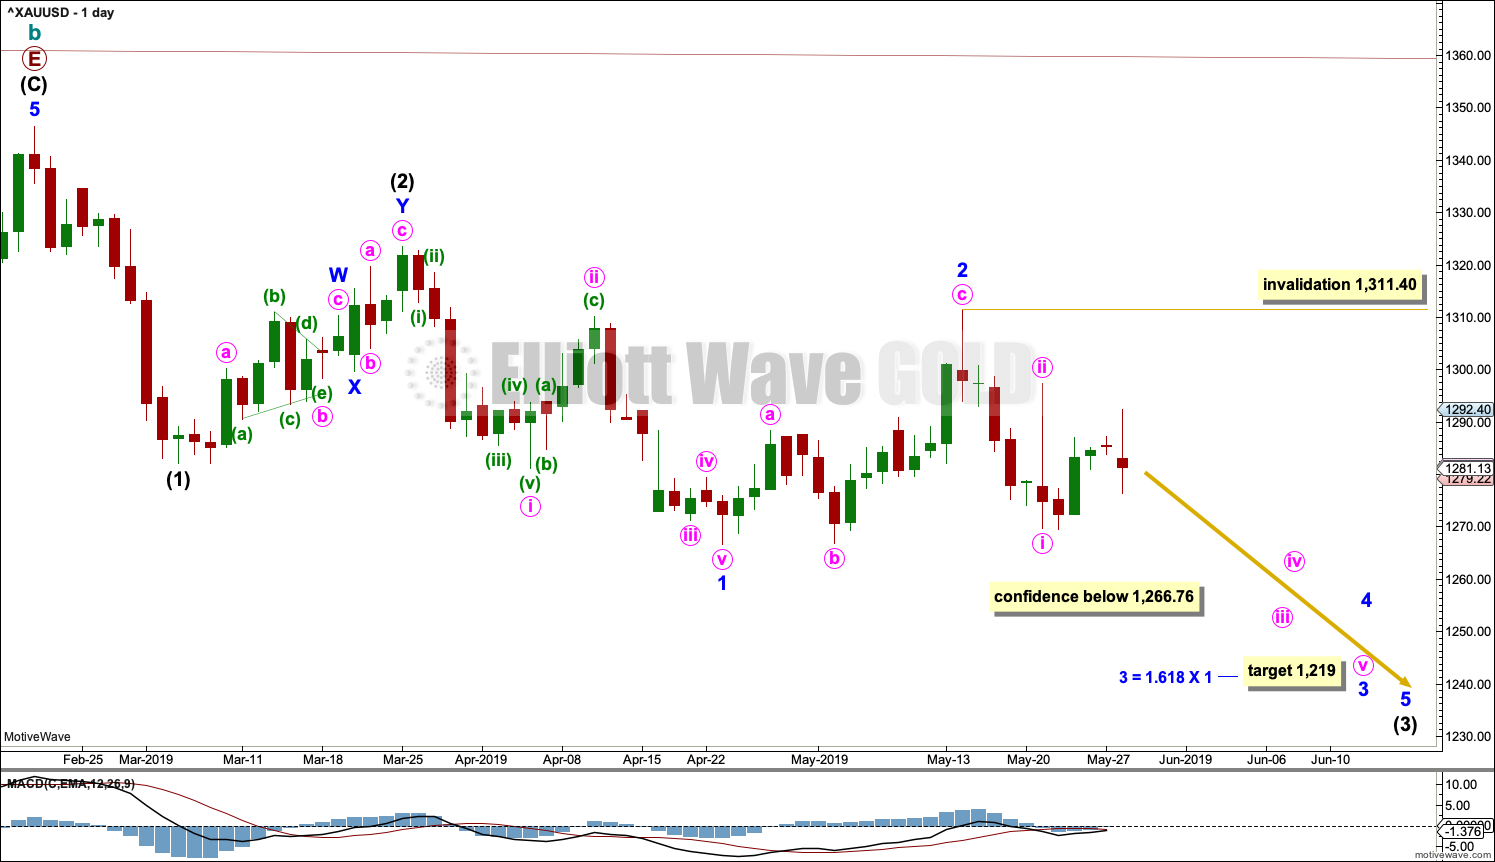
A target is calculated for minor wave 3 to end based upon the most common Fibonacci ratio to minor wave 1.
The base channel is today removed as it was not showing where bounces were finding resistance.
Gold usually begins new trends slowly with deep and time consuming second wave corrections. The trend usually accelerates through the middle of the third wave and may exhibit explosive movement at the end of third waves.
This wave count requires a new low below 1,266.76 for confidence.
This wave count now expects to see a strong increase in downwards momentum.
HOURLY CHART
Click chart to enlarge.
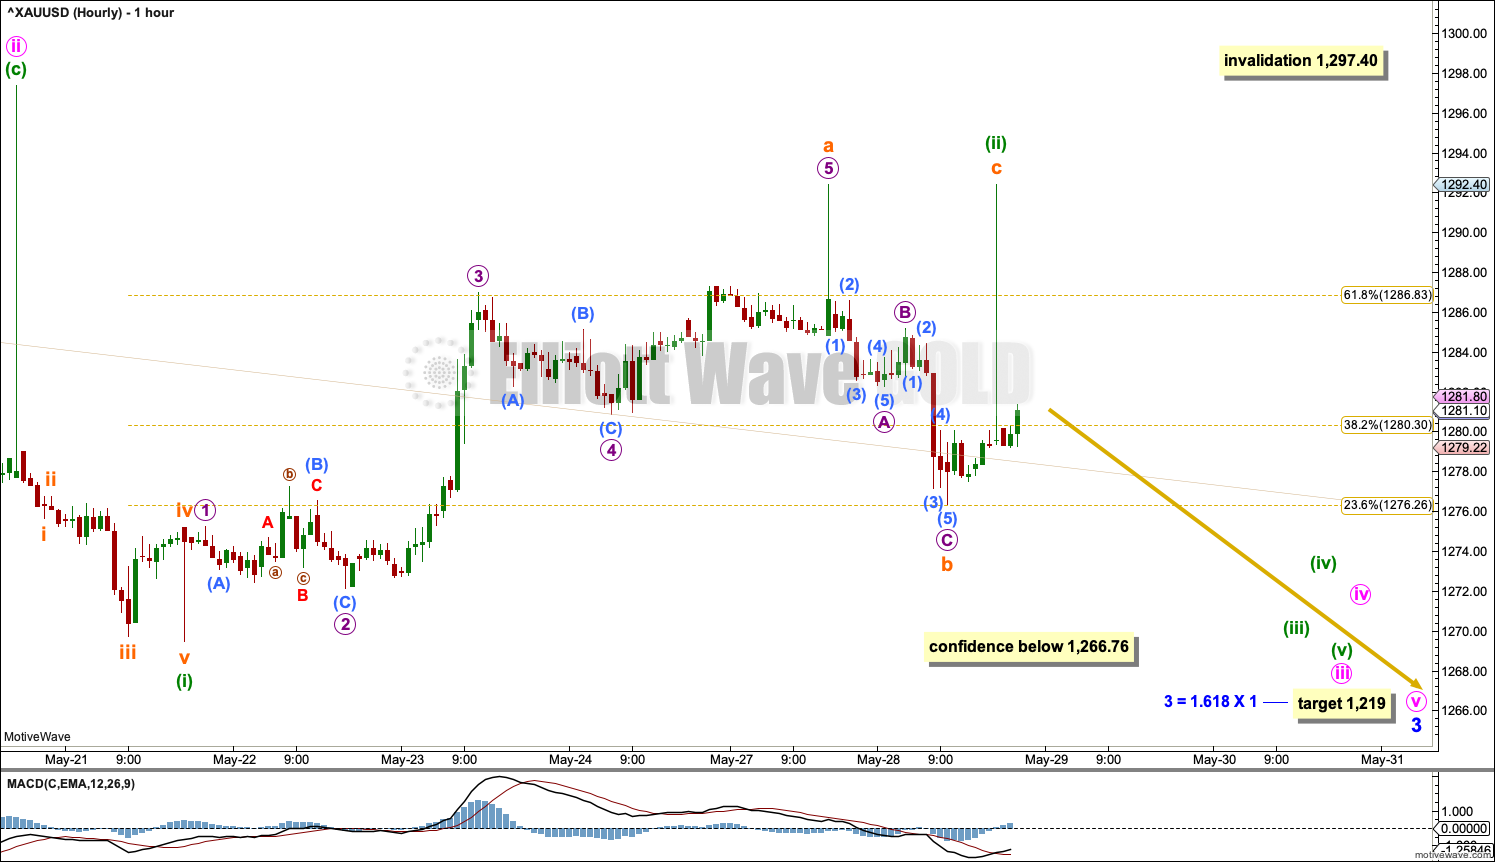
Minor wave 3 may only subdivide as an impulse at minute degree. Within the impulse, minute waves i and ii may now be complete.
Minute wave iii may only subdivide as an impulse. Within the impulse, minuette wave (ii) may not move beyond the start of minuette wave (i) above 1,297.40.
Minuette wave (ii) may again be a complete zigzag. As the middle of a third wave at three degrees begins an increase in downwards momentum may be expected.
A new low below 1,266.76 would invalidate the alternate below and provide confidence in this main wave count.
WEEKLY CHART – TRIANGLE – ALTERNATE
Click chart to enlarge.
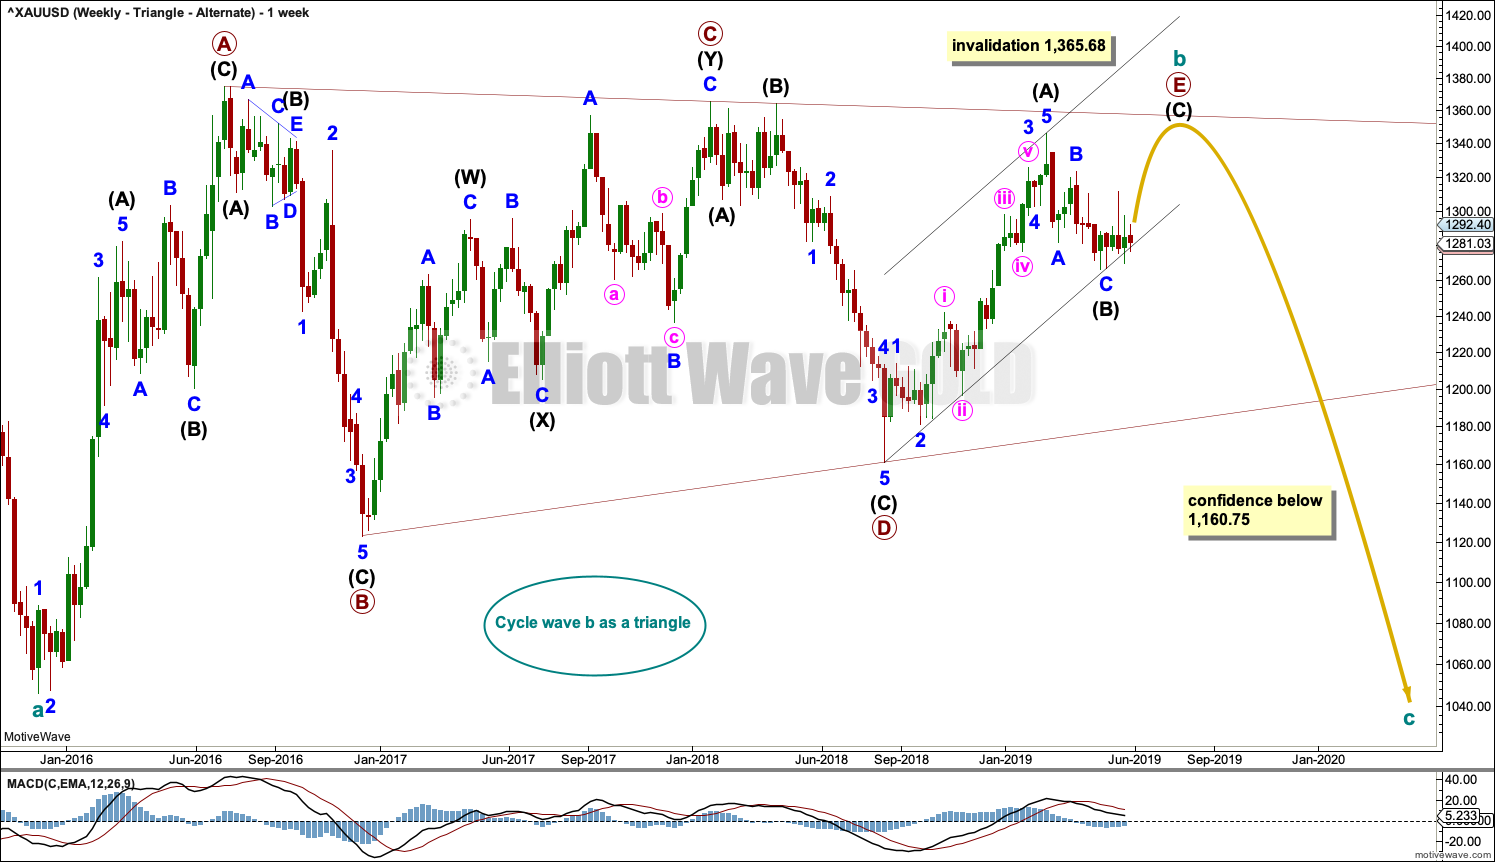
The triangle for cycle wave b may still be incomplete. The final sub-wave of primary wave E may be an incomplete zigzag. Within the zigzag of primary wave E, intermediate wave (C) would be very likely to make at least a slight new high above the end of intermediate wave (A) to avoid a truncation.
Primary wave E may either undershoot or overshoot the A-C trend line. Primary wave E may not move beyond the end of primary wave C above 1,365.68.
Within the five sub-waves of an Elliott triangle, one sub-wave usually subdivides as a more complicated double zigzag and the most common sub-wave to do so is wave C.
Draw a channel about the zigzag of primary wave E using Elliott’s technique. Draw the first trend line from the start of intermediate wave (A) to the end of intermediate wave (B), then place a parallel copy on the end of intermediate wave (A). While intermediate wave (C) continues higher, the lower edge of the channel should provide support. Copy the channel over to the daily chart.
DAILY CHART – TRIANGLE – ALTERNATE
Click chart to enlarge.
The final zigzag of primary wave E must subdivide 5-3-5. Intermediate wave (C) must subdivide as a five wave motive structure, most likely an impulse.
Within the impulse of intermediate wave (C), minor waves 1 and 2 may be complete.
Minor wave 3 may only subdivide as an impulse. A target is calculated for it to end.
Within minor wave 3, minute waves i and ii may be complete. Minute wave ii has breached the black Elliott channel. This does not have a normal look and reduces the probability of this wave count. While Gold does not always fit neatly within channels, breaches on the side opposite to the trend are more likely early in a movement and unlikely later in a movement.
If it continues lower, then minute wave ii may not move beyond the start of minute wave i below 1,266.76.
This wave count now expects to see a strong increase in upwards momentum as a third wave at two degrees unfolds.
HOURLY CHART – TRIANGLE – ALTERNATE
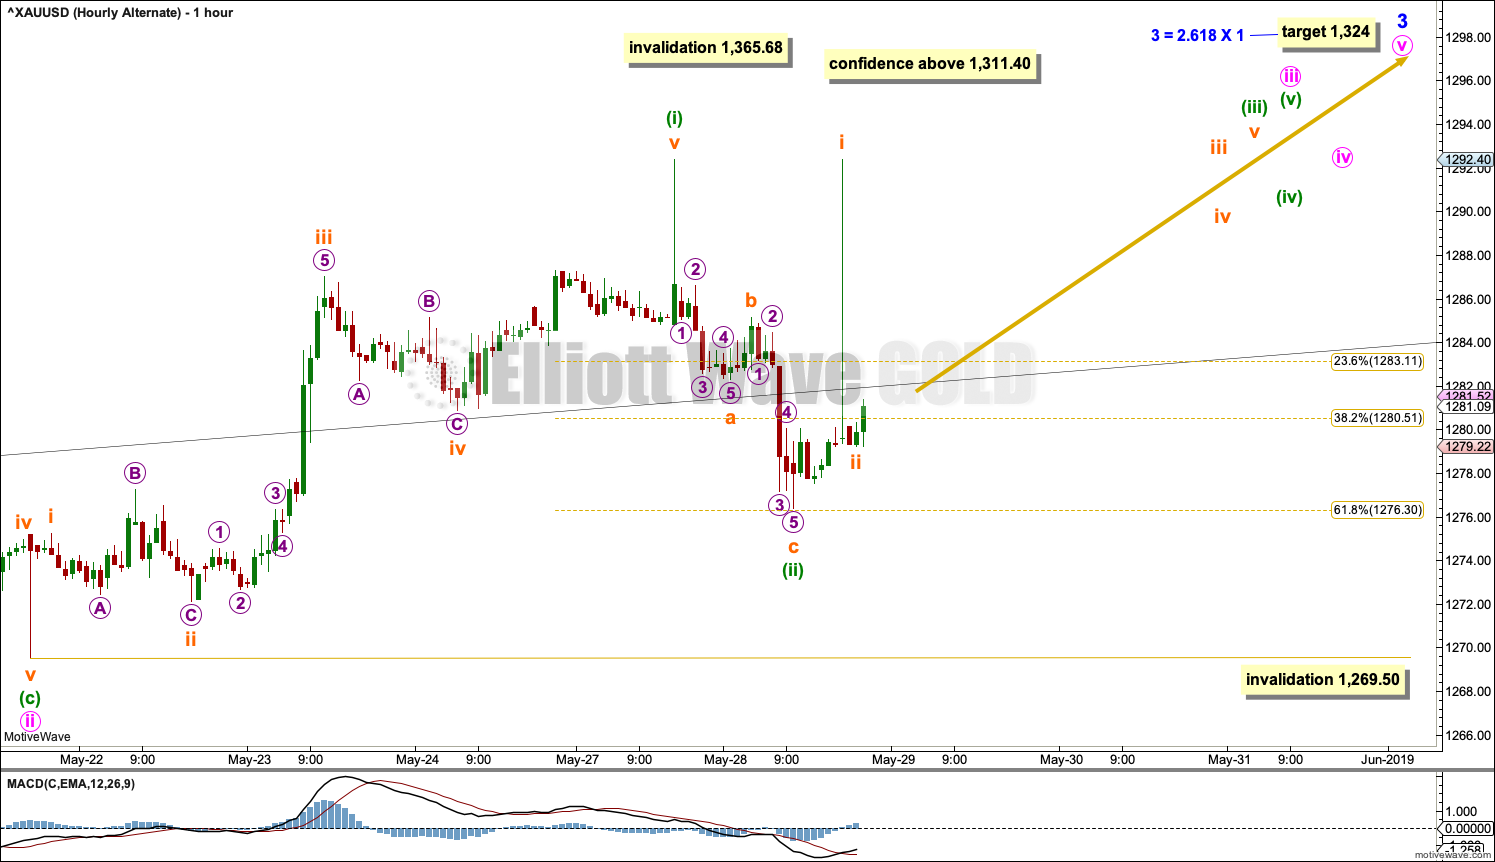
Click chart to enlarge.
Minute wave ii may be a complete zigzag ending well below the lower edge of the black channel, which is copied over from the weekly and daily charts. The strong breach of this channel has reduced the probability of this wave count.
This wave count requires a new high above 1,311.40 for reasonable confidence.
Minute wave iii may only subdivide as an impulse. So far within it minuette wave (i) may be complete. Minuette wave (ii) may not move beyond the start of minuette wave (i) below 1,269.50.
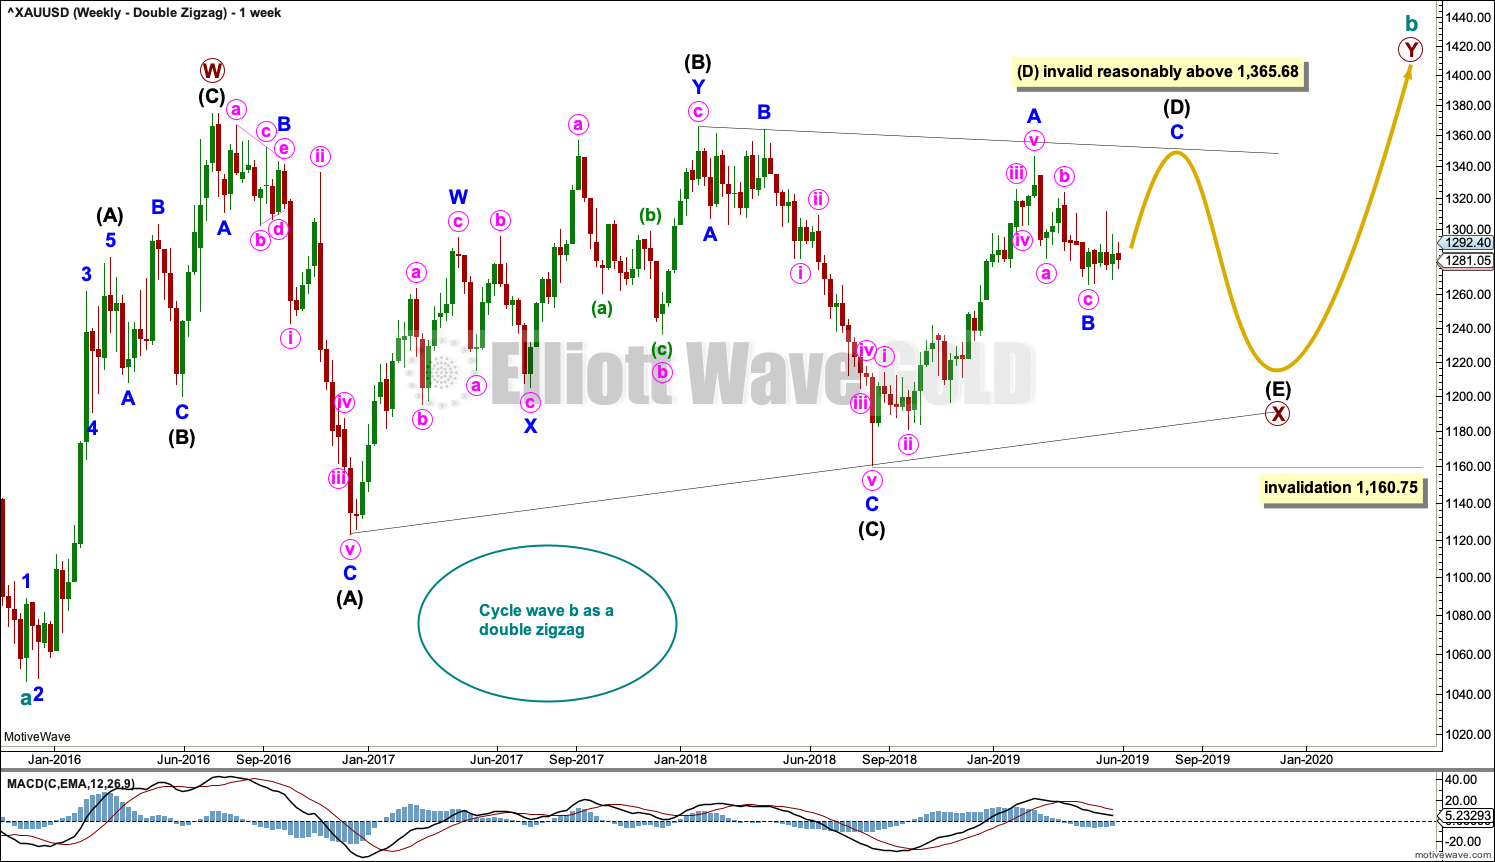
WEEKLY CHART – DOUBLE ZIGZAG
Click chart to enlarge.
This wave count is identical to the first weekly chart up to the low labelled cycle wave a. Thereafter, a different Elliott wave corrective structure is considered for cycle wave b.
It is possible that cycle wave b may be an incomplete double zigzag or a double combination.
The first zigzag in the double is labelled primary wave W. This has a good fit.
The double may be joined by a corrective structure in the opposite direction, a triangle labelled primary wave X. The triangle may be incomplete.
Within multiples, X waves are almost always zigzags and rarely triangles. Within the possible triangle of primary wave X, it is intermediate wave (B) that is a multiple; this is acceptable, but note this is not the most common triangle sub-wave to subdivide as a multiple. These two points reduce the probability of this wave count in terms of Elliott wave.
Intermediate wave (D) of a contracting triangle may not move beyond the end of intermediate wave (B) above 1,365.68.
Intermediate wave (D) of a barrier triangle may end about the same level as intermediate wave (B); as long as the (B)-(D) trend line remains essentially flat the triangle will remain valid. This is the only Elliott wave rule that is not black and white. In practice, intermediate wave (D) may end slightly above intermediate wave (B) at 1,365.68 and this wave count would remain valid.
Primary wave Y would most likely be a zigzag because primary wave X would be shallow; double zigzags normally have relatively shallow X waves.
Primary wave Y may also be a flat correction if cycle wave b is a double combination, but combinations normally have deep X waves. This would be less likely.
This wave count has good proportions and no problems in terms of subdivisions.
It is also possible for this wave count that intermediate wave (D) was over at the last high and that intermediate wave (E) downwards may continue, in the same way as the main wave count above.
ALTERNATE ELLIOTT WAVE COUNT
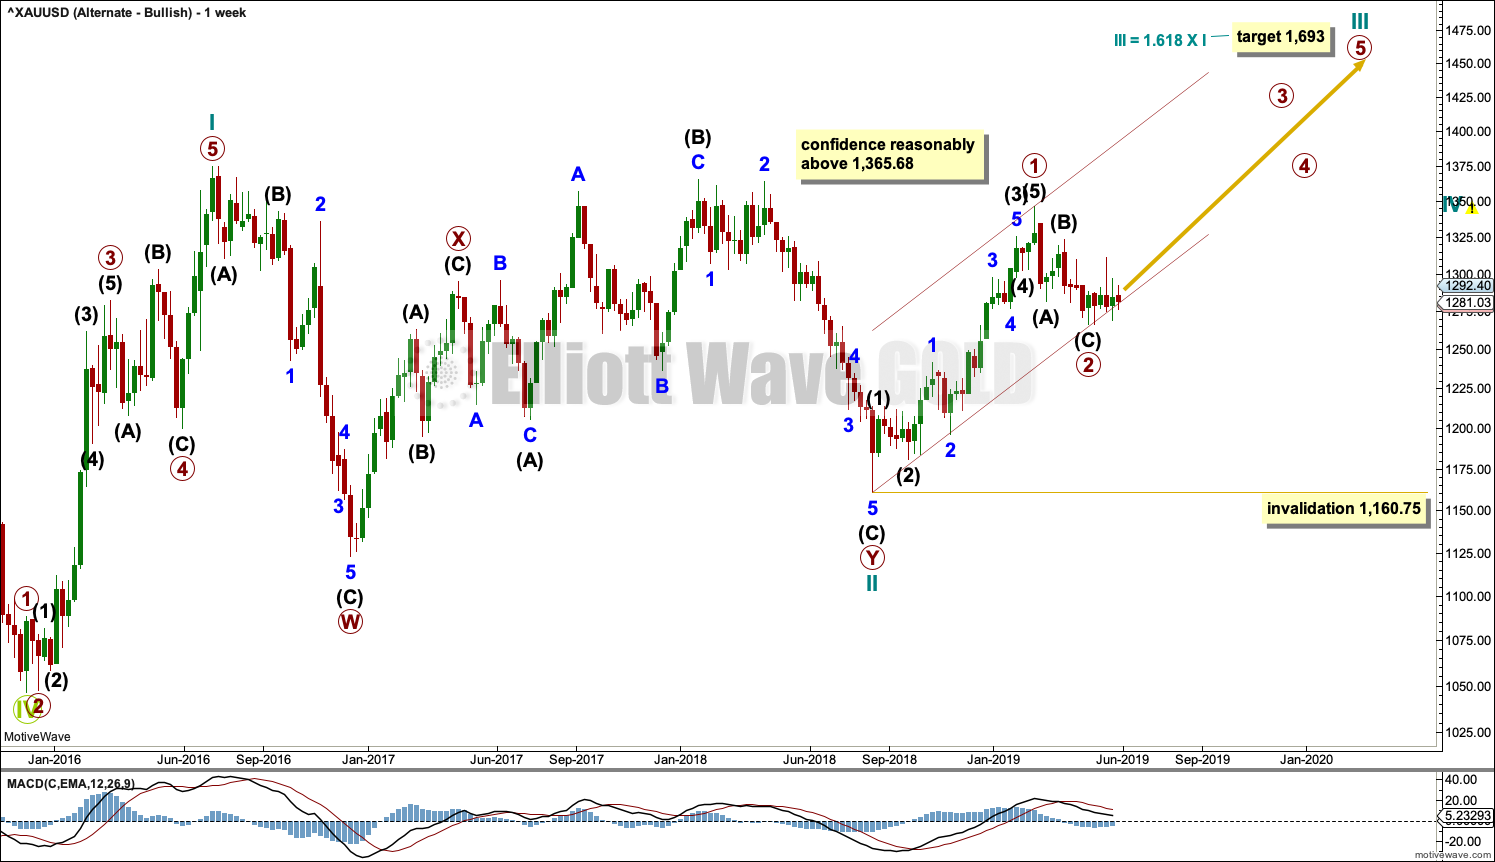
WEEKLY CHART
Click chart to enlarge.
This wave count sees the three waves back now complete at the last major low for Gold in November 2019.
If Gold is in a new bull market, then it should begin with a five wave structure upwards on the weekly chart. However, the biggest problem with this wave count is the structure labelled cycle wave I because this wave count must see it as a five wave structure, but it looks more like a three wave structure.
Commodities often exhibit swift strong fifth waves that force the fourth wave corrections coming just prior and just after to be more brief and shallow than their counterpart second waves. It is unusual for a commodity to exhibit a quick second wave and a more time consuming fourth wave, and this is how cycle wave I is labelled. The probability of this wave count is low due to this problem.
Cycle wave II subdivides well as a double combination: zigzag – X – expanded flat.
Cycle wave III may have begun. Within cycle wave III, primary waves 1 and 2 may now be complete. If it continues lower as a double zigzag, then primary wave 2 may not move beyond the start of primary wave 1 below 1,160.75.
Cycle wave III so far for this wave count would have been underway now for 40 weeks. It should be beginning to exhibit some support from volume, increase in upwards momentum and increasing ATR. However, ATR continues to decline and is very low, and momentum is weak in comparison to cycle wave I. This wave count lacks support from classic technical analysis.
TECHNICAL ANALYSIS
WEEKLY CHART

Click chart to enlarge. Chart courtesy of StockCharts.com.
Last week price moved lower with a lower low and a lower high, but the balance of volume was upwards and the candlestick has closed green. Upwards movement within the week overall does not have support from volume, but for a clearer look at the short-term volume profile daily volume bars should be considered in this instance.
While the high of the week beginning 13th of May remains intact, a downwards trend may be in place. There has been now a series of two lower swing lows and three lower swing highs from the high at 1,349.80 on the week beginning 19th February.
A continued decline in ATR supports the weekly double zigzag Elliott wave count.
DAILY CHART
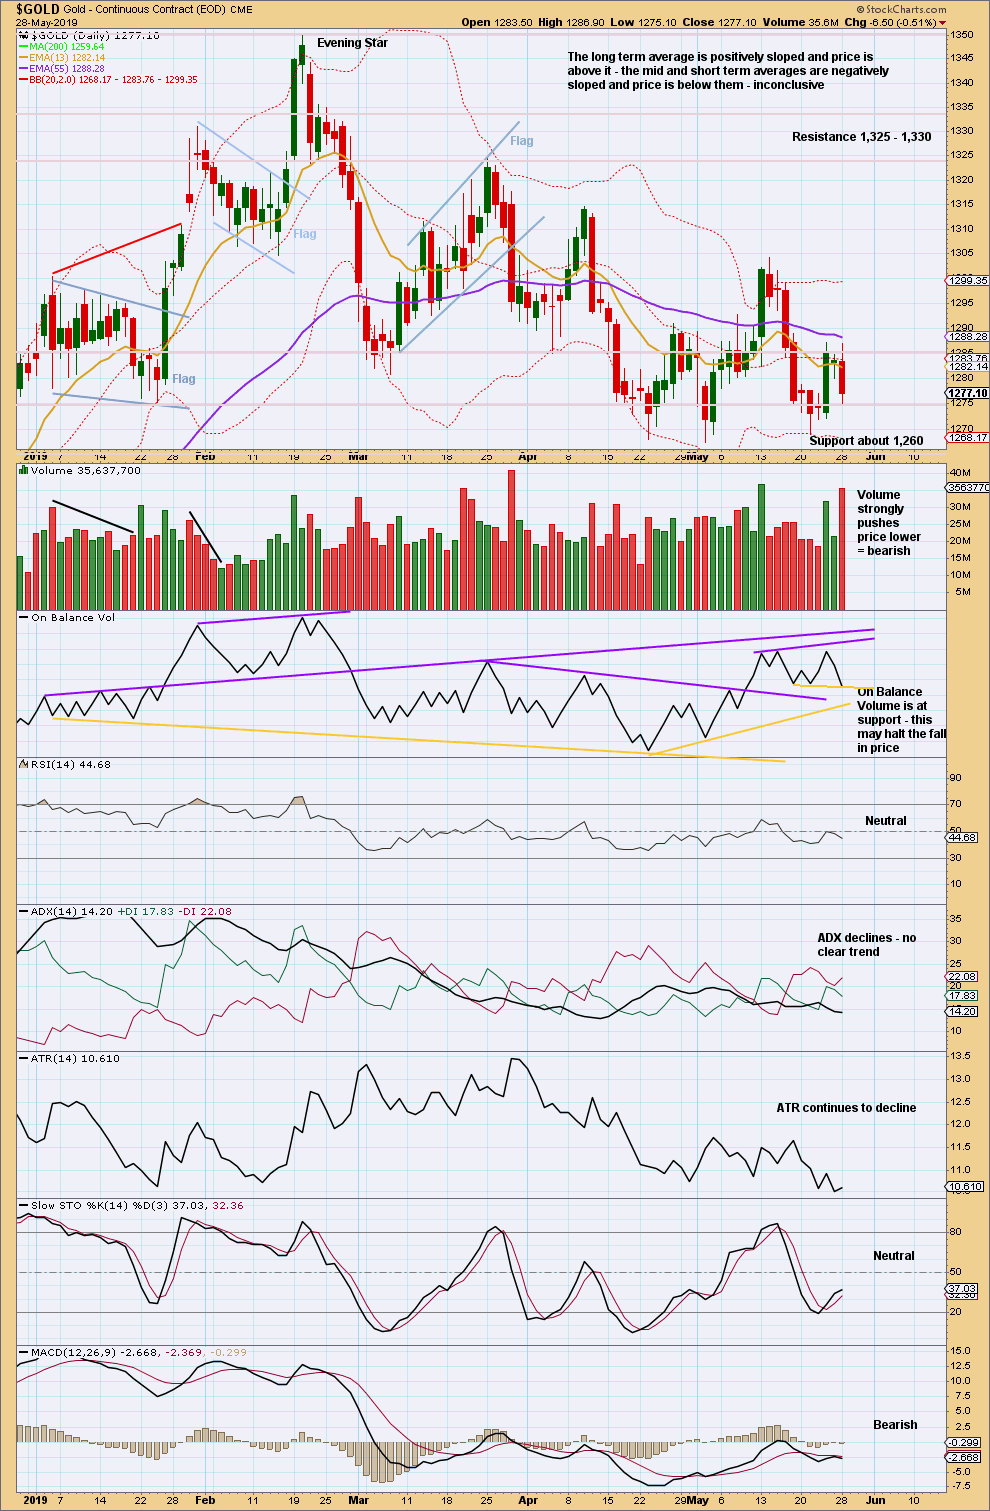
Click chart to enlarge. Chart courtesy of StockCharts.com.
From August 2018 Gold moved higher with a series of higher highs and higher lows. This series remained intact until the 1st of March 2019 when a lower low was made. At that stage, it was possible that Gold had seen a trend change.
There is now a new series of three lower swing highs and three lower swing lows. The last high of the 14th of May remains intact. A trend change to downwards remains possible.
For the short term, price is range bound with resistance about 1,305 and support about 1,265. A breakout is required for confidence in the next direction.
Strong volume pushing price lower today suggests more downwards movement tomorrow.
GDX WEEKLY CHART
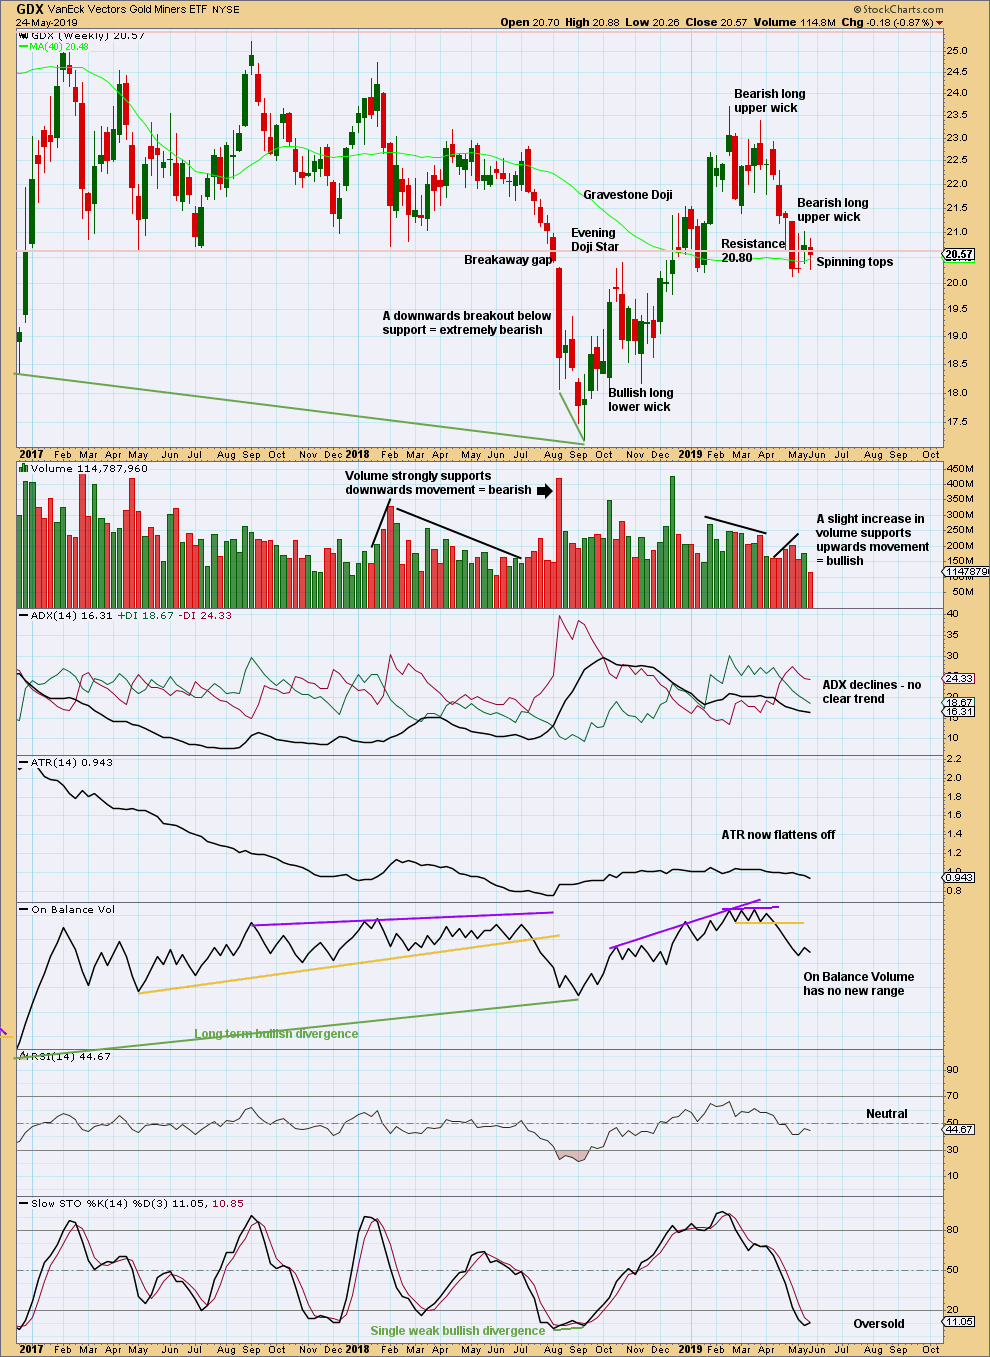
Click chart to enlarge. Chart courtesy of StockCharts.com.
There is now a series of two lower highs and lower lows at the weekly chart level. GDX may have seen a trend change to downwards, but ADX does not yet agree. The bearish signal from On Balance Volume supports this view.
Price has again closed below 20.80. The spinning top candlestick pattern for the last two completed weeks is neutral.
GDX DAILY CHART
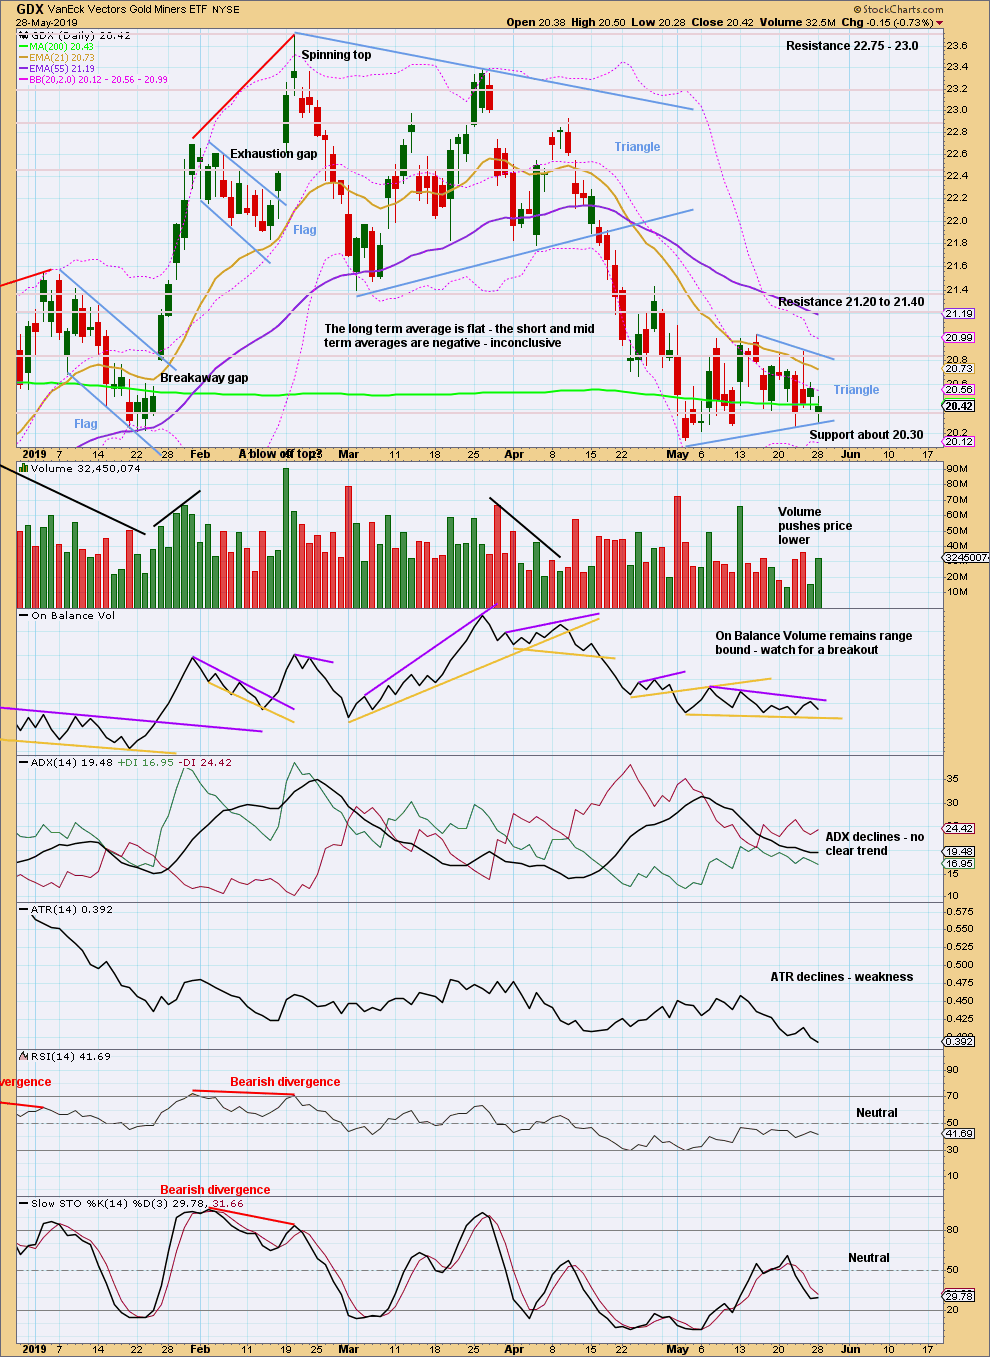
Click chart to enlarge. Chart courtesy of StockCharts.com.
A small triangle may be unfolding. Classic triangles may be either reversal or continuation patterns (whereas Elliott wave triangles are always continuation patterns). A breakout from the triangle trend lines is required to indicate the next trend direction. An upwards breakout requires support from volume for confidence and a downwards breakout does not.
On Balance Volume may breakout prior to price giving an early signal. Watch it carefully.
Published @ 09:14 p.m. EST.
—
Careful risk management protects your trading account(s).
Follow my two Golden Rules:
1. Always trade with stops.
2. Risk only 1-5% of equity on any one trade.
—
New updates to this analysis are in bold.
Lara, with all this sideways & choppy movement, have you considered a triangle for Intermediate B in the Triangle ALTERNATE count? This would have a long A wave and almost be complete before an upwards breakout. Just a thought….
A good thought Dreamer. But it doesn’t really fit.
There are now 3 spikes on the hourly chart all exactly ending at 1,292.40 and that just doesn’t fit in a triangle very well.