
A small range day with a long lower wick moves price a little lower. Downwards movement overall was expected from the main Elliott wave count.
Summary: A high may now be in place for Gold.
A new target is at 1,014. Thereafter, if price keeps falling, the next target is at 808. Along the way down, a new low below 1,160.75 would add strong confidence in the main Elliott wave count.
If price continues higher to make a new high reasonably above 1,365.68, then only the very bullish Elliott wave count would remain valid.
Grand SuperCycle analysis is here.
Last monthly charts are here. Video is here.
MAIN ELLIOTT WAVE COUNT
WEEKLY CHART – TRIANGLE
Click chart to enlarge.
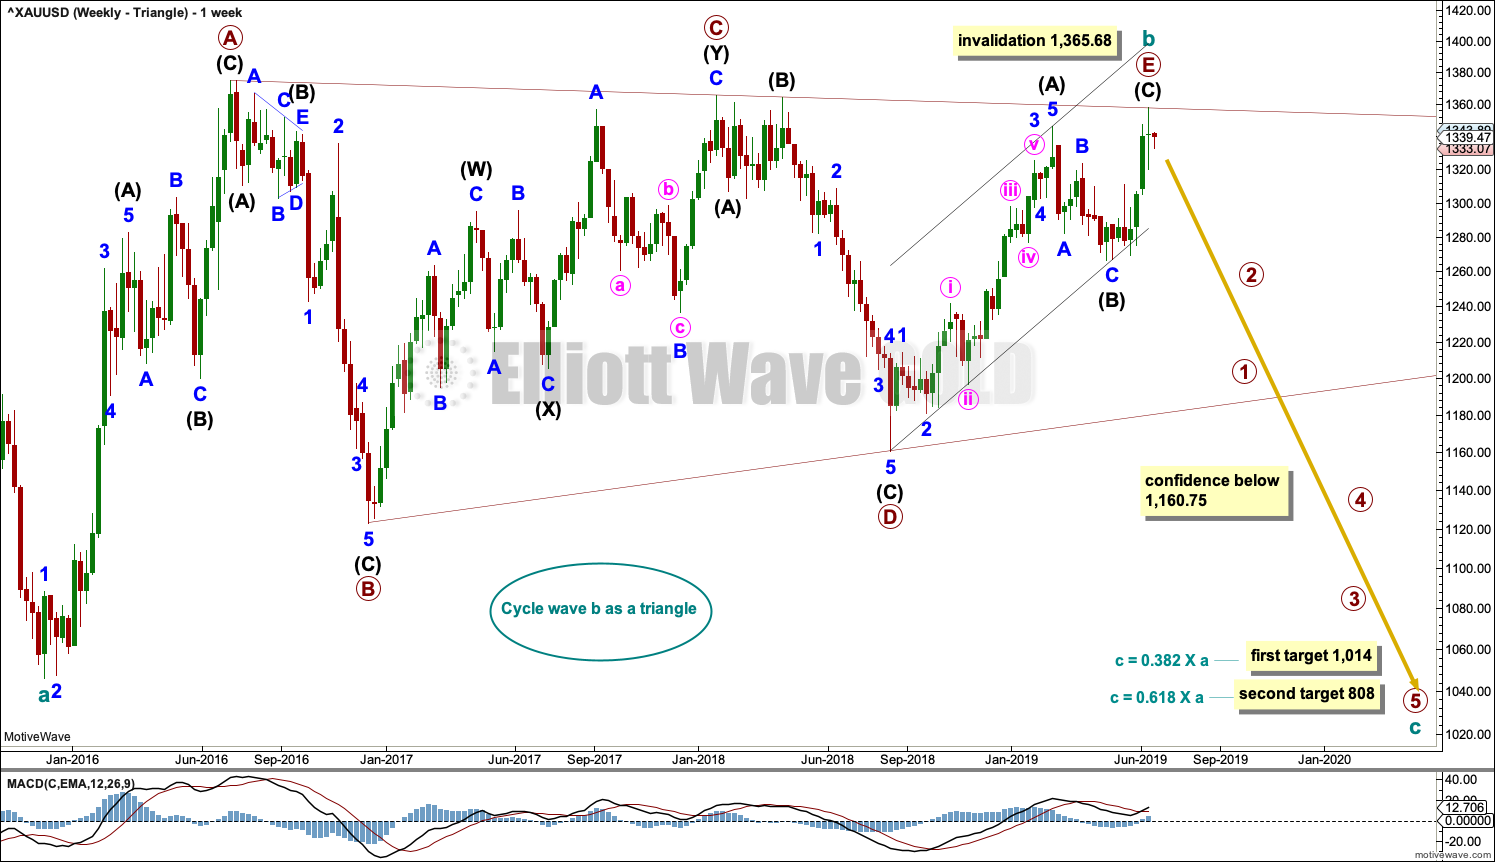
The basic Elliott wave structure is five waves up followed by three waves back (in a bull market). At this time, the preferred Elliott wave count sees Gold as still within three waves back, which began at the all time high in September 2011.
Five waves up are labelled 1,2,3,4,5. Three waves back are labelled A,B,C.
This wave count sees Gold as now about two thirds through the three waves back. The three wave structure is labelled cycle waves a, b and c.
The triangle for cycle wave b may be complete. Primary wave E may have ended almost right at the A-C trend line. If it continues higher, then primary wave E may not move beyond the end of primary wave C above 1,365.68.
Draw a channel about the zigzag of primary wave E using Elliott’s technique. Draw the first trend line from the start of intermediate wave (A) to the end of intermediate wave (B), then place a parallel copy on the end of intermediate wave (A). A breach of the channel by downwards movement would be a strong indication that the triangle for cycle wave b is over and cycle wave c downwards may then be underway.
DAILY CHART – TRIANGLE
Click chart to enlarge.
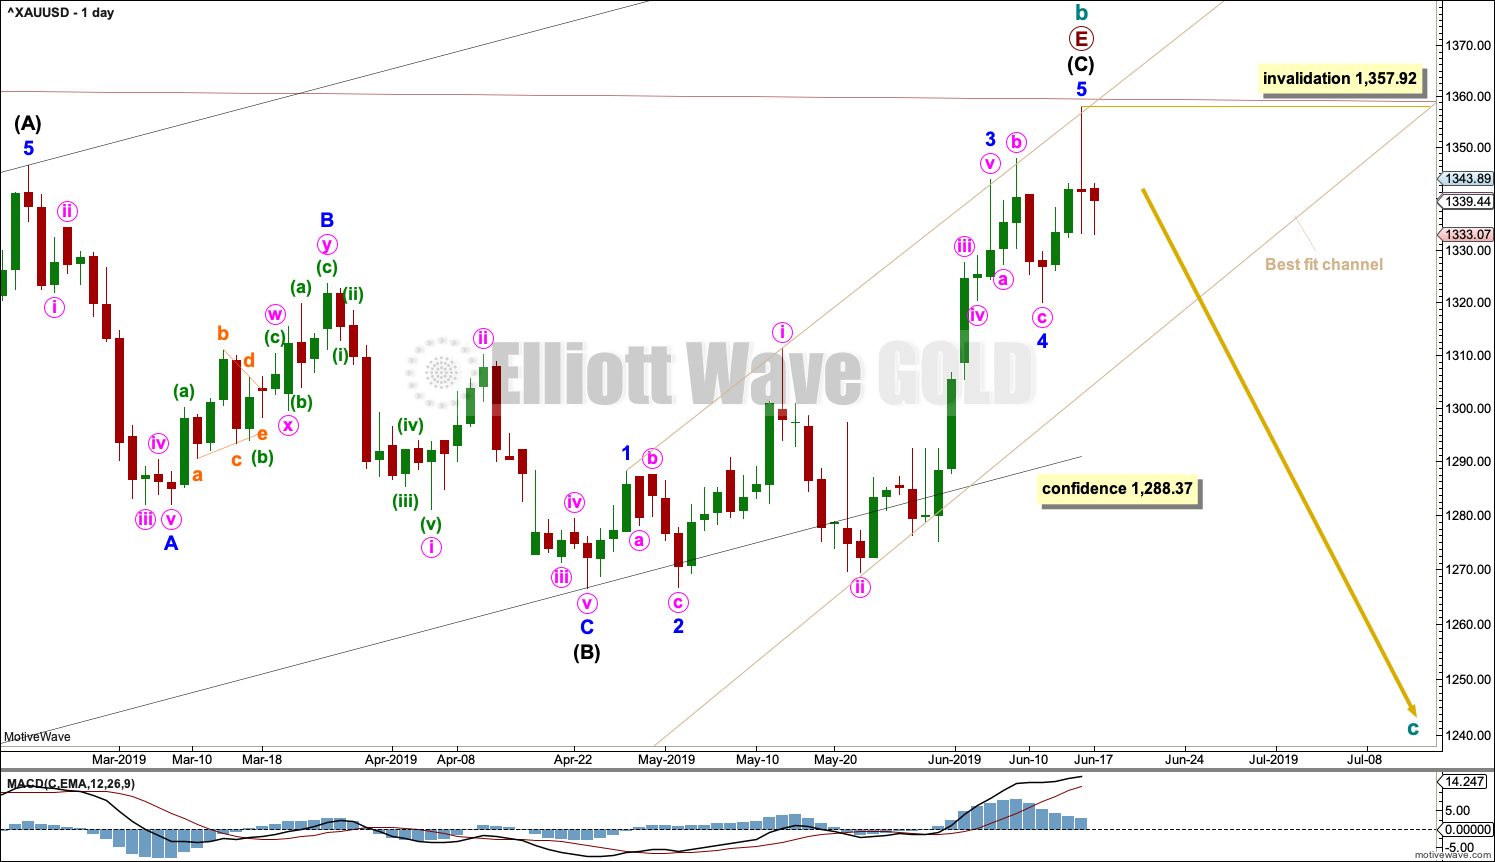
Primary wave E must subdivide as a zigzag. Within the zigzag, intermediate wave (C) must subdivide as a five wave structure. Intermediate wave (C) may be over at last week’s high.
A best fit channel is drawn about the impulse of intermediate wave (C). A breach of this channel by downwards movement would be a strong indication that intermediate wave (C) should be over.
A new low now below 1,288.37 would add confidence in this wave count. At that stage, the alternate daily count below would be invalidated.
No second wave correction within a new trend at cycle degree may move beyond its start above 1,357.92.
Within intermediate wave (C), there is no Fibonacci ratio between minor waves 1 and 3, and minor wave 5 is just 2.66 longer than 1.618 the length of minor wave 1.
When triangles complete for Gold, the resulting movement out of them usually begins with some strength.
HOURLY CHART – TRIANGLE
Click chart to enlarge.
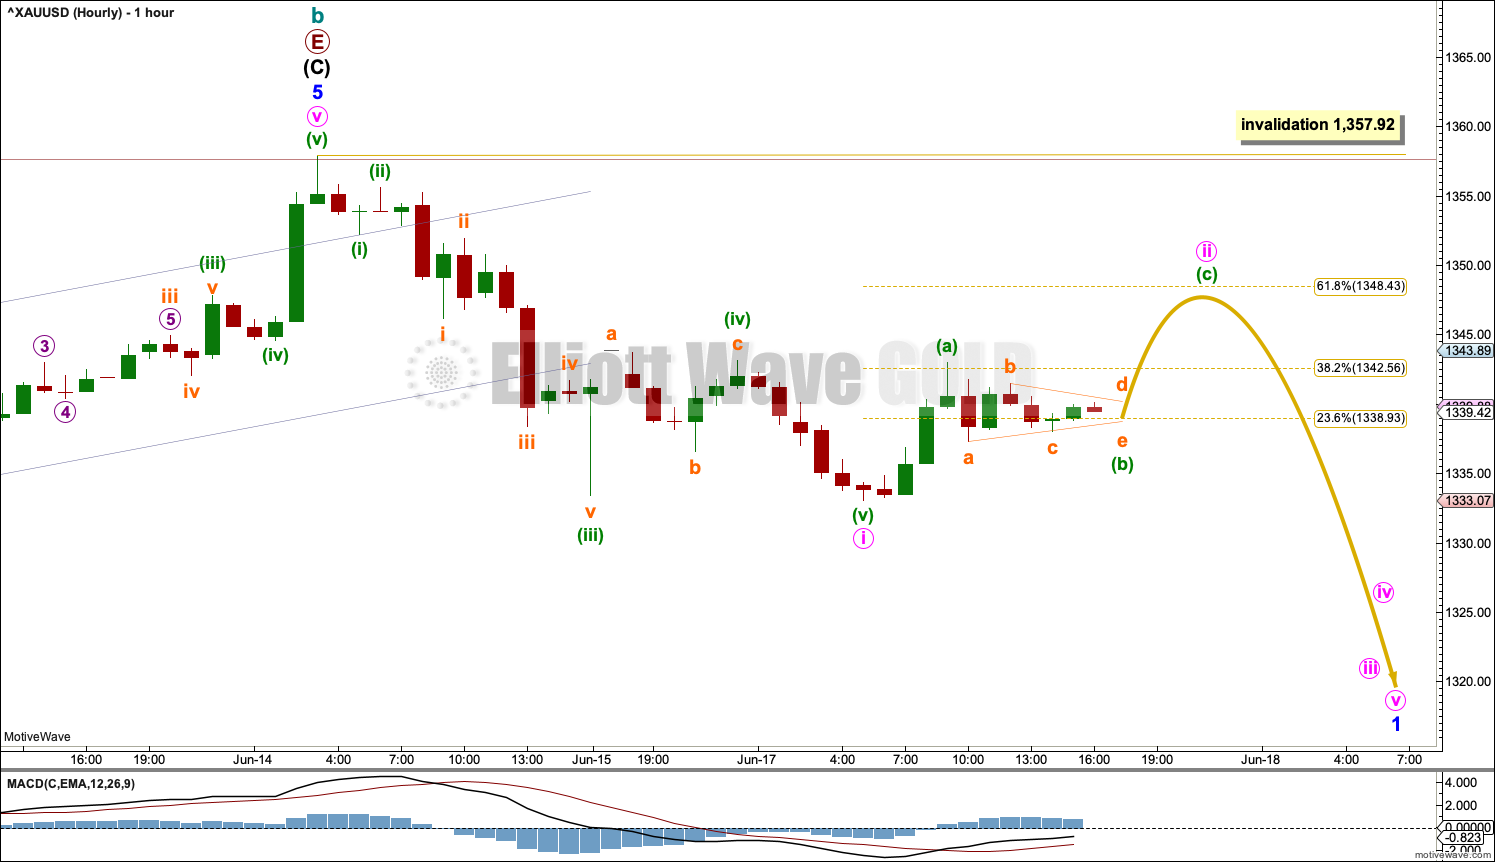
A five down from the high may again be complete. This is labelled minute wave i. Five down should be followed by three up. This will be labelled minute wave ii.
After a trend change, the first second wave correction within the new trend for Gold is usually very deep. Minute wave ii may end about the 0.618 Fibonacci ratio of minute wave i at 1,348.43, or it may be deeper than this. Minute wave ii may not move beyond the start of minute wave i above 1,357.92.
Minute wave ii may show up on the daily chart and may last over 24 hours. Thereafter, minute wave iii downwards should exhibit some increase in momentum.
DAILY CHART – TRIANGLE – ALTERNATE
Click chart to enlarge.
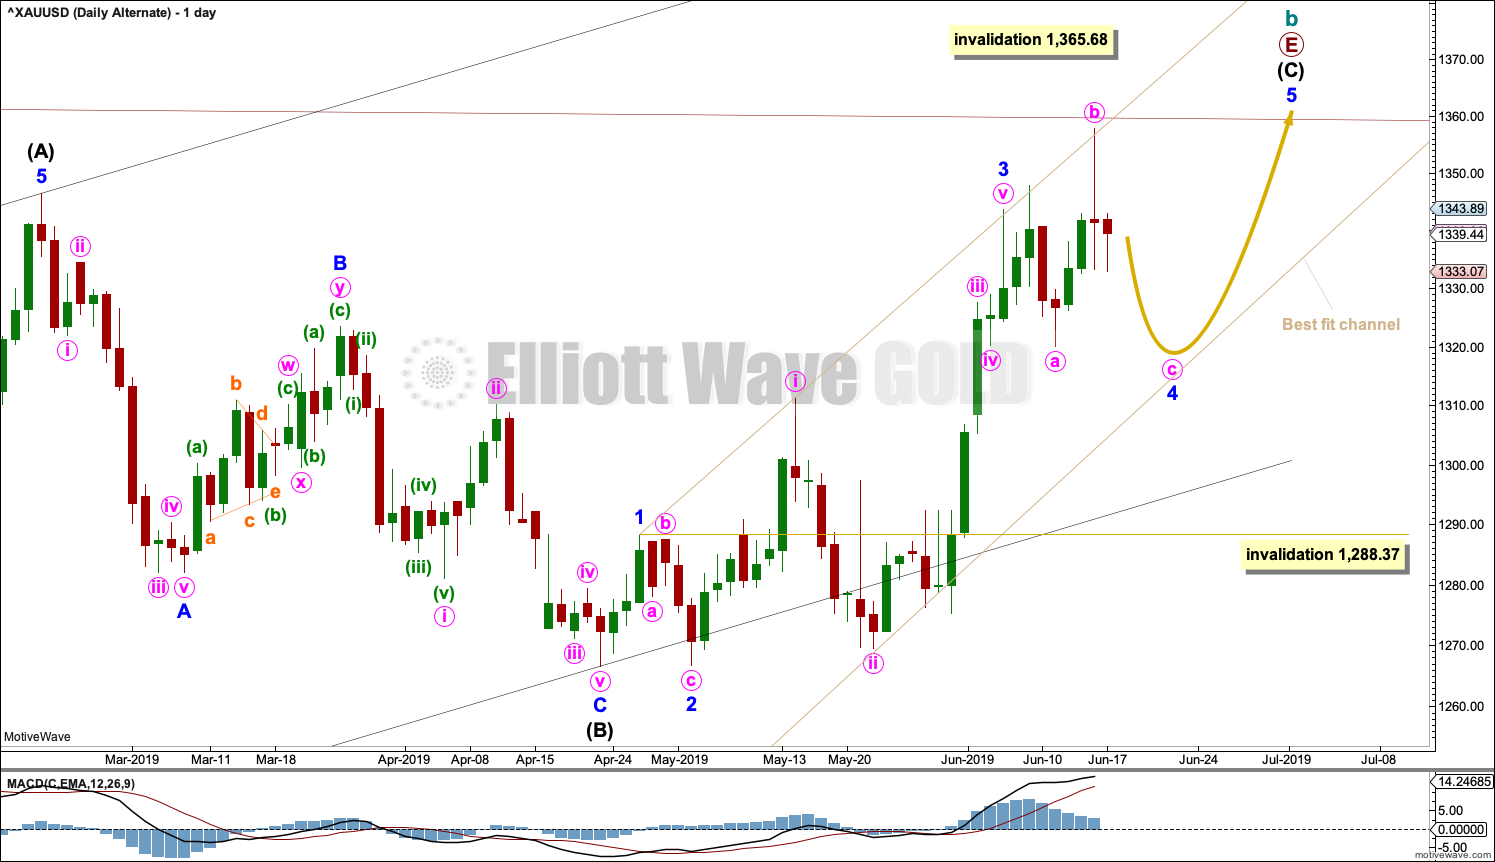
It is also possible that minor wave 4 may be incomplete and may be continuing as an expanded flat or double flat.
This alternate wave count expects to see sideways movement for another week to two, and thereafter a new high above 1,357.92 but not above 1,365.68. This alternate wave count does not have good support from technical analysis.
Minor wave 4 may not move into minor wave 1 price territory below 1,288.37.
WEEKLY CHART – DOUBLE ZIGZAG
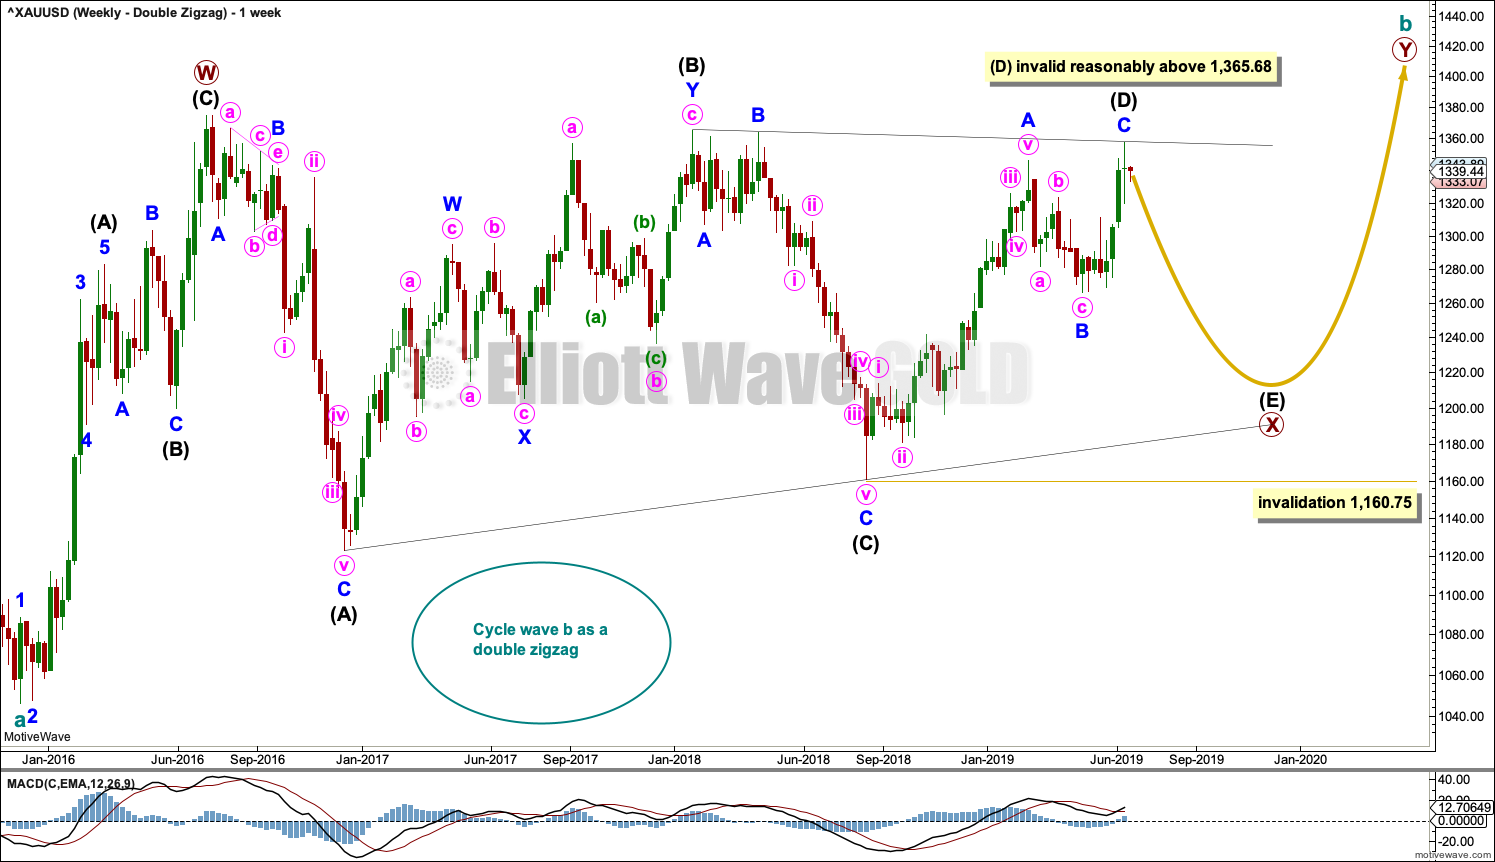
Click chart to enlarge.
This wave count is identical to the first weekly chart up to the low labelled cycle wave a. Thereafter, a different Elliott wave corrective structure is considered for cycle wave b.
It is possible that cycle wave b may be an incomplete double zigzag or a double combination.
The first zigzag in the double is labelled primary wave W. This has a good fit.
The double may be joined by a corrective structure in the opposite direction, a triangle labelled primary wave X. The triangle may be incomplete.
Within multiples, X waves are almost always zigzags and rarely triangles. Within the possible triangle of primary wave X, it is intermediate wave (B) that is a multiple; this is acceptable, but note this is not the most common triangle sub-wave to subdivide as a multiple. These two points reduce the probability of this wave count in terms of Elliott wave.
It is possible that intermediate wave (D) may be complete.
If it continues higher, then intermediate wave (D) of a contracting triangle may not move beyond the end of intermediate wave (B) above 1,365.68.
Intermediate wave (D) of a barrier triangle may end about the same level as intermediate wave (B); as long as the (B)-(D) trend line remains essentially flat the triangle will remain valid. This is the only Elliott wave rule that is not black and white. In practice, intermediate wave (D) may end slightly above intermediate wave (B) at 1,365.68 and this wave count would remain valid. If intermediate wave (D) is now complete, then the (B)-(D) trend line now sits perfectly across the high of minor wave B within intermediate wave (C).
Primary wave Y would most likely be a zigzag because primary wave X would be shallow; double zigzags normally have relatively shallow X waves.
Primary wave Y may also be a flat correction if cycle wave b is a double combination, but combinations normally have deep X waves. This would be less likely.
This wave count has good proportions and no problems in terms of subdivisions.
ALTERNATE ELLIOTT WAVE COUNT
WEEKLY CHART
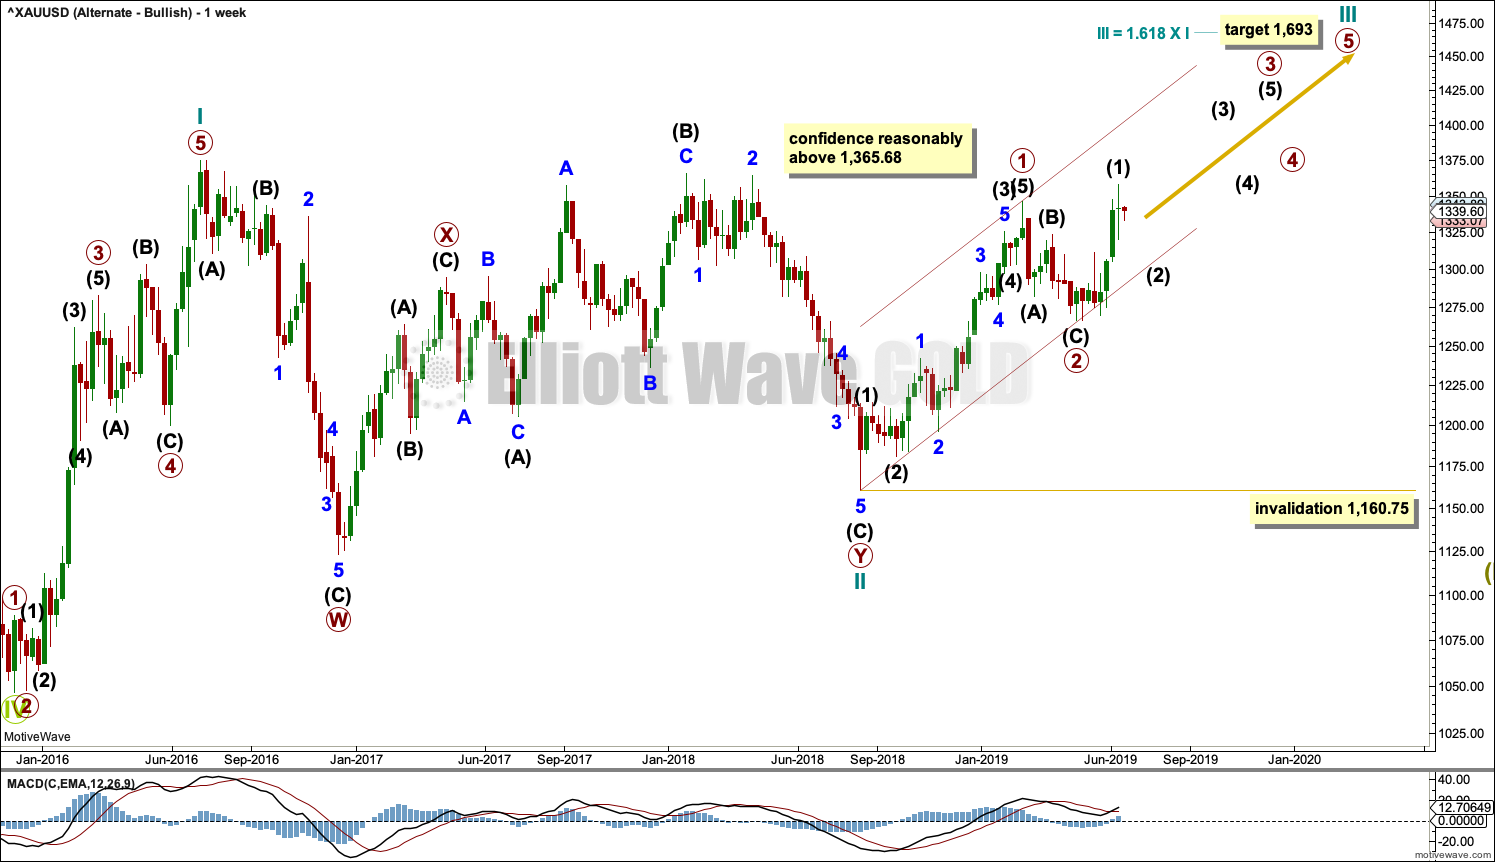
Click chart to enlarge.
This wave count sees the three waves back now complete at the last major low for Gold in November 2019.
If Gold is in a new bull market, then it should begin with a five wave structure upwards on the weekly chart. However, the biggest problem with this wave count is the structure labelled cycle wave I because this wave count must see it as a five wave structure, but it looks more like a three wave structure.
Commodities often exhibit swift strong fifth waves that force the fourth wave corrections coming just prior and just after to be more brief and shallow than their counterpart second waves. It is unusual for a commodity to exhibit a quick second wave and a more time consuming fourth wave, and this is how cycle wave I is labelled. The probability of this wave count is low due to this problem.
Cycle wave II subdivides well as a double combination: zigzag – X – expanded flat.
Cycle wave III may have begun. Within cycle wave III, primary waves 1 and 2 may now be complete. If it continues lower as a double zigzag, then primary wave 2 may not move beyond the start of primary wave 1 below 1,160.75.
Cycle wave III so far for this wave count would have been underway now for 44 weeks. It may be beginning to exhibit some support from volume and increasing ATR. If this increase continues, then this wave count would have some support from technical analysis.
There is very strong resistance here in a zone from 1,345 to 1,375. This wave count now expects an upwards breakout above 1,375, which should have support from volume. While an upwards breakout has not happened, this wave count will continue to have a low probability.
TECHNICAL ANALYSIS
WEEKLY CHART
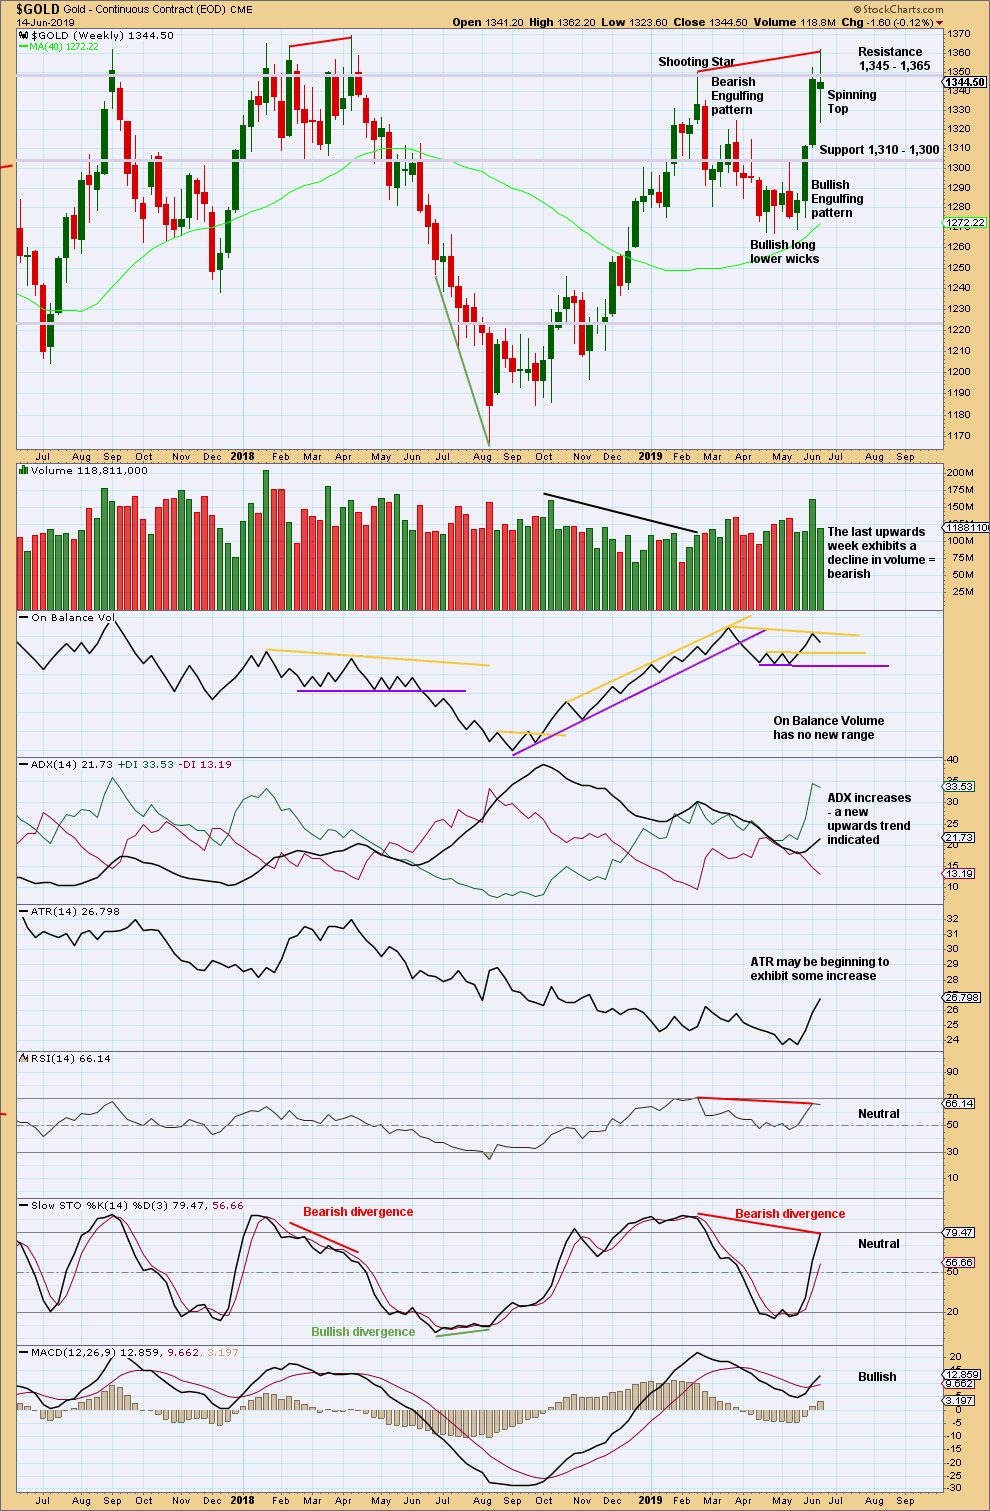
Click chart to enlarge. Chart courtesy of StockCharts.com.
At the last few major highs for Gold (on weeks of 5th July 2016, 5th September 2017, 9th April 2018 and 19th February 2019) the following points are noted:
– Volume was not the strongest for the last upwards week. Some decline in volume accompanied the final high.
– Bearish divergence was seen between price and Stochastics in only two of four of the identified major highs.
– Bearish divergence was seen between price and RSI in only one of four of the identified major highs.
Last week there is bearish divergence between price and Stochastics, and price and RSI after RSI reached overbought. There is also now a final upwards week that exhibits a strong decline in volume. It looks like there is more likely to be a high in place.
The Spinning Top candlestick pattern on its own is not a reversal signal. It is neutral and represents indecision.
DAILY CHART
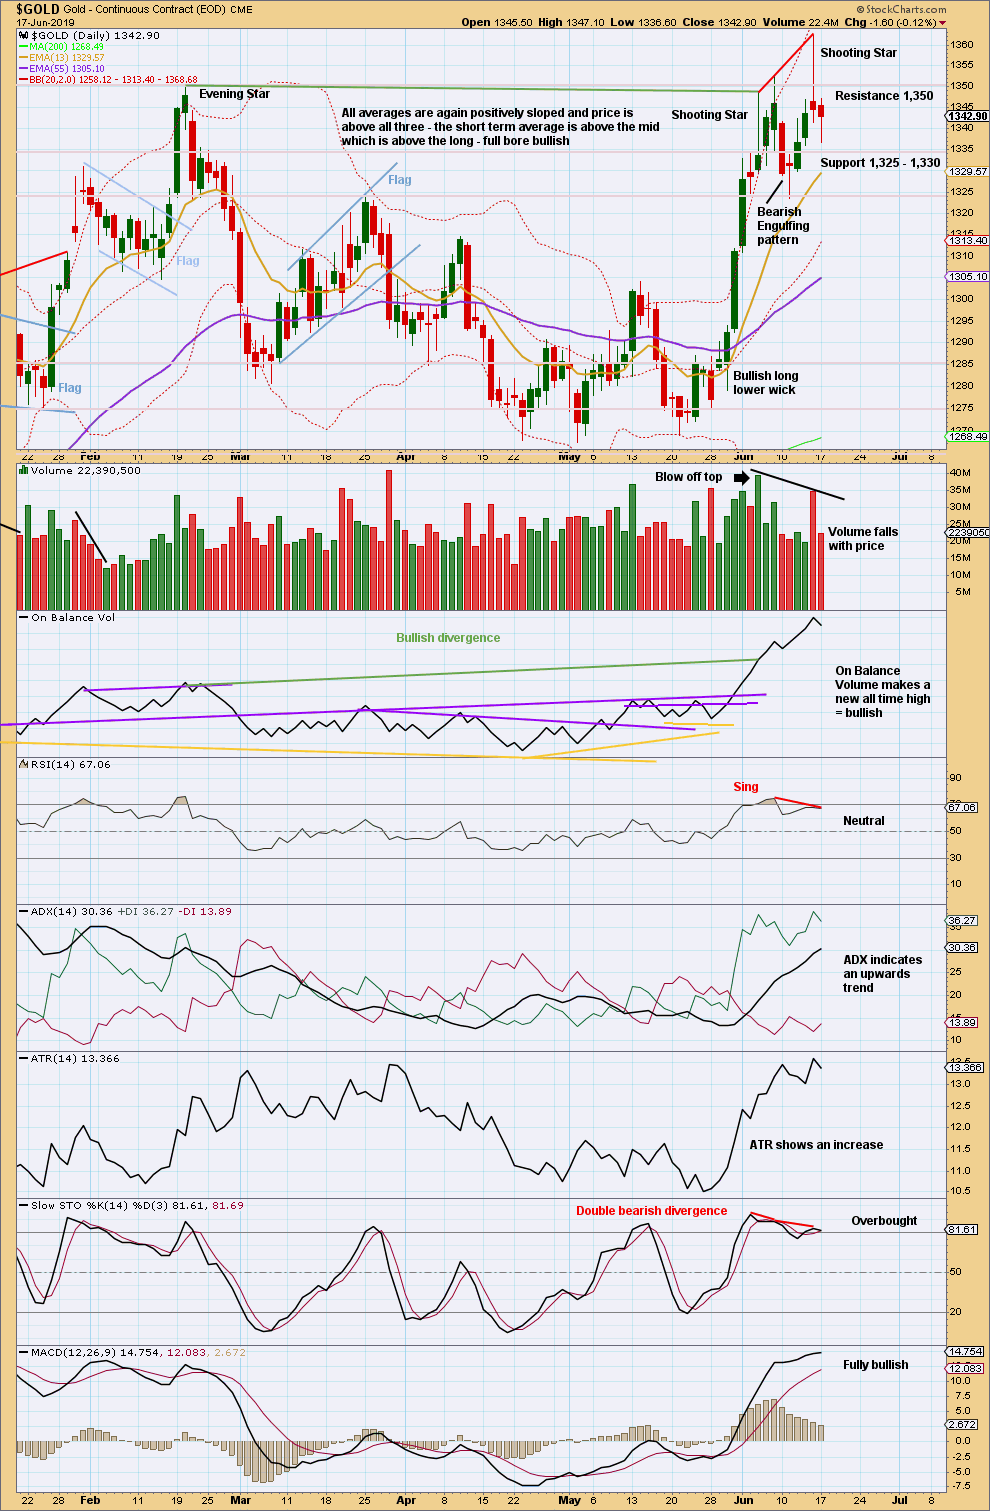
Click chart to enlarge. Chart courtesy of StockCharts.com.
There is now another bearish candlestick reversal pattern. In conjunction with bearish divergence between price and both of Stochastics and RSI, after both reached overbought, it looks more likely now that a high may be in place.
For the very short term, the long lower wick on Monday’s candlestick suggests upwards movement ahead.
GDX WEEKLY CHART
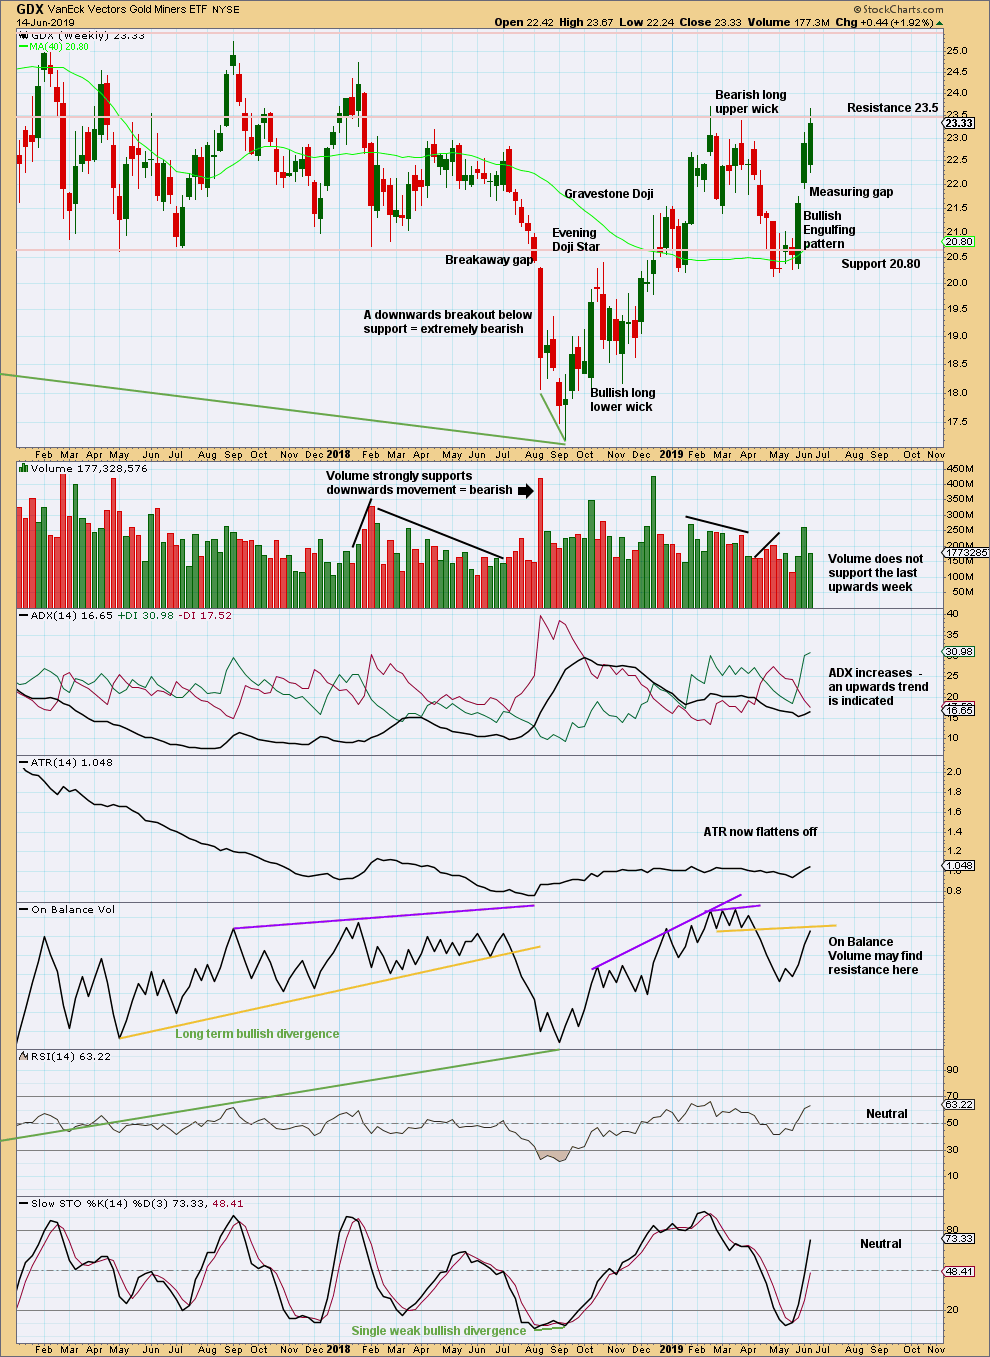
Click chart to enlarge. Chart courtesy of StockCharts.com.
Some decline in volume last week is slightly bearish, but not enough for expect a high here for GDX. Assume an upwards trend remains until proven otherwise.
GDX DAILY CHART
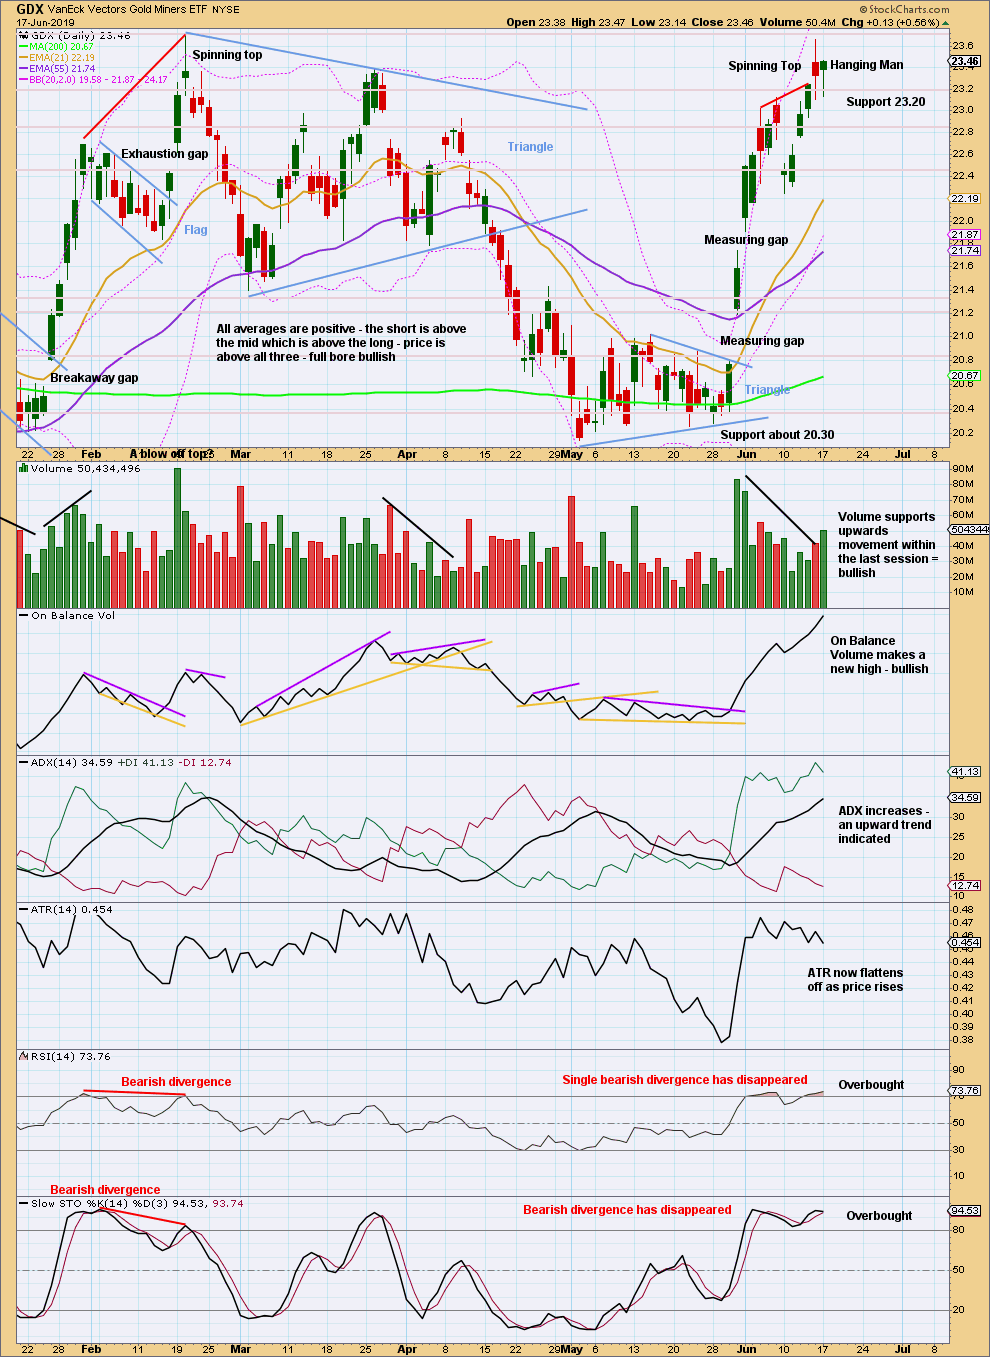
Click chart to enlarge. Chart courtesy of StockCharts.com.
The last measuring gap may now provide support. It may remain open at 21.74.
An upwards trend is in place. Assume it will continue until proven otherwise. Today there is still no evidence of a trend change for GDX.
The long lower wick on a Hanging Man candlestick has a bullish implication even though the pattern is a bearish reversal pattern. Hanging Man candlesticks require bearish confirmation in the following candlestick ( essentially two candlestick reversal patterns).
For the short term, the long lower wicks on the last two daily candlesticks are bullish. This looks like a small consolidation within an ongoing upwards trend.
Published @ 5:43 p.m. EST.
—
Careful risk management protects your trading account(s).
Follow my two Golden Rules:
1. Always trade with stops.
2. Risk only 1-5% of equity on any one trade.
—
New updates to this analysis are in bold.
Hourly chart updated:
Minute ii may now be over, typically it is very deep. That should have been expected.
The next wave down should be a third wave, it should exhibit some strength if this wave count is correct.
I think the main count is valid, and we are heading south, but there is a real struggle going on here between bulls and bears.
Agreed. Price is currently within a congestion zone. It may take some work before it breaks out.