
Today Gold may be in the process of a classic upwards breakout from a multi-year consolidation. If this session closes above 1,374.91 (the July 2016 high) on an upwards day with support from volume, then have confidence in the breakout.
Today I have three Elliott wave counts, all of which are bullish.
Summary: This bullish trend is not yet extreme, but conditions are currently overbought. Following an upwards breakout, it is typical to see price curve back to test support at prior resistance. Patience in waiting for this back test to find an entry point to join a confirmed trend is usually very profitable. Alternatively, if you don’t mind your account being underwater in coming days, then entering a trend upon a clear breakout should be profitable for the mid to long term.
The short-term target is at 1,398, from where a back test may begin.
A longer-term target may be at 1,489 or 1,565.
The bullish wave count has a long-term target at 1,693 for cycle wave III to end.
Grand SuperCycle analysis is here.
Last monthly charts are here. Video is here.
I will make no comment at this point on whether the bullish or bearish scenario is more likely. In coming months price may invalidate one or the other and provide clarity. For now they both expect more upwards movement.
BULLISH ELLIOTT WAVE COUNT
WEEKLY CHART
Click chart to enlarge.
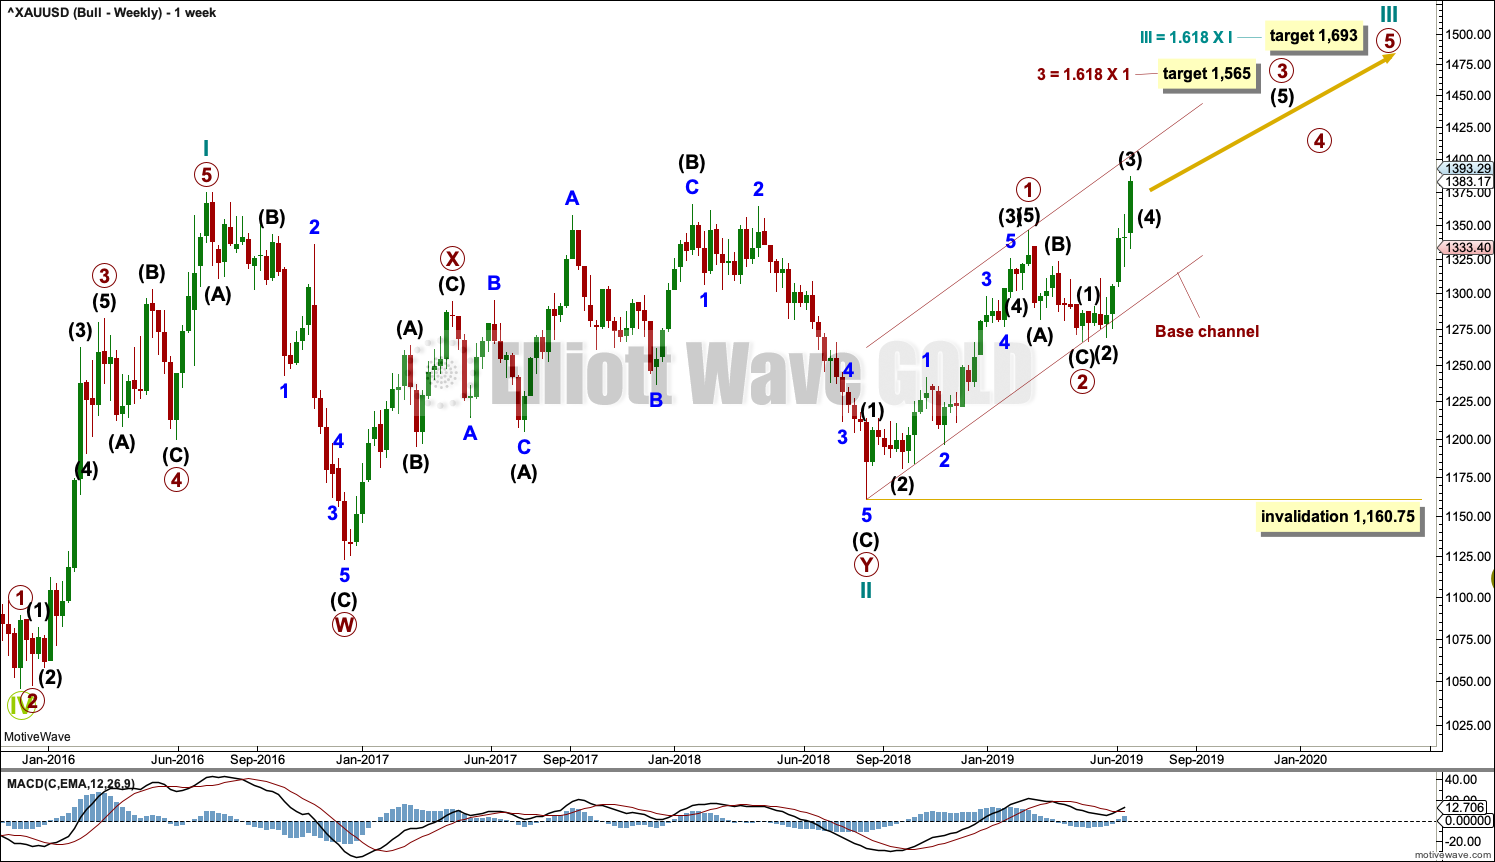
This wave count sees the the bear market complete at the last major low for Gold in November 2015.
If Gold is in a new bull market, then it should begin with a five wave structure upwards on the weekly chart. However, the biggest problem with this wave count is the structure labelled cycle wave I because this wave count must see it as a five wave structure, but it looks more like a three wave structure.
Commodities often exhibit swift strong fifth waves that force the fourth wave corrections coming just prior and just after to be more brief and shallow than their counterpart second waves. It is unusual for a commodity to exhibit a quick second wave and a more time consuming fourth wave, and this is how cycle wave I is labelled. This wave count still suffers from this very substantial problem, and for this reason two further wave counts are considered below.
Cycle wave II subdivides well as a double combination: zigzag – X – expanded flat.
Cycle wave III may have begun. Within cycle wave III, primary waves 1 and 2 may now be complete. If it continues lower as a double zigzag, then primary wave 2 may not move beyond the start of primary wave 1 below 1,160.75.
Cycle wave III so far for this wave count would have been underway now for 44 weeks. It may be beginning to exhibit some support from volume and increasing ATR. If this increase continues, then this wave count would have some support from technical analysis.
There was very strong resistance in a zone from 1,345 to 1,375 which today is being overcome. If the current session closes above 1,375 on an upwards day that has support from volume, that would effect a classic upwards breakout from this multi-year consolidation. Prior resistance at 1,345 to 1,375 may then become support.
Draw a base channel about primary waves 1 and 2: draw the first trend line from the start of primary wave 1 to the end of primary wave 2, then place a parallel copy on the end of primary wave 1. Primary wave 3 should have the power to break through resistance at the upper edge of the base channel. Copy this channel over to the daily chart.
DAILY CHART
Click chart to enlarge.
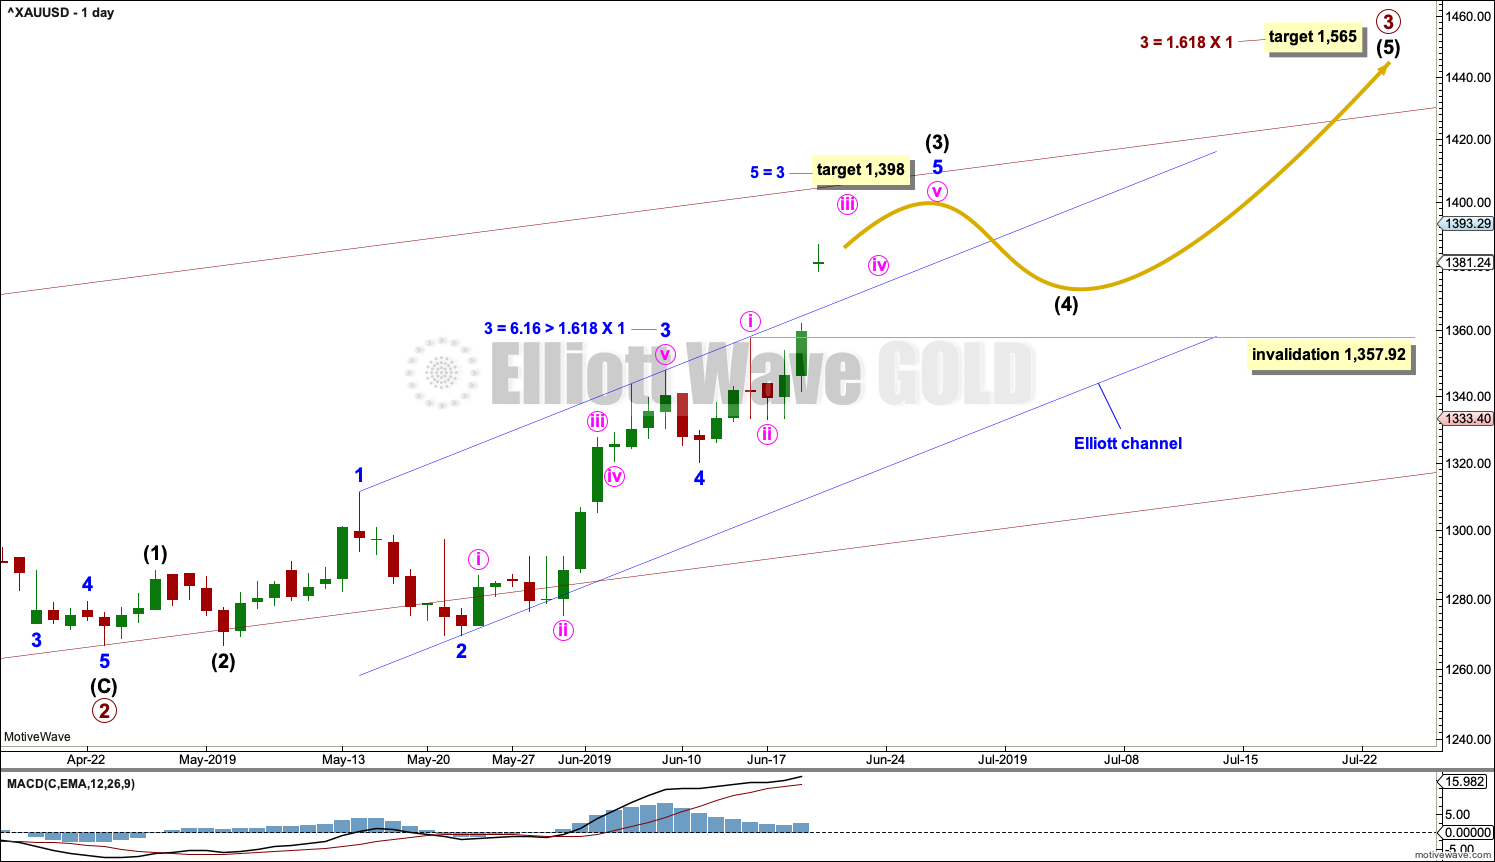
This daily chart focusses on the impulse of primary wave 3.
Primary wave 3 may only subdivide as an impulse. Within primary wave 3, intermediate waves (1) and (2) may be complete. A target is calculated for intermediate wave (3) to end.
Intermediate wave (3) may only subdivide as an impulse. Within intermediate wave (3), minor waves 1 through to 4 may be complete and minor wave 3 exhibits a Fibonacci ratio to minor wave 1. A channel is drawn about intermediate wave (3) using Elliott’s first technique. Minor wave 5 has broken above the upper edge of the channel. This trend line may provide support while intermediate wave (3) comes to an end.
Minor wave 5 looks like it is subdividing as an impulse. This is the most common structure for a fifth wave, particularly a fifth wave to end a third wave one degree higher. Within the impulse of minor wave 5, minute waves i and ii may be complete. Minute wave iv may not move into minute wave i price territory below 1,357.92.
Gold typically exhibits swift strong fifth waves. This tendency is especially prevalent for fifth waves to end third wave impulses. Look out for minor wave 5 to end intermediate wave (3) to potentially be explosive. Likewise, intermediate wave (5) to end primary wave 3 may also be explosive.
BEARISH ELLIOTT WAVE COUNT
FIRST WEEKLY CHART
Click chart to enlarge.
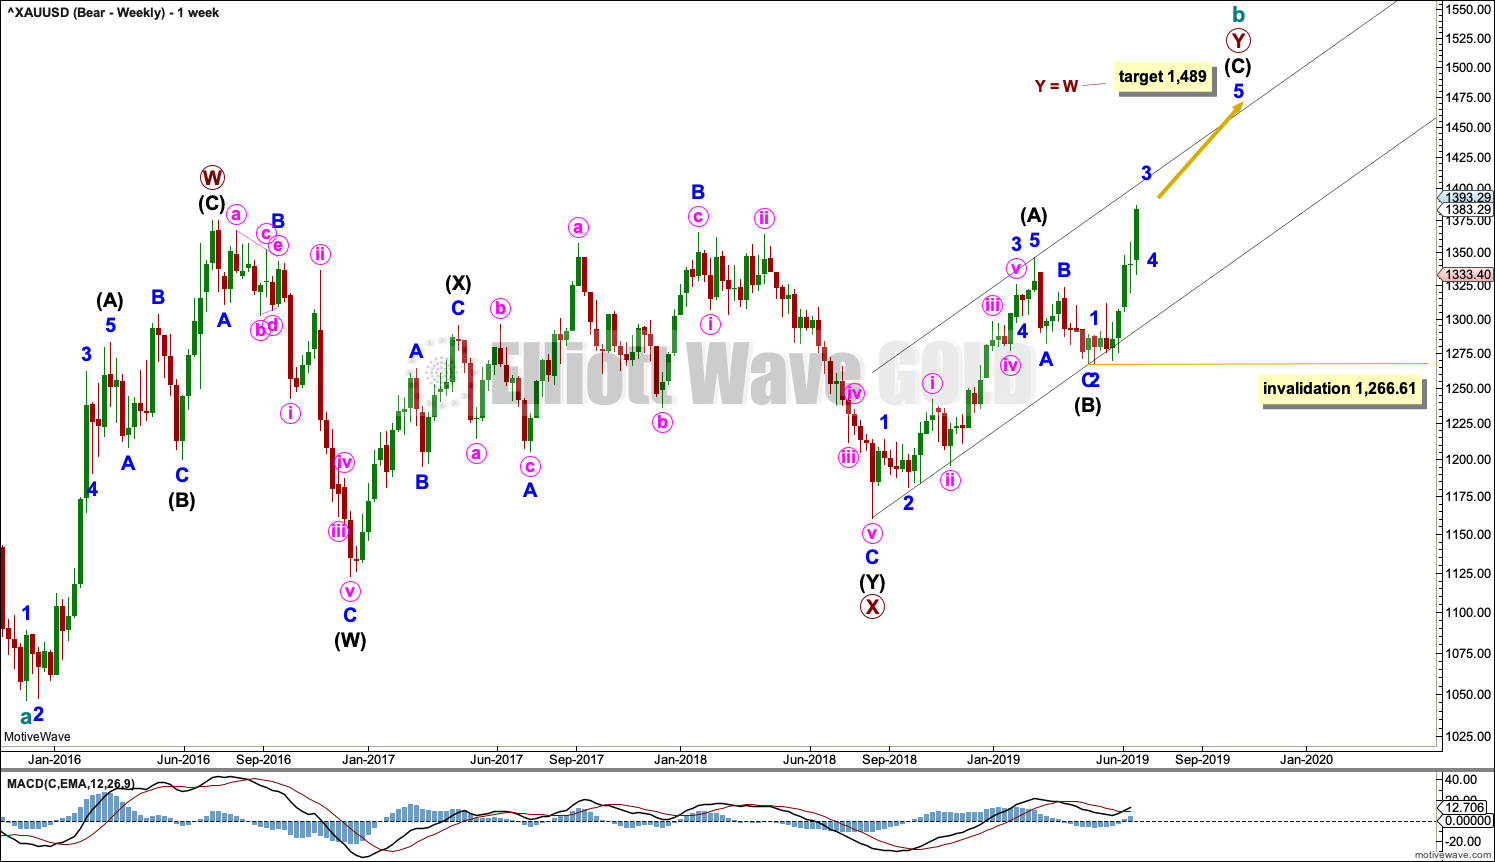
It remains possible that the bear market for Gold may yet continue when cycle wave b is complete. Cycle wave b may be still be an incomplete double zigzag.
Double zigzags are common structures, but within them their X waves are almost always single zigzags that are relatively brief and shallow. However, X waves may be any corrective structure, including a multiple.
The maximum number of corrective structures in a multiple is three. This count of three refers to W, Y and Z. To label any one of W, Y or Z as multiples violates this Elliott wave rule. However, X waves may be labelled as multiples and here the rule is met. X waves do occasionally subdivide as multiples.
This wave count sees primary wave X as a complete double combination: zigzag – X – expanded flat.
Primary wave Y may be completing higher as a zigzag. The purpose of a second zigzag in a double zigzag is to deepen the correction when the first zigzag does not move price far enough. The target for primary wave Y would see this purpose achieved.
If primary wave Y begins at 1,160.75, then the target for it to reach equality in length with primary wave W is at 1,489.
Primary wave Y is subdividing as a zigzag. Within the zigzag, intermediate waves (A) and (C) are complete. Intermediate wave (C) may only subdivide as a five wave structure. At this stage, it is clear it is an impulse.
DAILY CHART
Click chart to enlarge.
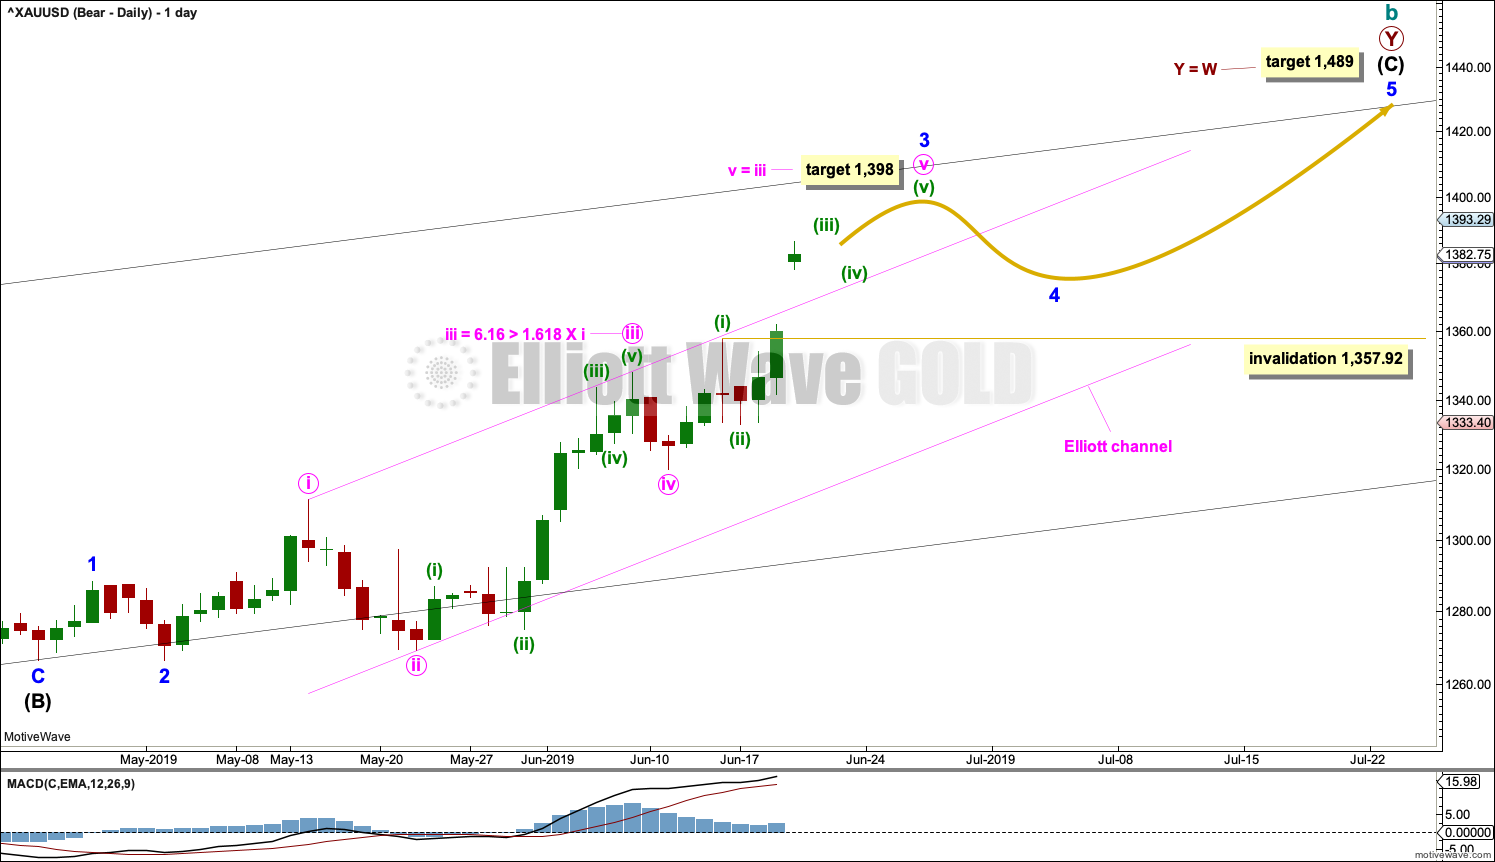
This chart focusses on the impulse of intermediate wave (C). The structure at the daily chart level, invalidation point and near term target is the same for both bull and bear wave counts at this stage.
The longer term target at 1,489 for this wave count is different.
SECOND WEEKLY CHART

Click chart to enlarge.
It is also possible that cycle wave b may be an incomplete double zigzag, with primary wave X within it a complete regular contracting triangle.
The most common point for E waves of Elliott wave triangles to end is to fall reasonably short of the A-C trend line. However, this example sees intermediate wave (E) too short of the (A)-(C) trend line for a normal look. This wave count is possible, but it has as reduced probability for this reason.
If primary wave Y begins at 1,266.61, then the target for it to reach equality in length with primary wave W is at 1,595.
TECHNICAL ANALYSIS
WEEKLY CHART
Click chart to enlarge. Chart courtesy of StockCharts.com.
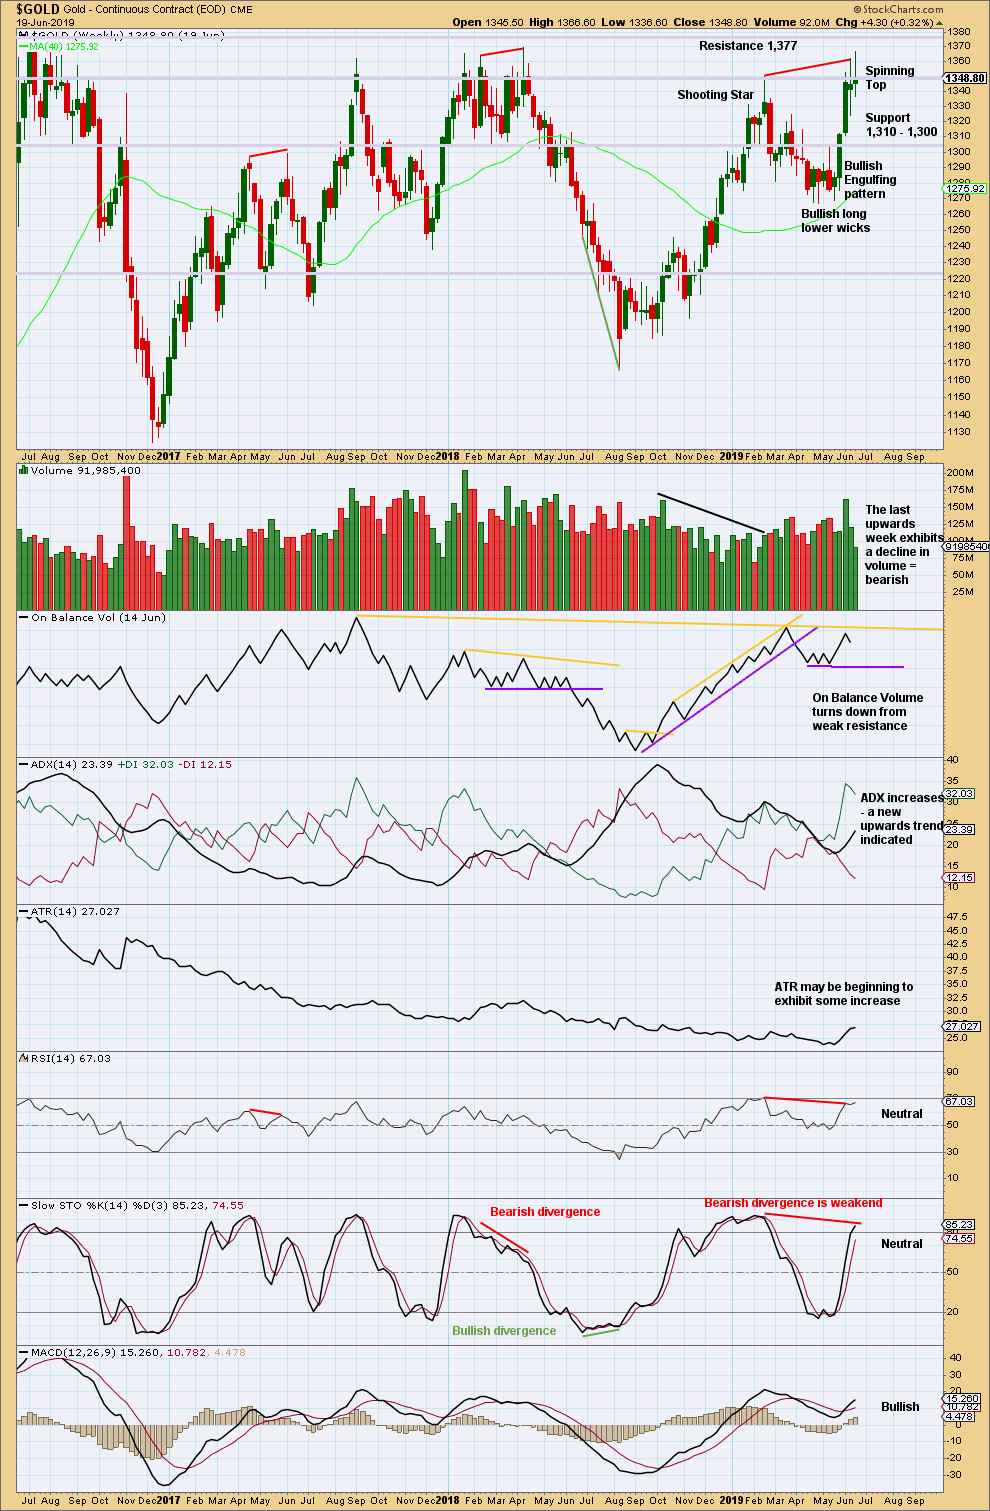
Today an upwards breakout may complete. There was strong multi-year resistance at 1,375 and today price has moved well above this point. Prior resistance may now become support.
Technical analysis below will be updated later today when the New York session ends and StockCharts have data available.
DAILY CHART
Click chart to enlarge. Chart courtesy of StockCharts.com.
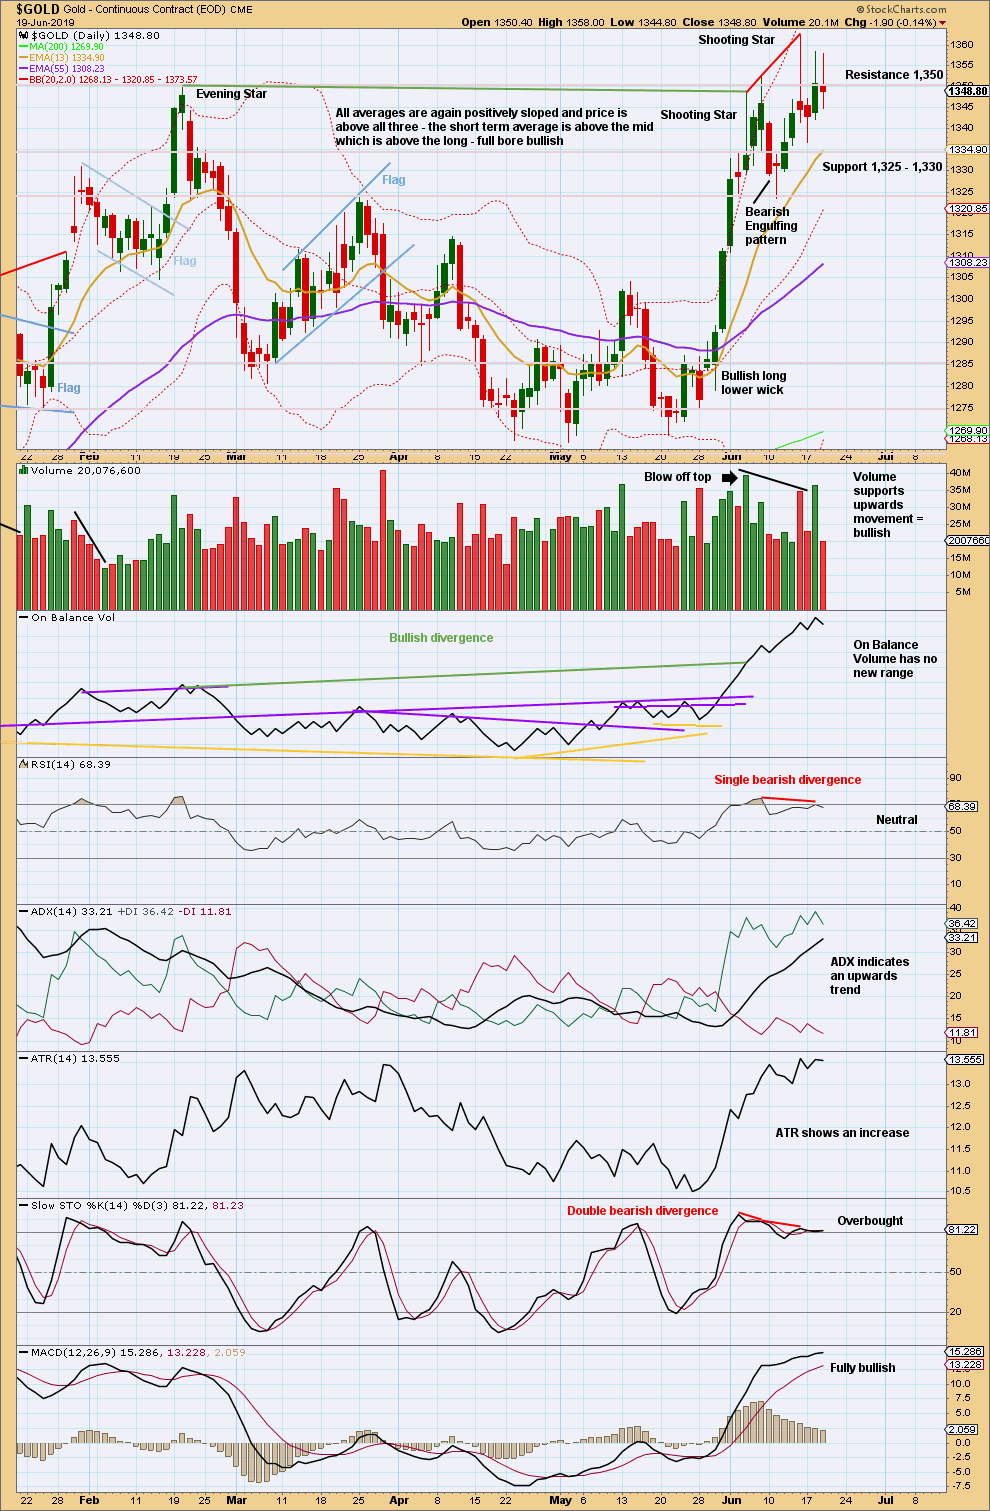
After the close of the New York session, Gold has moved higher to make a new high above the prior high on the 14th of June 2019. This may be shown in the next daily candlestick from StockCharts.
There is an upwards trend which has short-term support from volume. RSI and Stochastics have both reached extreme and then exhibited divergence with price; this often happens about major trend changes and that should still be a possibility to look out for. However, there is as yet no evidence of a trend change at this stage.
GDX WEEKLY CHART
Click chart to enlarge. Chart courtesy of StockCharts.com.
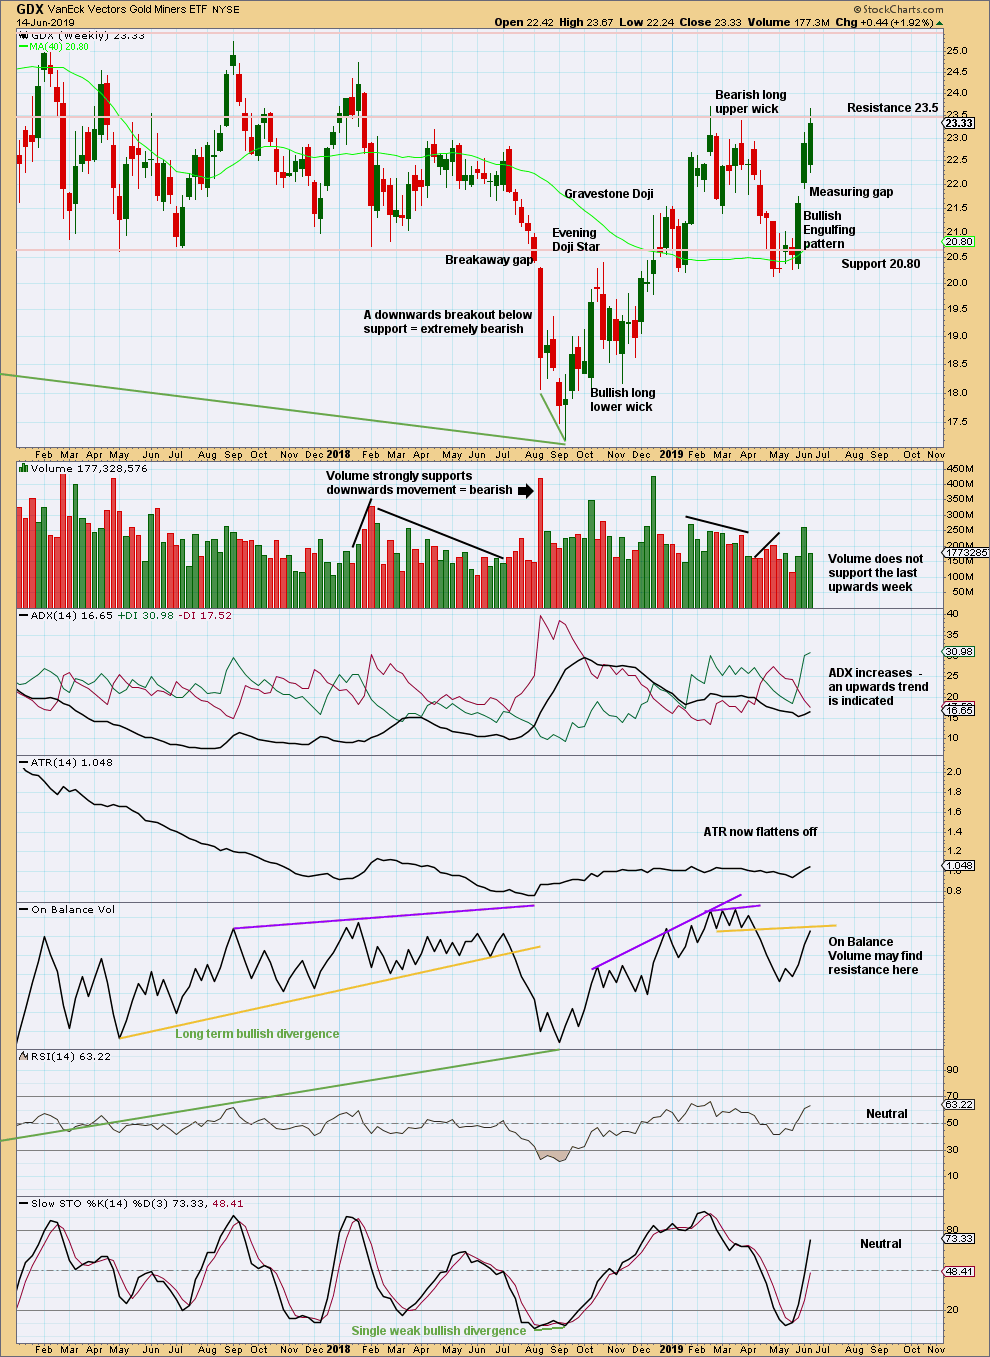
Some decline in volume last week is slightly bearish, but not enough for expect a high here for GDX. Assume an upwards trend remains until proven otherwise.
GDX DAILY CHART
Click chart to enlarge. Chart courtesy of StockCharts.com.
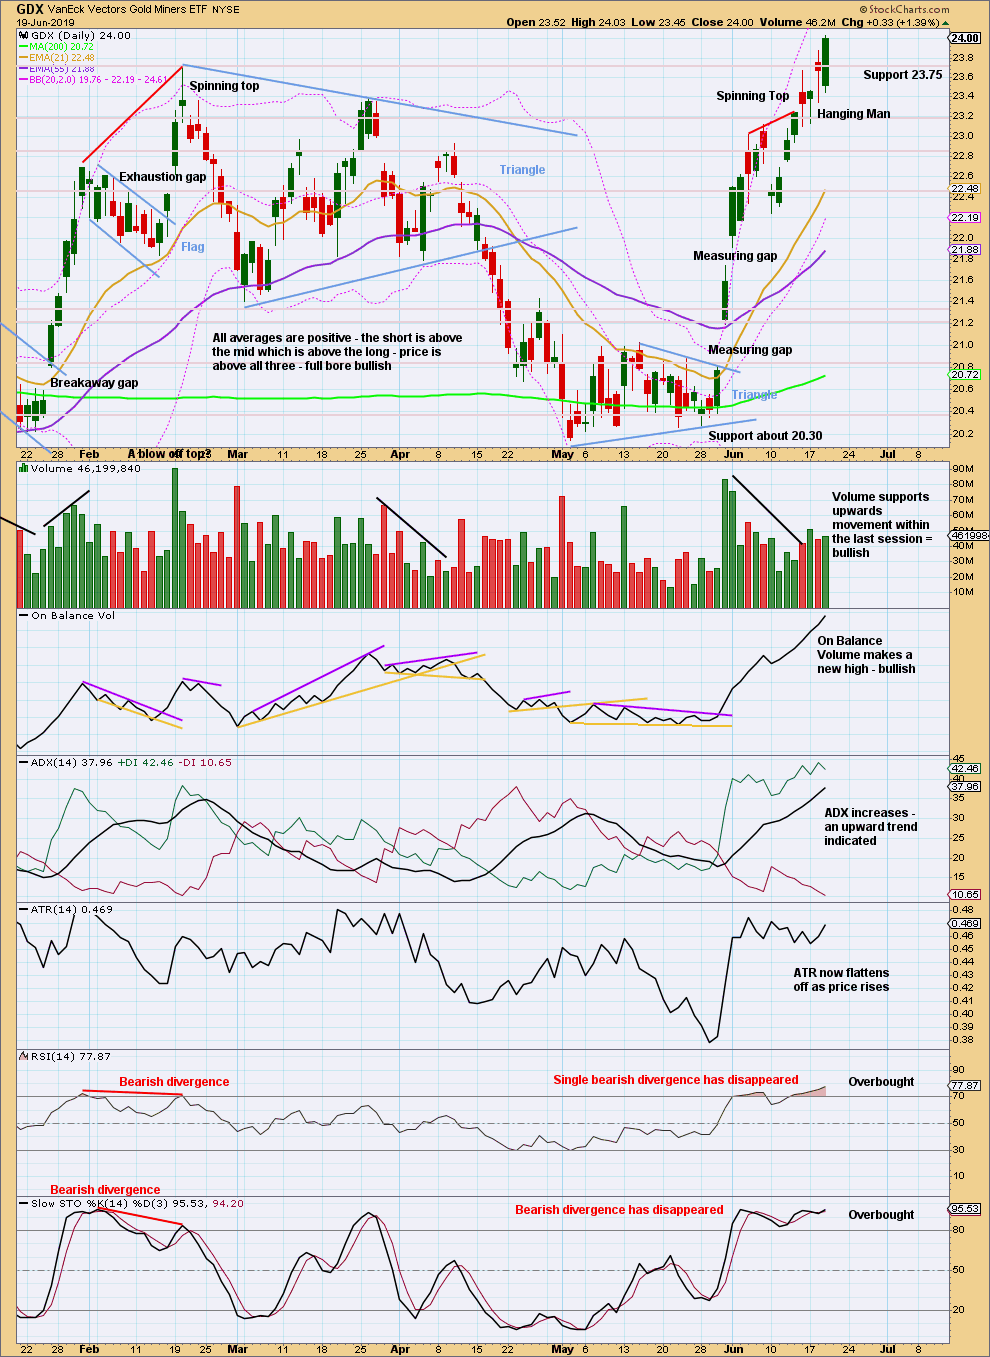
The last measuring gap may now provide support. It may remain open at 21.74.
An upwards trend is in place. Assume it will continue until proven otherwise. Today there is still no evidence of a trend change for GDX.
Published @ 11:45 a.m. EST.
—
Careful risk management protects your trading account(s).
Follow my two Golden Rules:
1. Always trade with stops.
2. Risk only 1-5% of equity on any one trade.
—
New updates to this analysis are in bold.
It is possible that intermediate (3) for this count may now be over. Intermediate (4) may be a multi day sideways consolidation which may be shallow, to resolve extreme conditions.
I’ll be preparing an hourly chart for the bearish count today too.
ready for the final blow up?
Maybe.
It’s just not feeling that strong to me.
From a sentiment point of view, it just still feels like Gold is going through a stage of being unloved – no dividends paid, and you’ve really got to hold it long term to make it worthwhile.
Sentiment can change quickly, but still get that feeling it could quite easily bring in those lows Lara has been talking of.
Silvers and the miners have barely responded – I will be wrong – lol – but still doesn’t feel exciting yet.
massive long term CUP and handle for silver- over 30 years.
First it needs to clear $16.30.
And Gold to solver ratio need to head down from this level.
My cup and handle formation is now complete, I’ve taken a small short today.
What’s your target, Keith ?
Going back in long, or sitting it out for a while ?
Lara, thanks for all the updates today!
I’ve always thought that the low volume Trading Zone from about 1,488 to 1,525 would be hit, and we now have confidence that will happen. If Grand Super Cycle Wave 4 is complete (Bull Count), that seems too short @ about 5 years and will not look like a 3 on the monthly chart. I think your 2 Bear Counts have a better probability.
Here’s another way to look at possible upside targets, then the possibility that Gold turns down again to bottom in approximately 2024ish.
That looks entirely possible. I am leaning towards the bearish scenario today, but after invalidation of the triangle I’m rather nervous about again identifying a bearish count as more likely.
Hourly chart:
If minute wave iii is over at the last swing high then it is just 1.22 short of 1.618 the length of minute wave i.
Minute wave iv may be relatively brief and shallow.
Look out for the possibility for minute wave v to form a blow off top, it may exhibit further strength.
Updated technical analysis daily chart:
Now that the NY session is closed StockCharts have data for this last session.
Price has closed near the high for the session, normally this indicates further upwards movement for the next session.
The breakout above prior resistance at 1,375 which was held for years, today has support from volume. Confidence may be had in this breakout.
Shortly (not tomorrow) price may curve down to test support which may now sit about 1,375 to 1,360. If price does behave like this it would offer a leisurely entry to join an established upwards trend. While this is common behaviour for price after upwards breakouts, it does not always happen.
The upwards trend is not yet extreme, there is room for it to run before a pullback or consolidation may develop to relieve conditions. There is good underlying strength to this trend.