
After an upwards breakout on Friday, three Elliott wave counts remain valid.
Summary: A shallow consolidation or a pullback to test support after the upwards breakout may now unfold next week. Look for support about 1,370 to 1,375. Thereafter, the upwards trend may resume.
A target for the upwards trend to either end or be interrupted by a major correction may be at 1,489 or 1,565.
The bullish wave count has a long-term target at 1,693 for cycle wave III to end.
Grand SuperCycle analysis is here.
Last monthly charts are here. Video is here.
Overall, the bearish wave counts still have a higher probability based upon Elliott wave structures. However, it would be best to leave price to invalidate either the bullish or bearish scenario before having confidence in which is correct.
BEARISH ELLIOTT WAVE COUNTS
FIRST WEEKLY CHART
Click chart to enlarge.
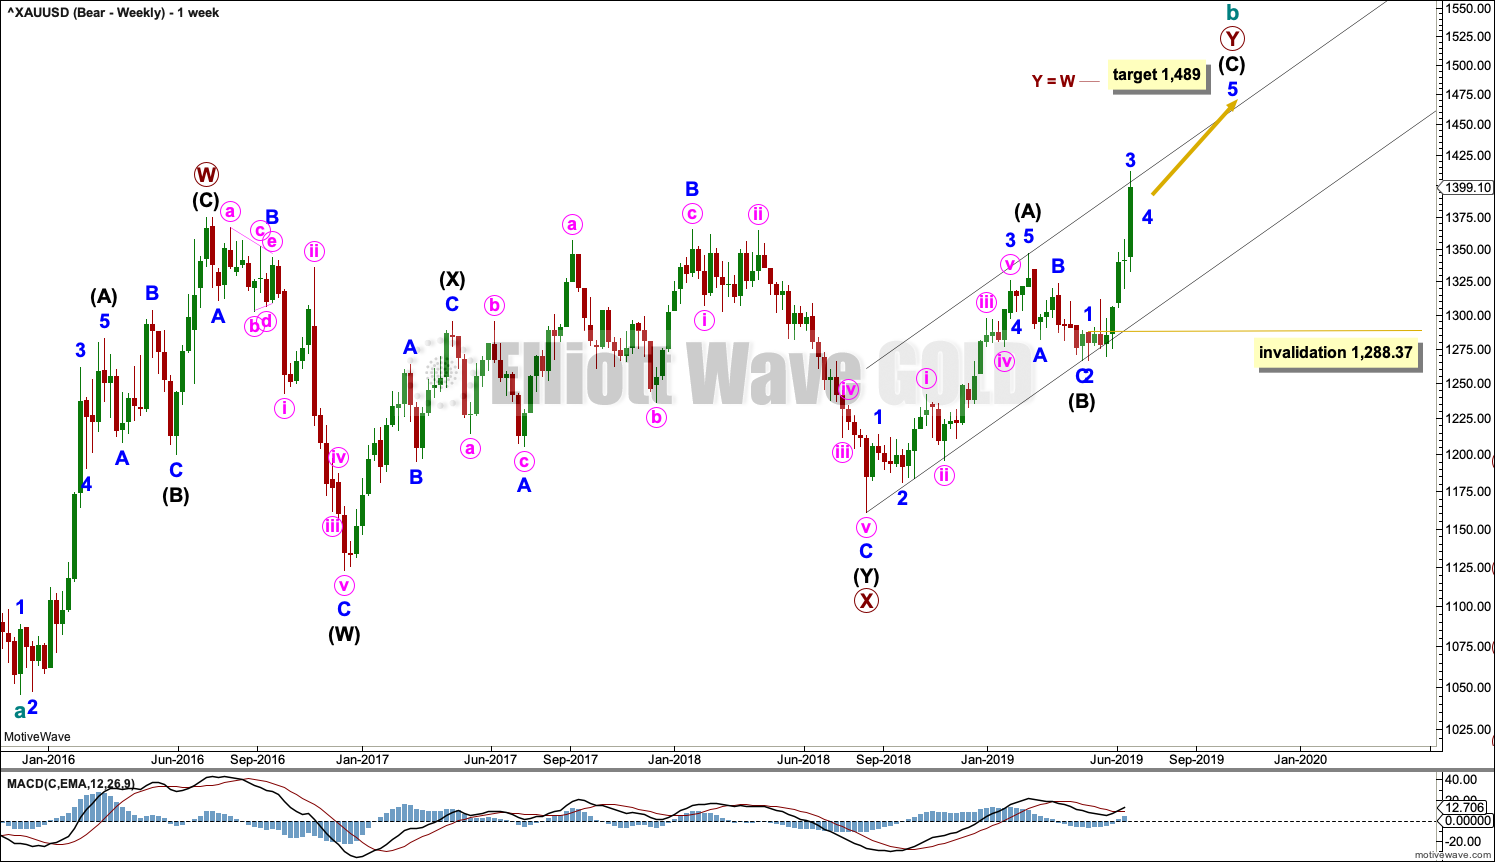
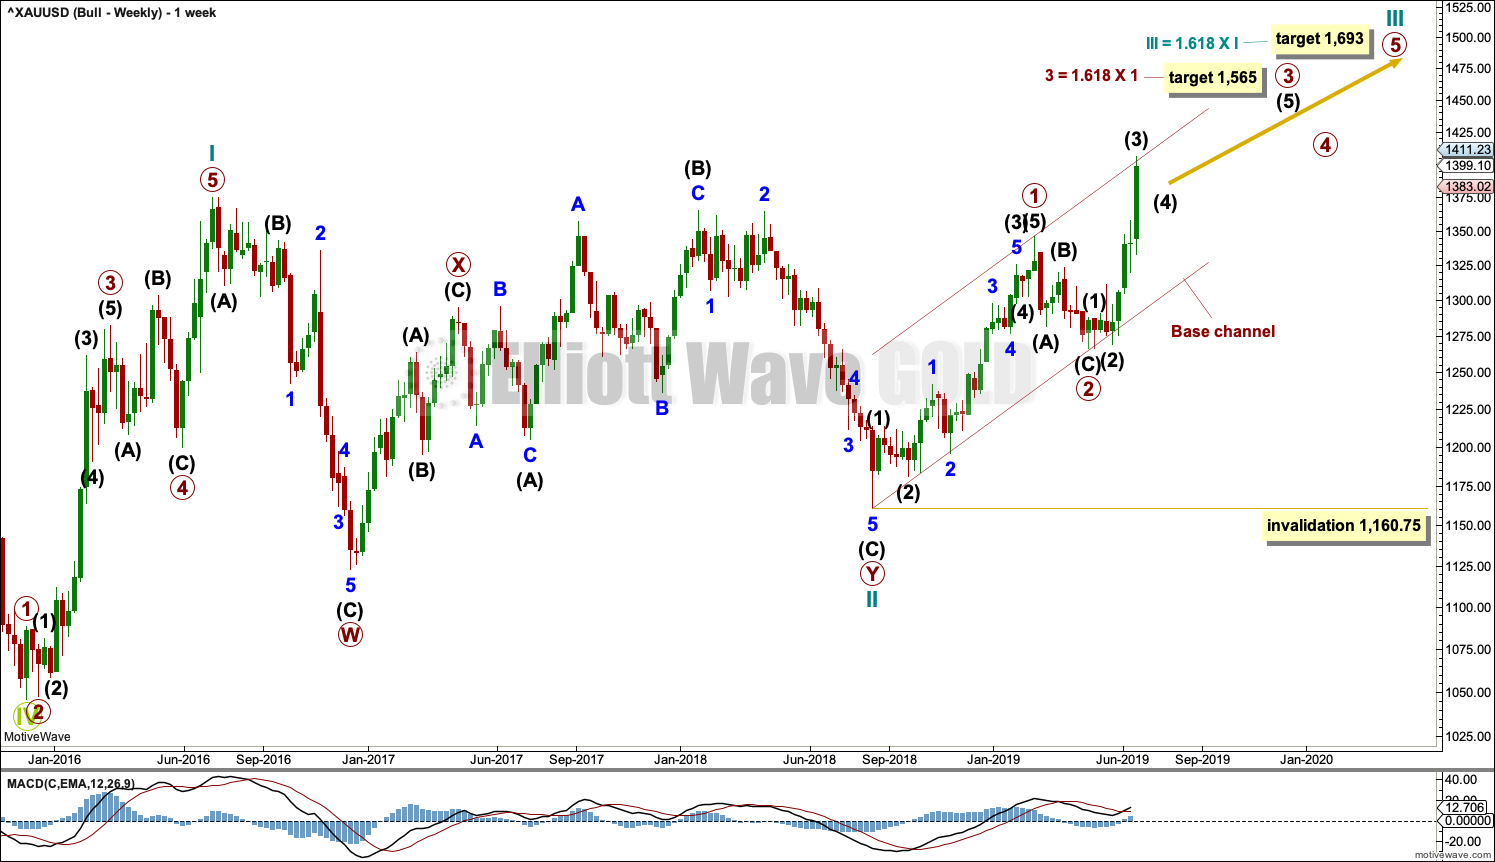
It remains possible that the bear market for Gold may yet continue when cycle wave b is complete. Cycle wave b may be still be an incomplete double zigzag.
Double zigzags are common structures, but within them their X waves are almost always single zigzags that are relatively brief and shallow. However, X waves may be any corrective structure, including a multiple.
The maximum number of corrective structures in a multiple is three. This count of three refers to W, Y and Z. To label any one of W, Y or Z as multiples violates this Elliott wave rule. However, X waves may be labelled as multiples and here the rule is met. X waves do occasionally subdivide as multiples.
This wave count sees primary wave X as a complete double combination: zigzag – X – expanded flat.
Primary wave Y may be completing higher as a zigzag. The purpose of a second zigzag in a double zigzag is to deepen the correction when the first zigzag does not move price far enough. The target for primary wave Y would see this purpose achieved.
If primary wave Y begins at 1,160.75, then the target for it to reach equality in length with primary wave W is at 1,489.
Primary wave Y is subdividing as a zigzag. Within the zigzag, intermediate waves (A) and (C) are complete. Intermediate wave (C) may only subdivide as a five wave structure. At this stage, it is clear it is an impulse. Within intermediate wave (C), minor wave 4 may not move into minor wave 1 price territory.
DAILY CHART
Click chart to enlarge.
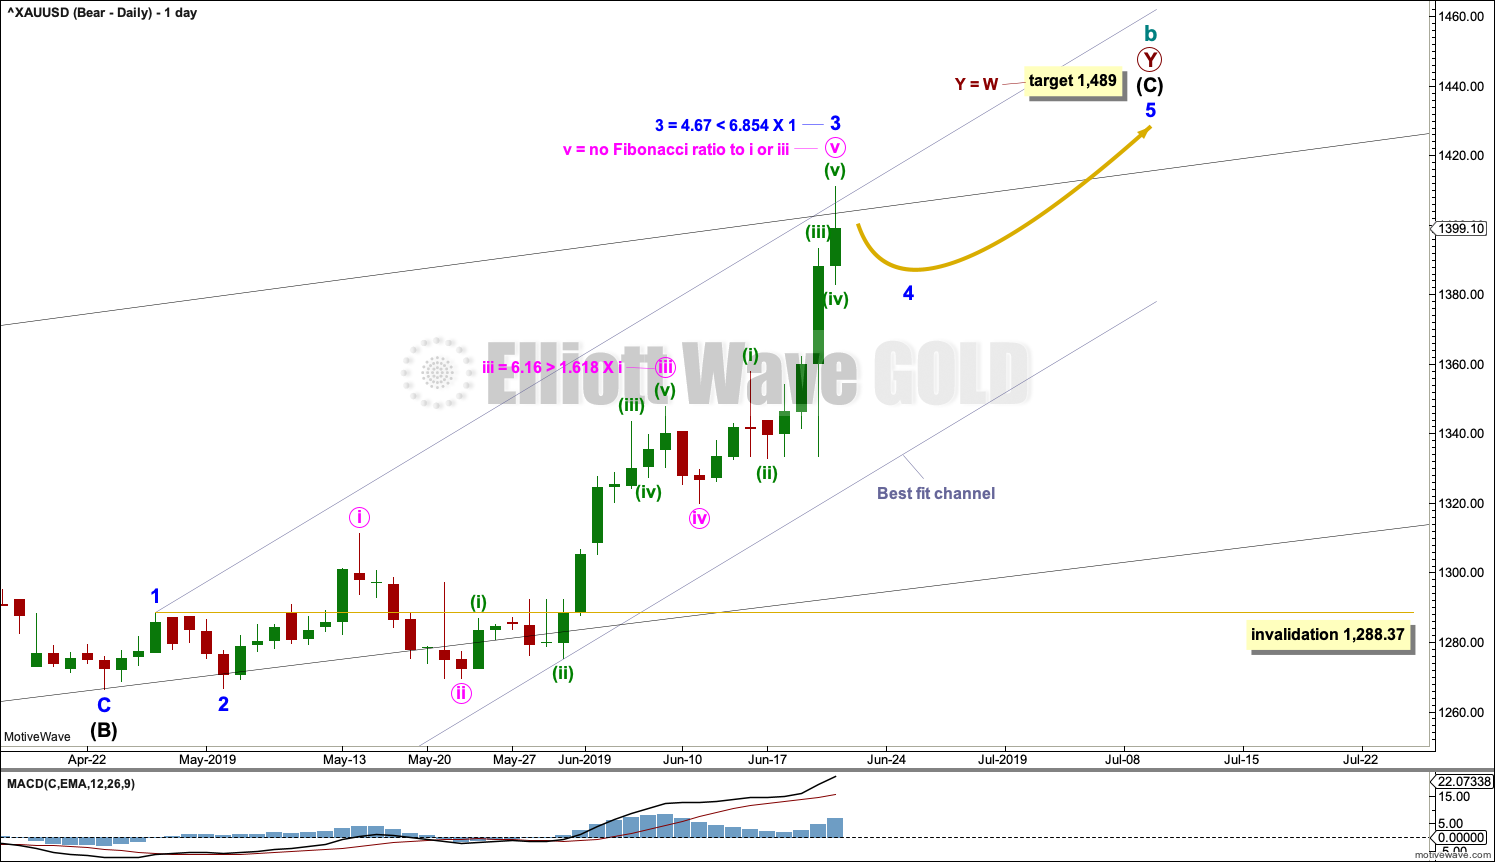
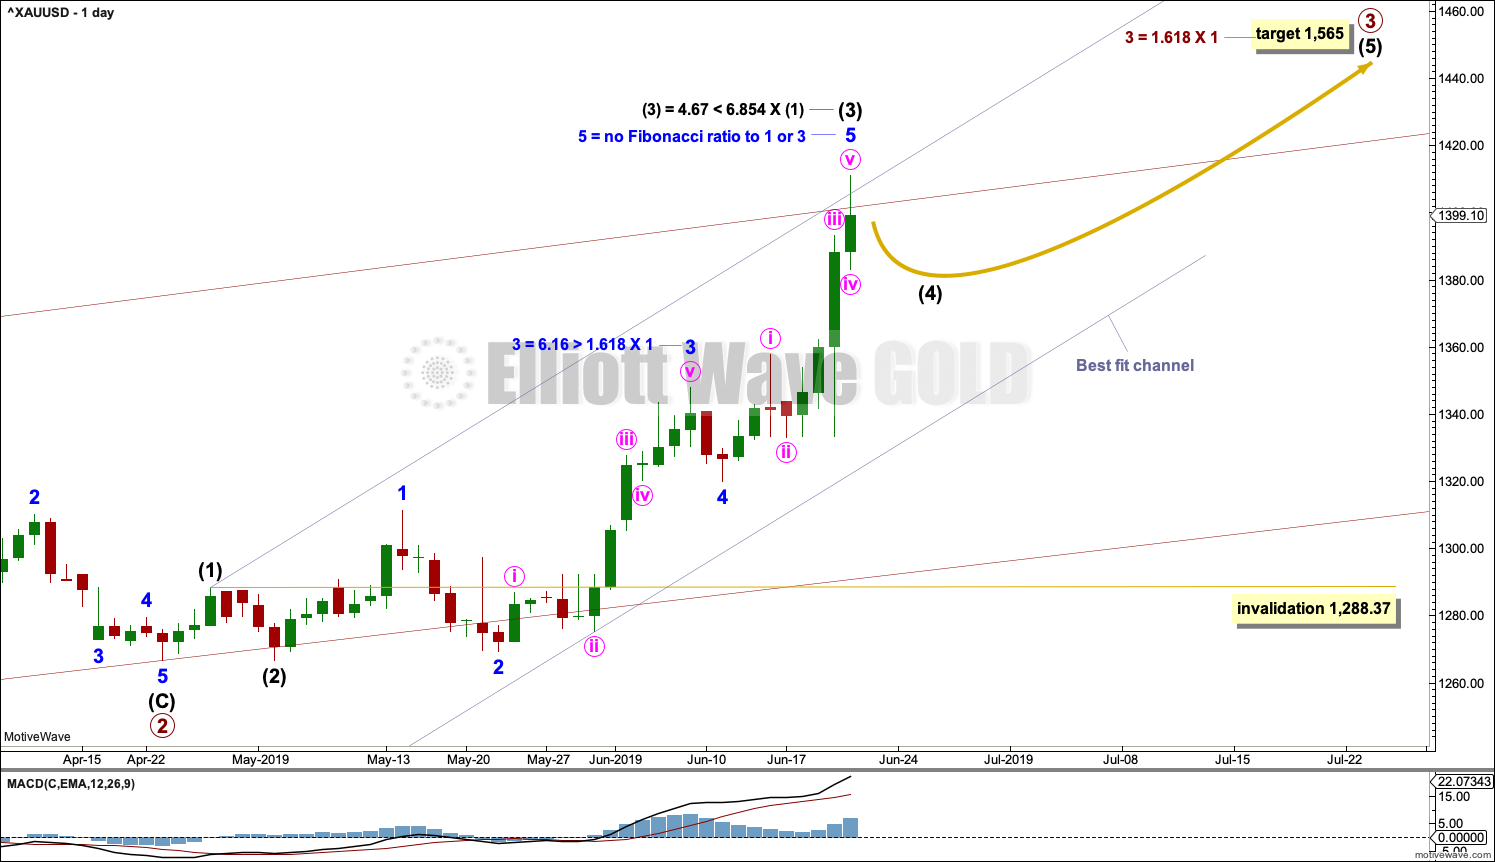
This chart focusses on the impulse of intermediate wave (C).
Intermediate wave (C) is subdividing as an impulse. Within the impulse, minor waves 1 through to 3 may be complete. Minor wave 4 may now unfold as a shallow sideways correction that may not move into minor wave 1 price territory below 1,288.37.
Minor wave 2 was a deep 0.99 zigzag. Given the guideline of alternation, minor wave 4 may be expected to be a very shallow flat, combination or triangle. Minor wave 2 lasted 4 days. Minor wave 4 may be about equal in duration, or it may last longer as sideways structures tend to be slower than zigzags.
There is no adequate Fibonacci ratio between minor waves 1 and 3. Gold usually exhibits at least one Fibonacci ratio between the three actionary waves of an impulse, and so here it would be very likely to exhibit a Fibonacci ratio for minor wave 5.
When minor wave 4 is complete, then the Fibonacci ratio between minor wave 5 and either of minor waves 1 or 3 may be used to add to the target calculation. At that stage, the target may widen to a small zone or it may change.
HOURLY CHART
Click chart to enlarge.
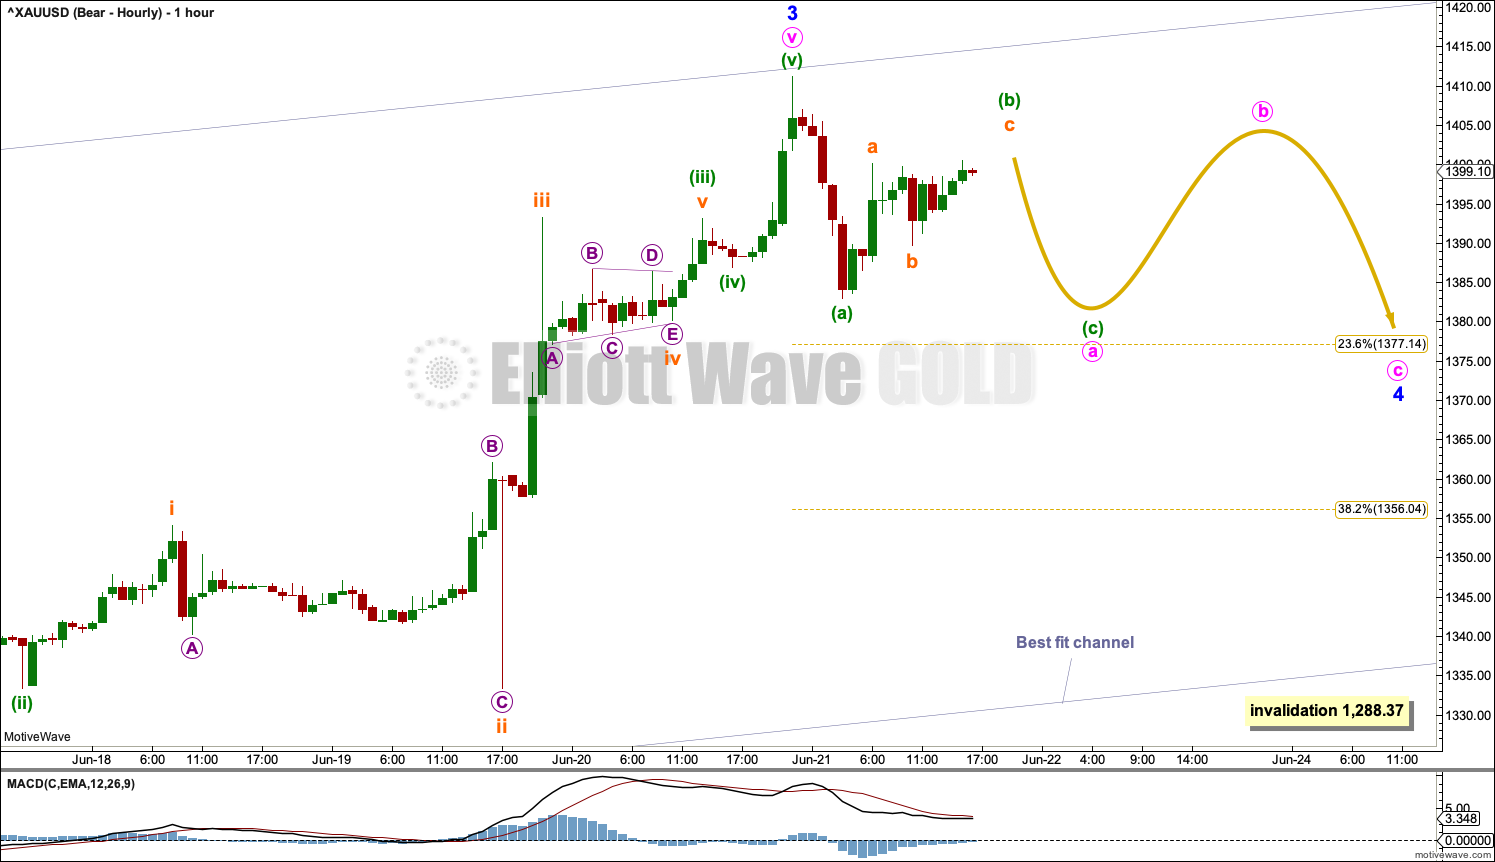
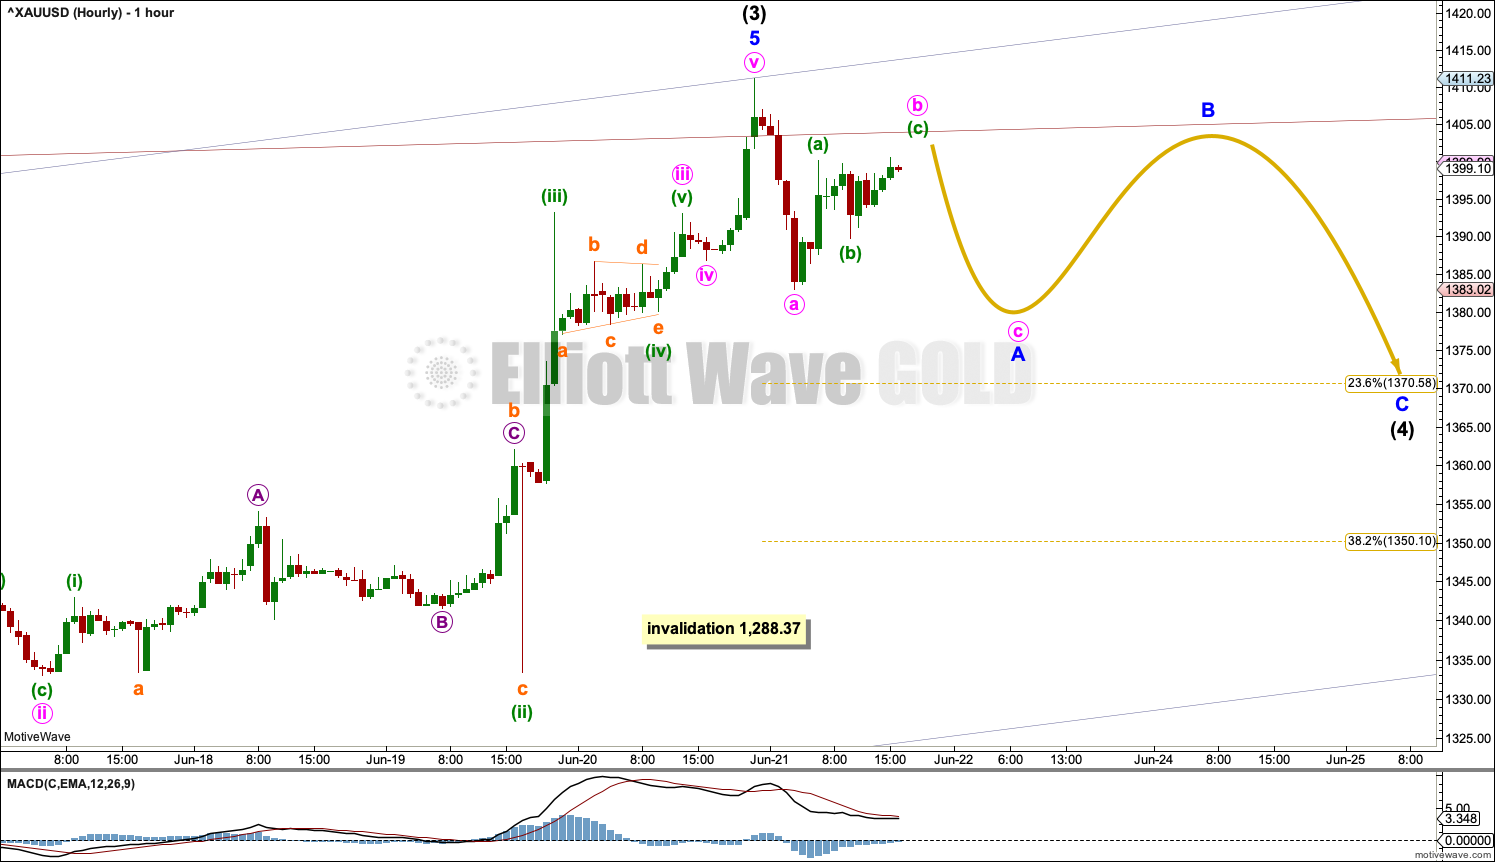
Minor wave 4 may subdivide as any one of more than 23 possible corrective structures. It would most likely be a flat, triangle or combination. Those structures begin with a three for minute wave a or w. All of a flat, combination or triangle may also include a new high above the start of minor wave 4 at 1,411.23.
Focus next week will be not on which structure minor wave 4 may be but on identifying when a correction may be complete. The labelling within minor wave 4 will very likely change as it unfolds sideways.
SECOND WEEKLY CHART
Click chart to enlarge.
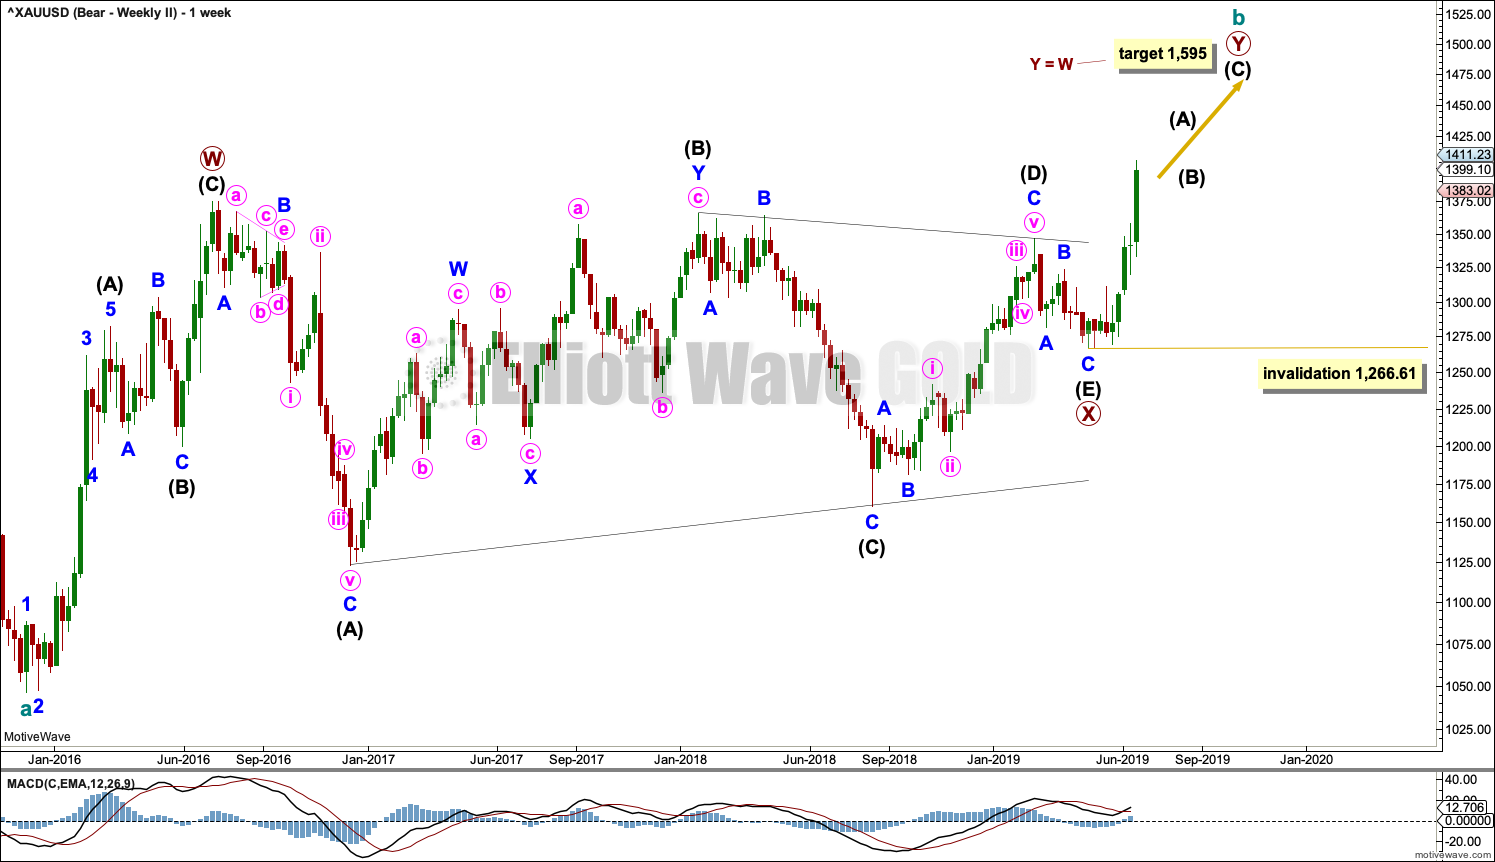
It is also possible that cycle wave b may be an incomplete double zigzag, with primary wave X within it a complete regular contracting triangle.
The most common point for E waves of Elliott wave triangles to end is to fall reasonably short of the A-C trend line. However, this example sees intermediate wave (E) too short of the (A)-(C) trend line for a normal look. This wave count is possible, but it has as reduced probability for this reason.
If primary wave Y begins at 1,266.61, then the target for it to reach equality in length with primary wave W is at 1,595.
BULLISH ELLIOTT WAVE COUNT
WEEKLY CHART
Click chart to enlarge.
This wave count sees the the bear market complete at the last major low for Gold in November 2015.
If Gold is in a new bull market, then it should begin with a five wave structure upwards on the weekly chart. However, the biggest problem with this wave count is the structure labelled cycle wave I because this wave count must see it as a five wave structure, but it looks more like a three wave structure.
Commodities often exhibit swift strong fifth waves that force the fourth wave corrections coming just prior and just after to be more brief and shallow than their counterpart second waves. It is unusual for a commodity to exhibit a quick second wave and a more time consuming fourth wave, and this is how cycle wave I is labelled. This wave count still suffers from this very substantial problem, and for this reason two bearish wave counts are still considered above as they have a better fit in terms of Elliott wave structure.
Cycle wave II subdivides well as a double combination: zigzag – X – expanded flat.
Cycle wave III may have begun. Within cycle wave III, primary waves 1 and 2 may now be complete. If it continues lower as a double zigzag, then primary wave 2 may not move beyond the start of primary wave 1 below 1,160.75.
Cycle wave III so far for this wave count would have been underway now for 44 weeks. It may be beginning to exhibit some support from volume and increasing ATR. If this increase continues, then this wave count would have some support from technical analysis.
Draw a base channel about primary waves 1 and 2: draw the first trend line from the start of primary wave 1 to the end of primary wave 2, then place a parallel copy on the end of primary wave 1. Primary wave 3 should have the power to break through resistance at the upper edge of the base channel. Copy this channel over to the daily chart.
DAILY CHART
Click chart to enlarge.
This daily chart focusses on the impulse of primary wave 3.
Primary wave 3 may only subdivide as an impulse. Within primary wave 3, minor waves 1 through to 3 may be complete.
The structure of primary wave 3 for this wave count is exactly the same as the structure of intermediate wave (C) for the bearish wave count. Targets, invalidation points and expectations are exactly the same for the mid term.
HOURLY CHART
Click chart to enlarge.
Minor wave 4 for this wave count is now expected to unfold over a few days in exactly the same was as intermediate wave (4) for the bearish wave count.
TECHNICAL ANALYSIS
MONTHLY CHART
Click chart to enlarge. Chart courtesy of StockCharts.com.
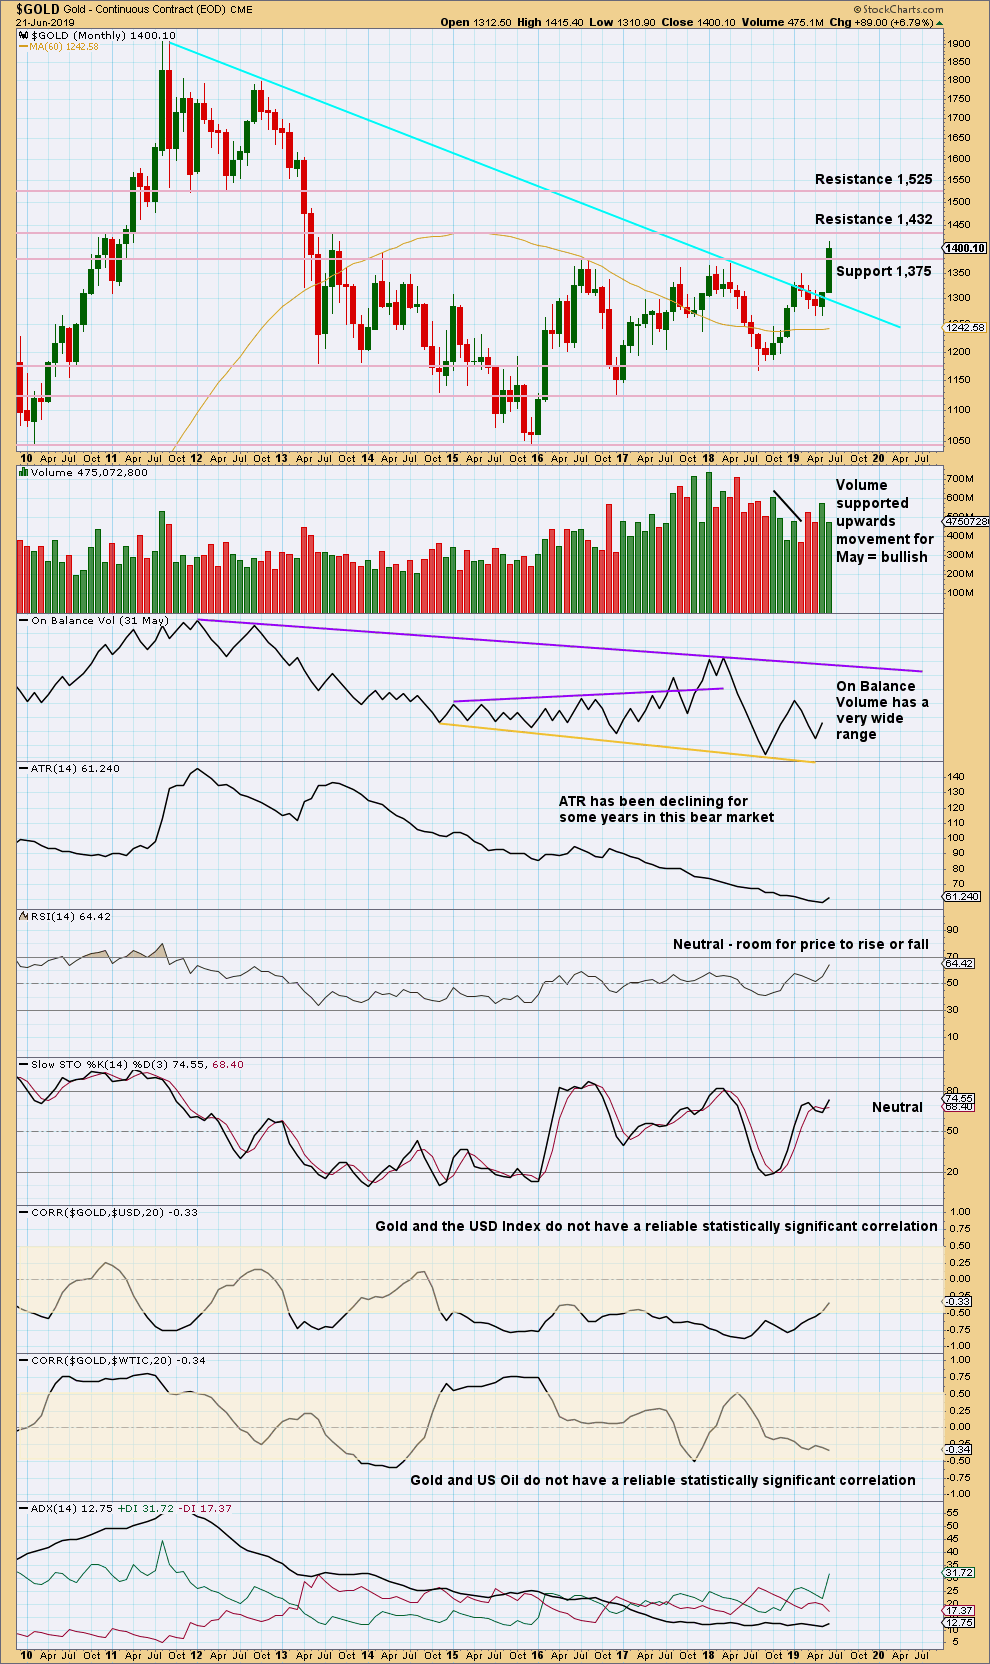
Gold is this week effecting an upwards breakout above multi-year resistance and above the cyan bear market trend line. Look for next resistance identified on the chart.
WEEKLY CHART
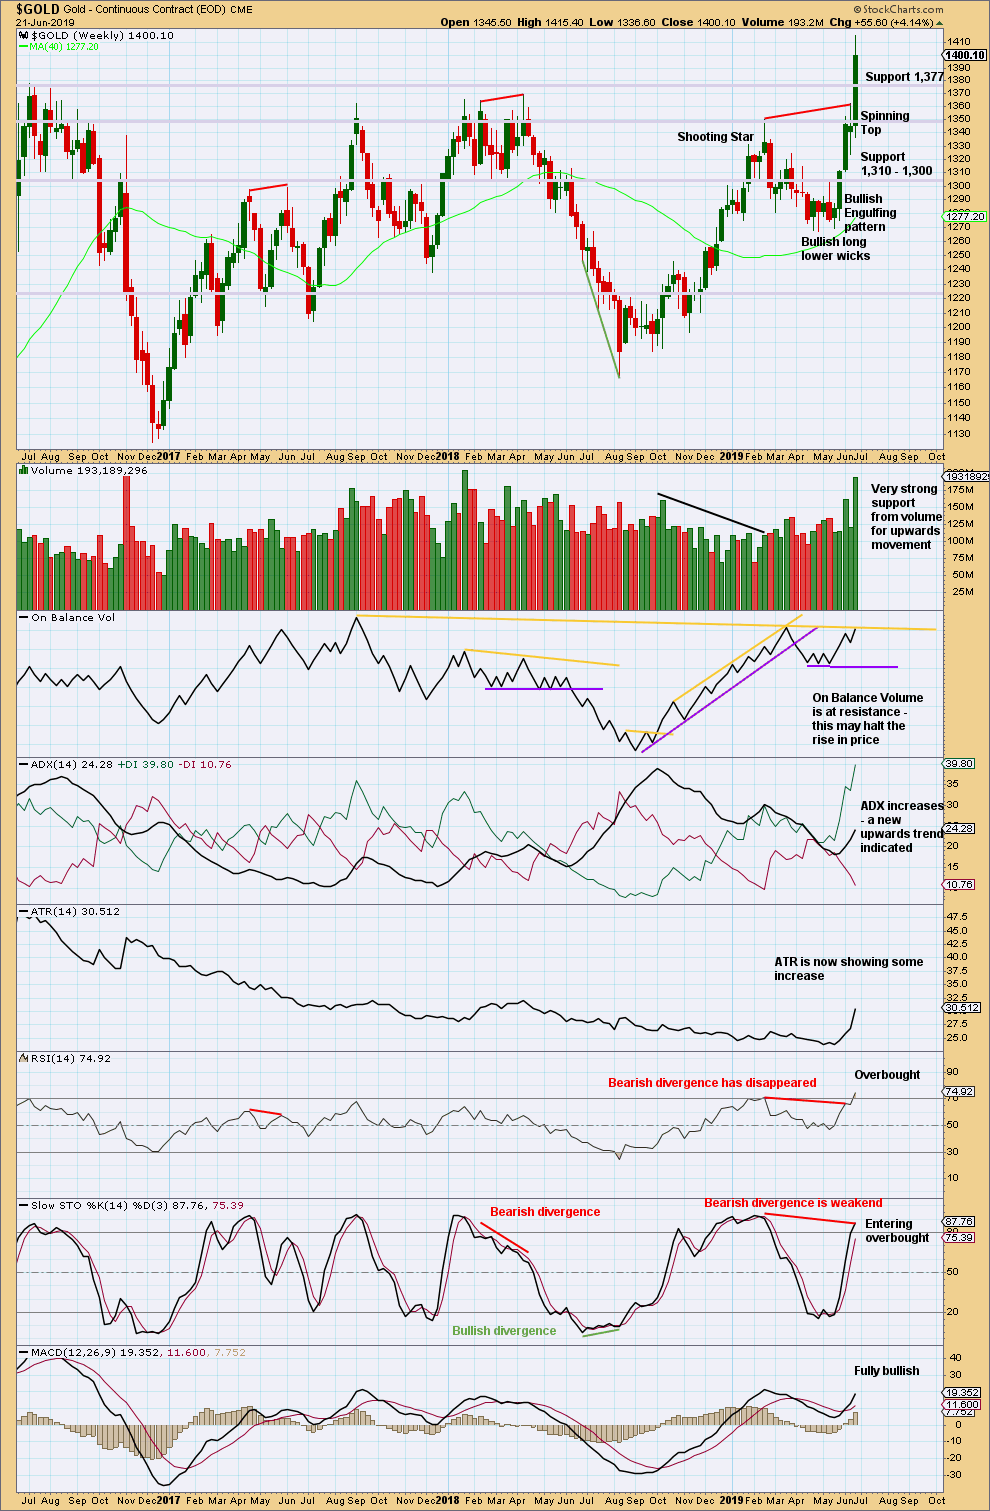
Click chart to enlarge. Chart courtesy of StockCharts.com.
Gold has broken out of a multi-year consolidation, which saw resistance about 1,375. The breakout has support from volume, so confidence may be had in it.
Price now has some strength with rising ATR. Conditions are overbought and On Balance Volume is at resistance. A pullback or consolidation may begin here before the upwards trend resumes.
Look now for strong support about 1,375 for a possible back test.
DAILY CHART
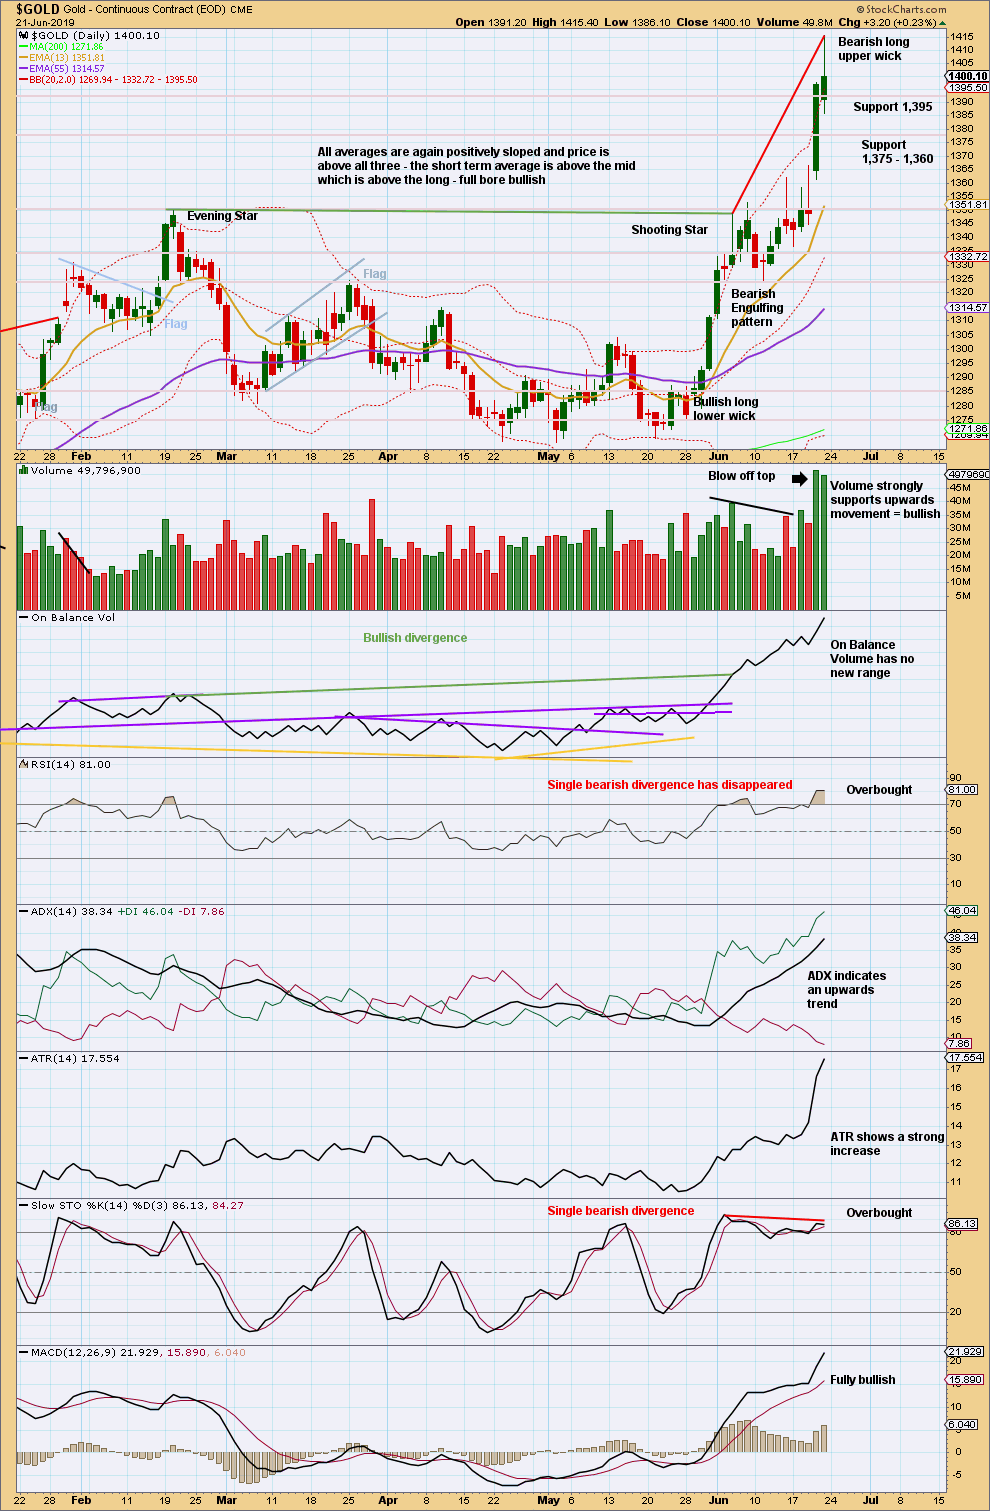
Click chart to enlarge. Chart courtesy of StockCharts.com.
After the upwards breakout, it would be typical to see price curve back down to test support at prior resistance. Extreme overbought conditions may be relieved by a back test.
The trend is upwards. Consolidations and pullbacks are opportunities in an upwards trend to join the trend.
GDX WEEKLY CHART
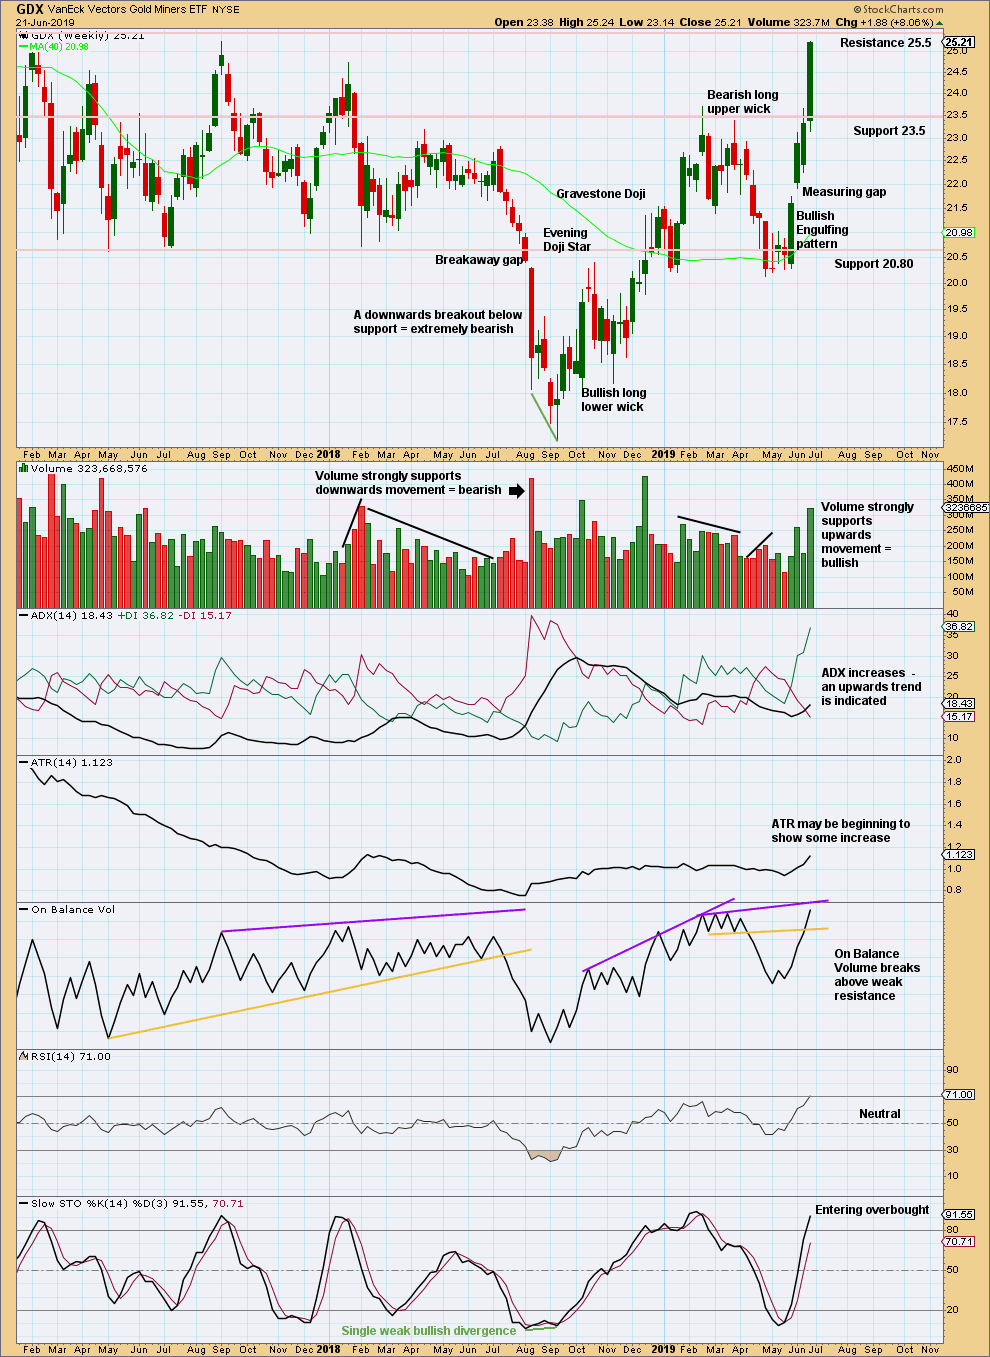
Click chart to enlarge. Chart courtesy of StockCharts.com.
The upwards trend continues. A close near the high for the week suggests more upwards movement next week.
GDX DAILY CHART

Click chart to enlarge. Chart courtesy of StockCharts.com.
A target calculated from the new measuring gap is 25.82. Friday’s candlestick suggests more upwards movement on Monday.
Published @ 02:37 p.m. EST on June 22, 2019.
—
Careful risk management protects your trading account(s).
Follow my two Golden Rules:
1. Always trade with stops.
2. Risk only 1-5% of equity on any one trade.
—
New updates to this analysis are in bold.
On the hourly chart, price is forming an ascending wedge. This can break either way.
Based on falling volume and MACD divergence, I think it’s more likely to break downwards. Daily Stockcharts volume looks like it is weak also, unless the volume is not final yet.
https://www.tradingview.com/x/TeFyGTEL/
Bull count: Hourly chart updated:
Intermediate (4) may be an expanded flat correction. But this count expects weakness in todays upwards movement. If there is any strength then I may change analysis of intermediate (3) to see it incomplete, or possibly consider intermediate (4) already over at the low labelled minor wave A.