
An upwards breakout fits the alternate Elliott wave count.
Summary: An upwards breakout on Friday has support from volume. The target is just above 1,346.
A new high above 1,311.40 would add confidence that an upwards trend to move above 1,346.45 is underway.
Grand SuperCycle analysis is here.
Last monthly charts are here. Video is here.
MAIN ELLIOTT WAVE COUNT
WEEKLY CHART – TRIANGLE
Click chart to enlarge.
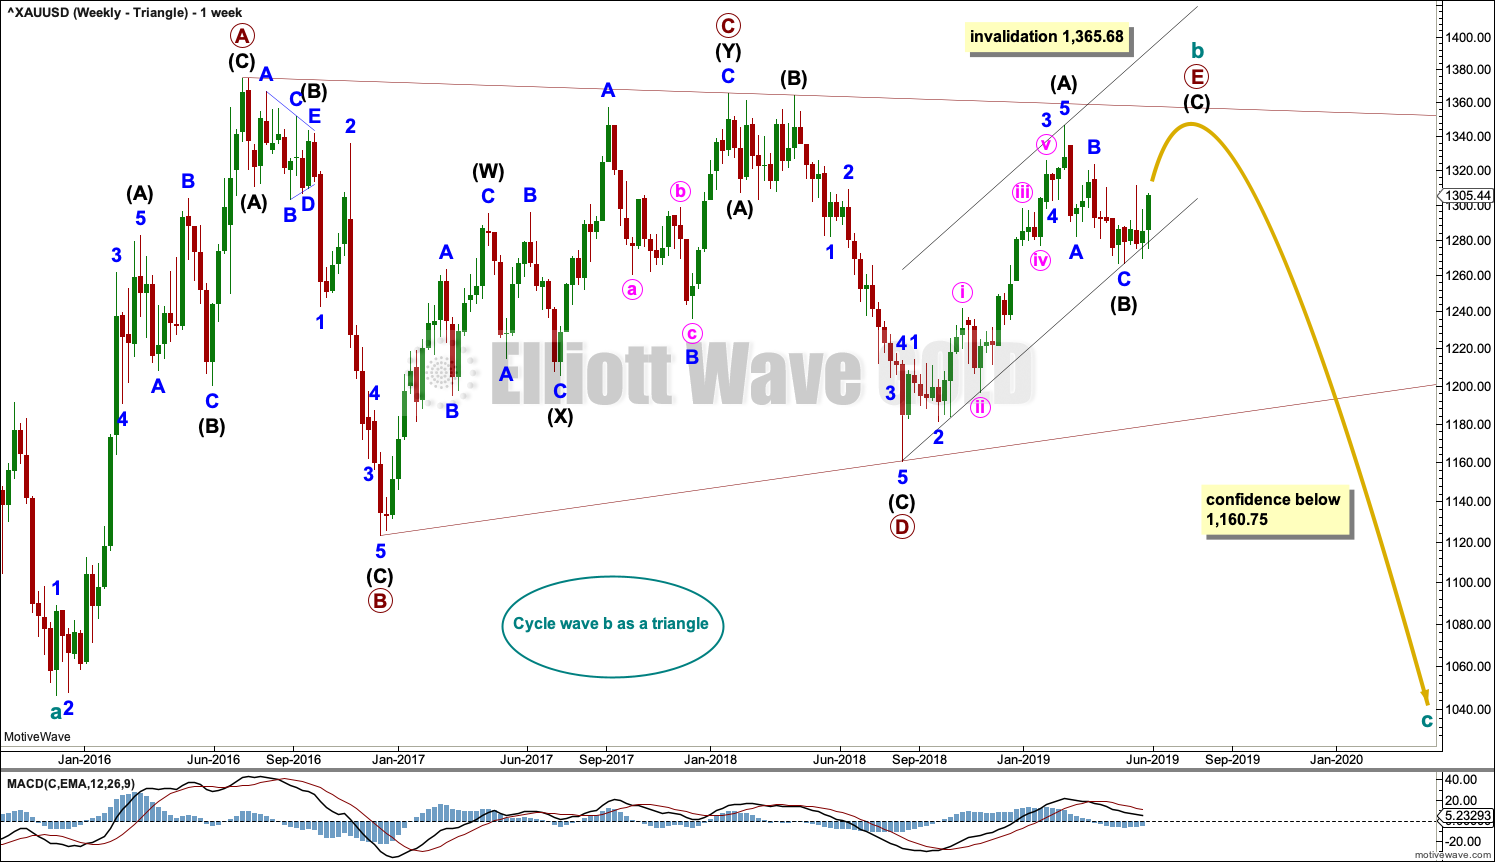
The basic Elliott wave structure is five waves up followed by three waves back (in a bull market). At this time, the preferred Elliott wave count sees Gold as still within three waves back, which began at the all time high in September 2011.
Five waves up are labelled 1,2,3,4,5. Three waves back are labelled A,B,C.
This wave count sees Gold as now about two thirds through the three waves back. The three wave structure is labelled cycle waves a, b and c.
The triangle for cycle wave b may still be incomplete. The final sub-wave of primary wave E may be an incomplete zigzag. Within the zigzag of primary wave E, intermediate wave (C) would be very likely to make at least a slight new high above the end of intermediate wave (A) to avoid a truncation.
Primary wave E may either undershoot or overshoot the A-C trend line. Primary wave E may not move beyond the end of primary wave C above 1,365.68.
Draw a channel about the zigzag of primary wave E using Elliott’s technique. Draw the first trend line from the start of intermediate wave (A) to the end of intermediate wave (B), then place a parallel copy on the end of intermediate wave (A). While intermediate wave (C) continues higher, the lower edge of the channel should provide support. Copy the channel over to the daily chart.
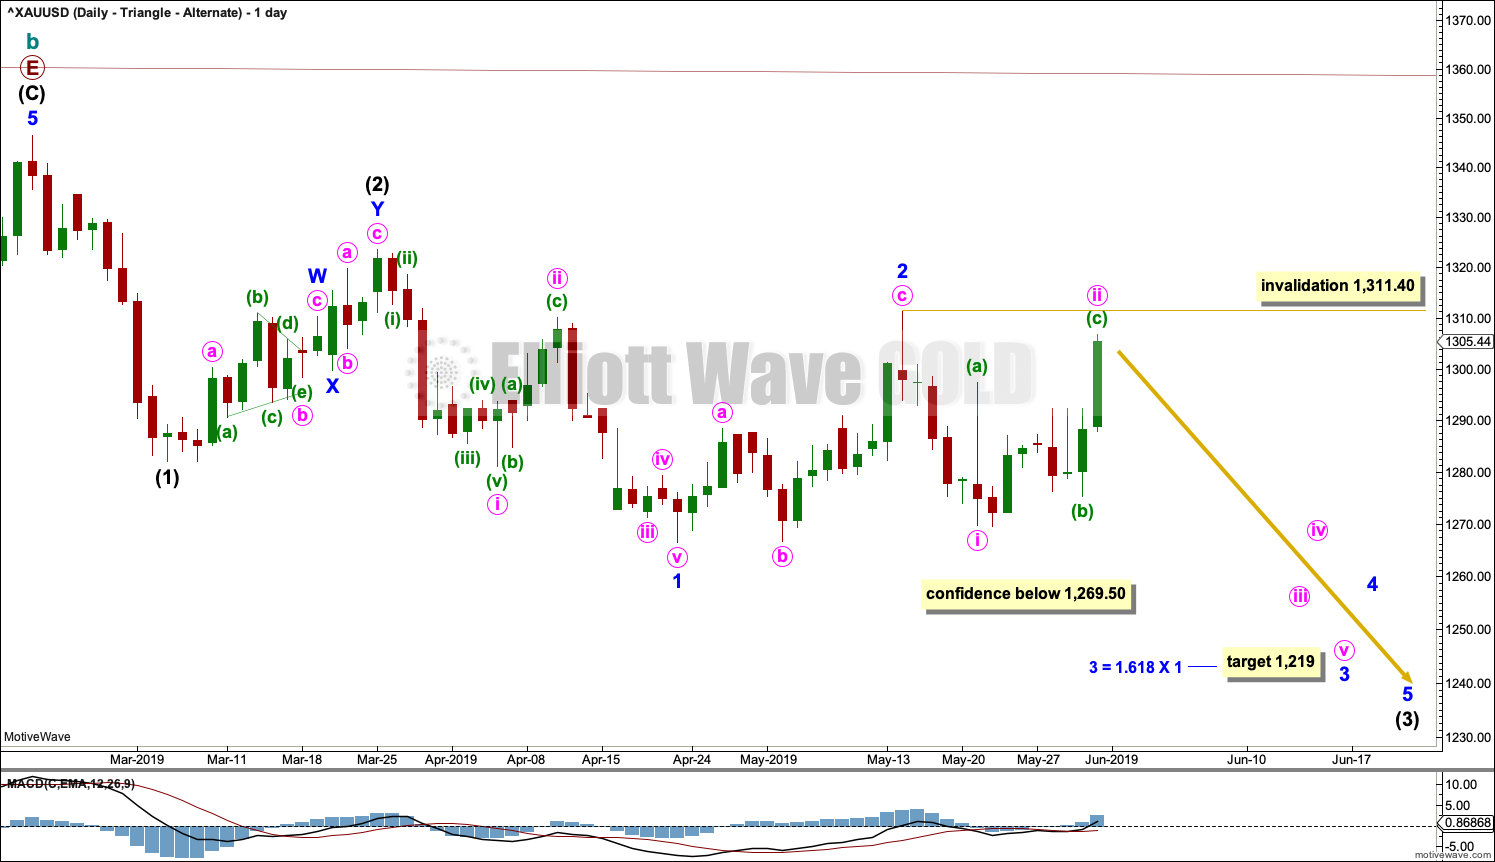
DAILY CHART – TRIANGLE
Click chart to enlarge.
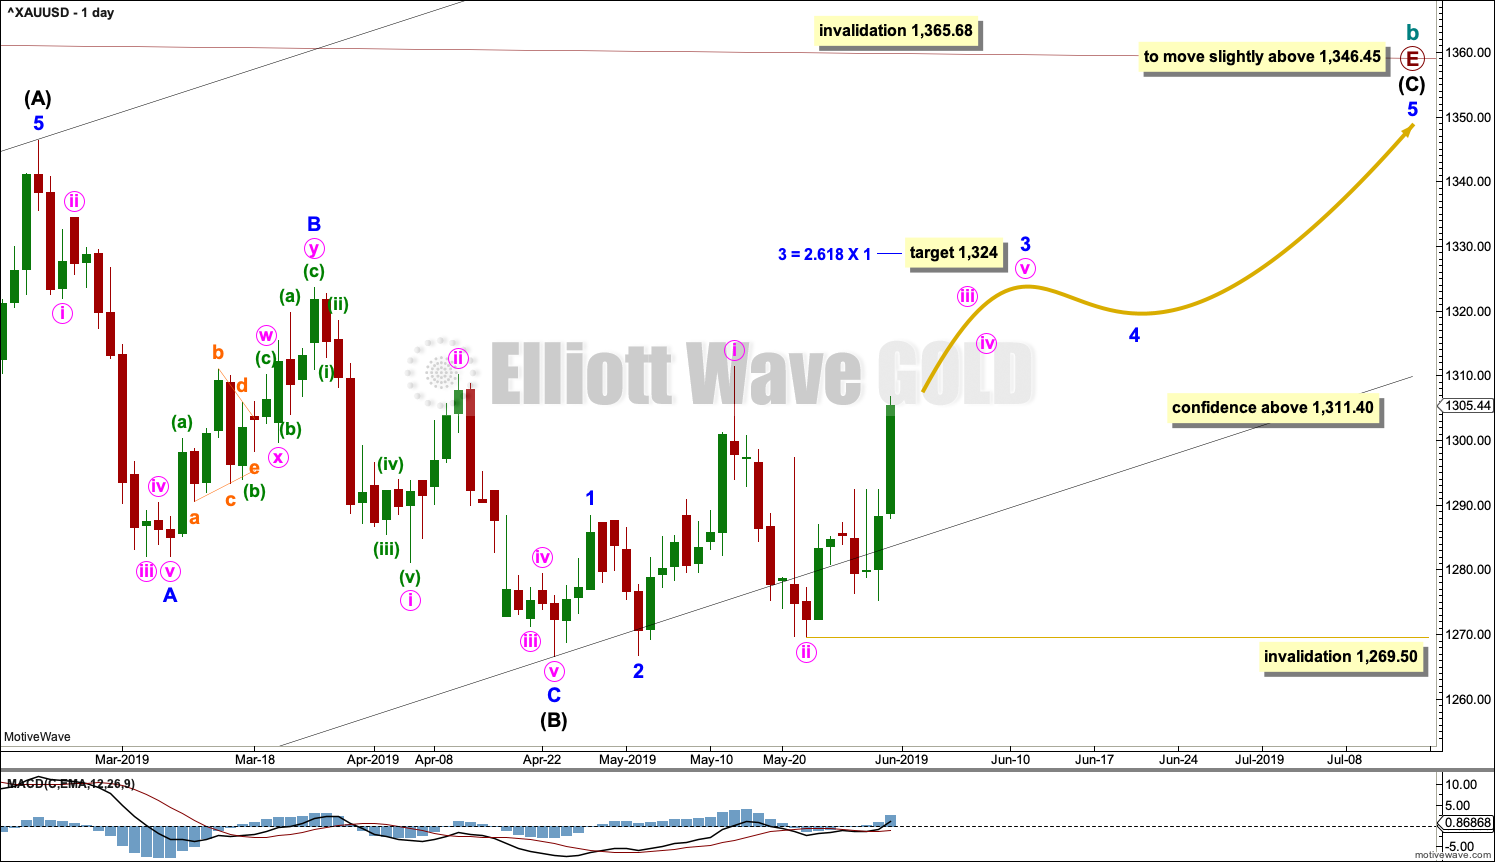
The final zigzag of primary wave E must subdivide 5-3-5. Intermediate wave (C) must subdivide as a five wave motive structure, most likely an impulse.
Within the impulse of intermediate wave (C), minor waves 1 and 2 may be complete.
Minor wave 3 may only subdivide as an impulse. A target is calculated for it to end.
Within minor wave 3, minute waves i and ii may be complete. Minute wave ii has breached the black Elliott channel. This does not have a normal look and is a concern for this wave count. However, strong upwards movement now looks like the middle of a third wave and this wave count now looks more likely.
Momentum may show a further increase as minor wave 3 comes to an end. It is possible it may end with a blow off top.
Within minute wave iii, no second wave correction may move beyond the start of its first wave below 1,269.50.
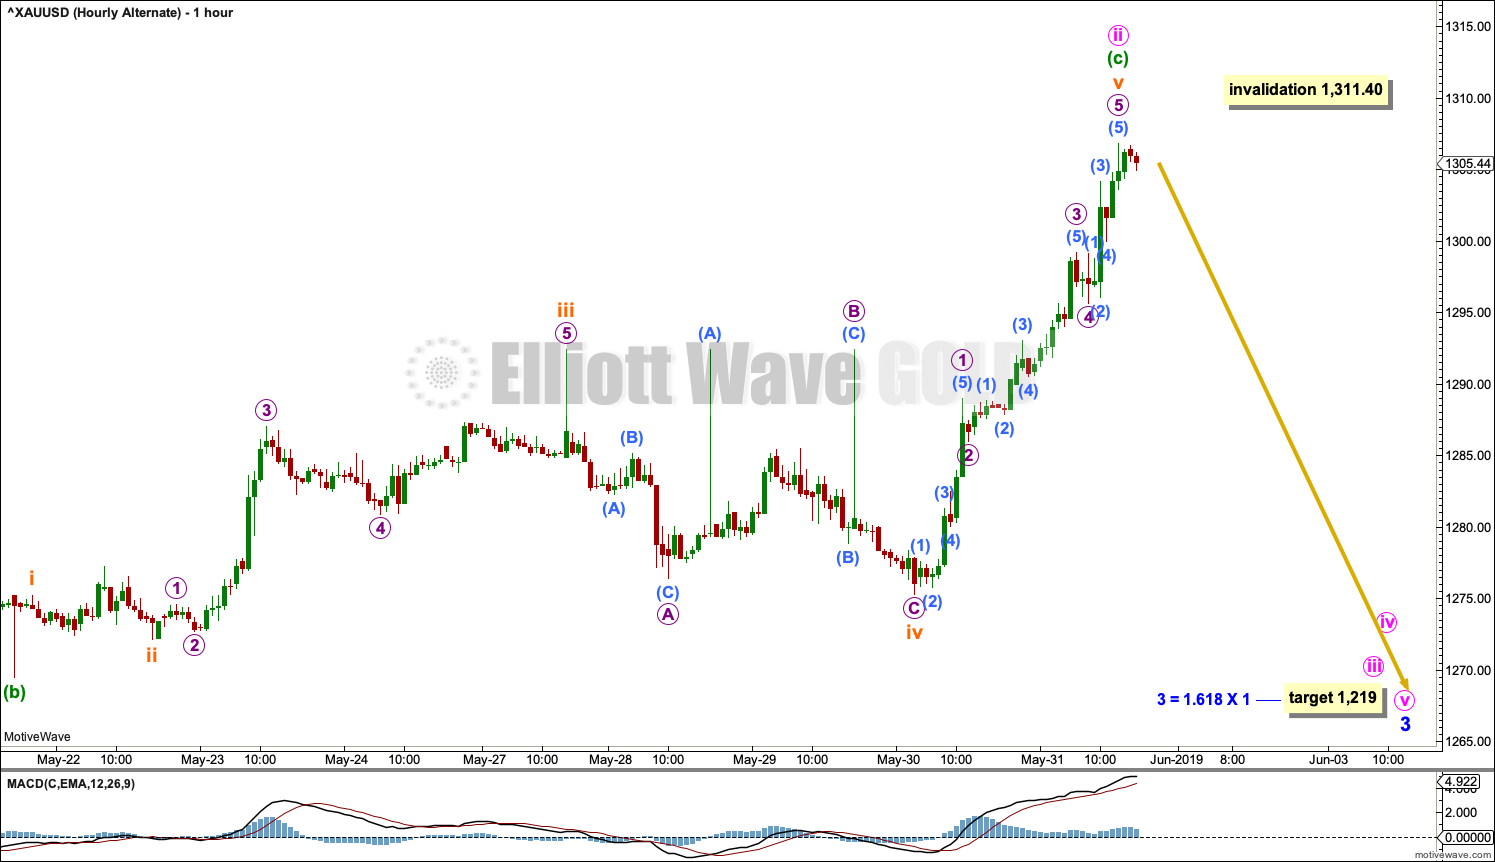
HOURLY CHART – TRIANGLE
Click chart to enlarge.
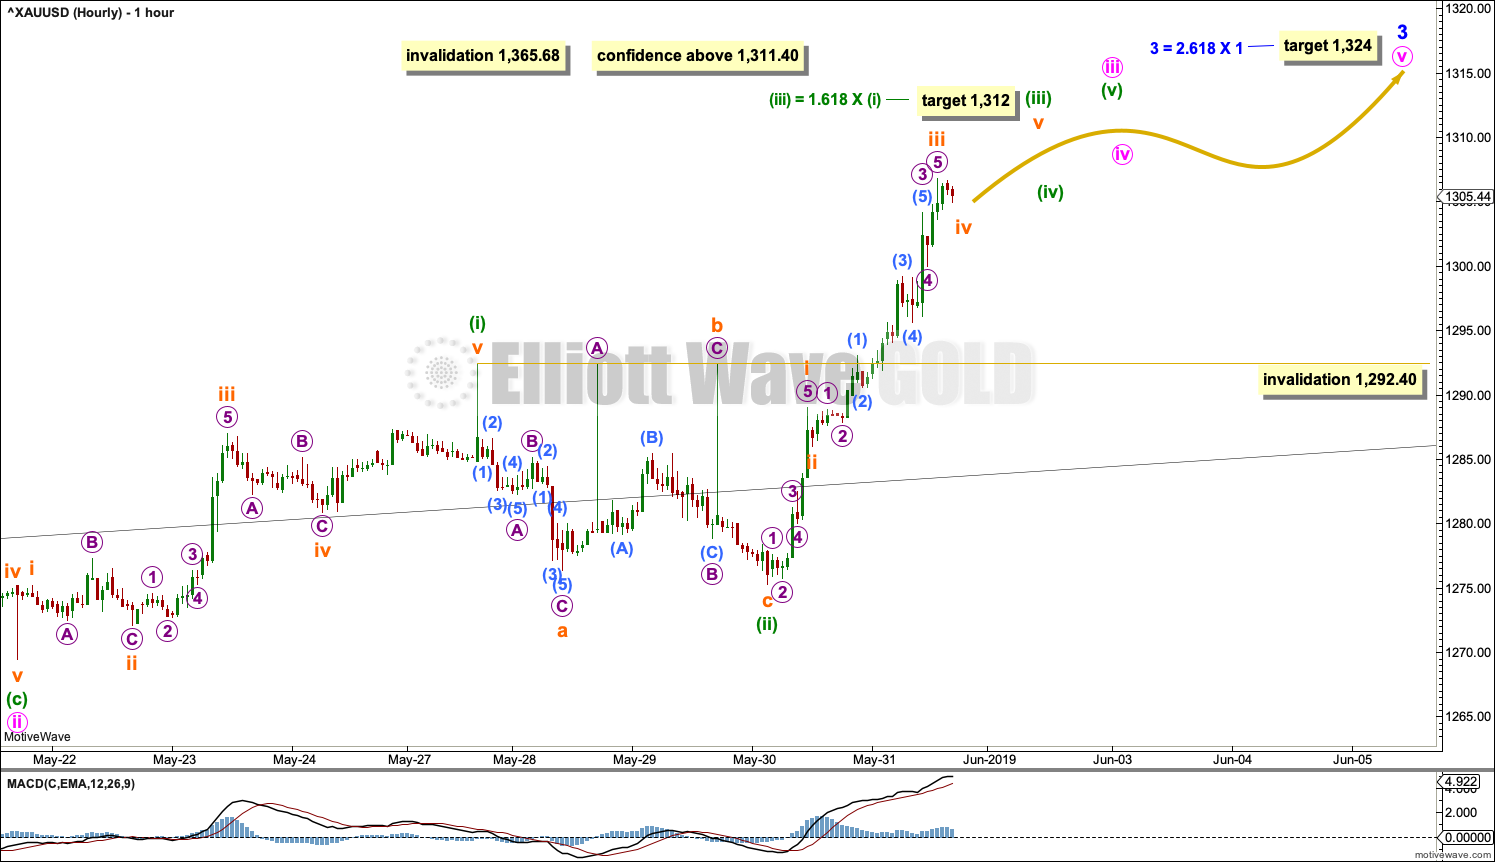
Minute wave iii may only subdivide as an impulse. So far within it minuette wave (i) may be complete.
Minuette wave (iii) has now moved beyond the end of minuette wave (i) meeting a core Elliott wave rule. When it is complete, then the following correction for minuette wave (iv) may not move into minuette wave i price territory below 1,292.40.
WEEKLY CHART – TRIANGLE – ALTERNATE
Click chart to enlarge.
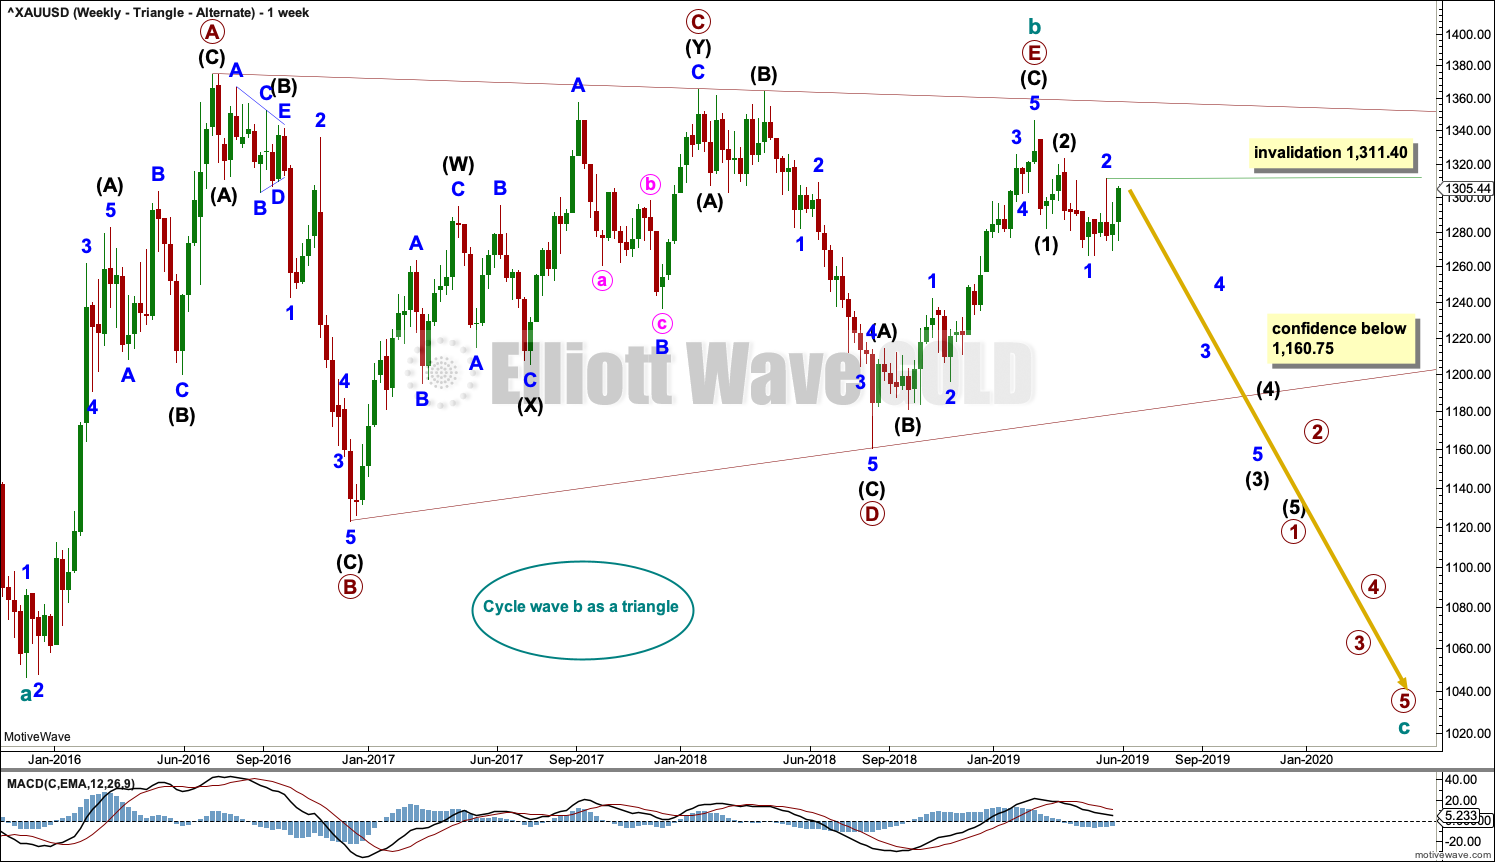
It remains possible that the triangle of cycle wave b is complete and cycle wave c downwards has begun.
Within the final wave of the triangle, primary wave E may be a complete zigzag.
Cycle wave c must subdivide as a five wave structure at primary degree, with primary waves 1, 2, 3, 4 and 5. So far primary wave 1 for this wave count would be incomplete.
Primary wave 1 must subdivide as a five wave structure at intermediate degree. So far intermediate waves (1) and (2) may be complete.
Intermediate wave (3) may only subdivide as a five wave impulse at minor degree. So far minor waves 1 and 2 may be complete.
Minor wave 3 may only subdivide as a five wave impulse at minute degree. Within minor wave 3, minute wave ii may not move beyond the start of minute wave i above 1,311.40.
DAILY CHART – TRIANGLE
Click chart to enlarge.
A target is calculated for minor wave 3 to end based upon the most common Fibonacci ratio to minor wave 1.
Gold usually begins new trends slowly with deep and time consuming second wave corrections. The trend usually accelerates through the middle of the third wave and may exhibit explosive movement at the end of third waves.
This wave count requires a new low below 1,269.50 for confidence.
This wave count now expects to see a strong increase in downwards momentum. After Friday’s upwards breakout, this now looks unlikely.
HOURLY CHART
Click chart to enlarge.
Upwards movement for Friday may possibly have been the end of minute wave ii. If it continues any higher, it may not move beyond the start of minute wave i above 1,311.40.
This wave count now expects a third wave down at three degrees to begin on Monday.
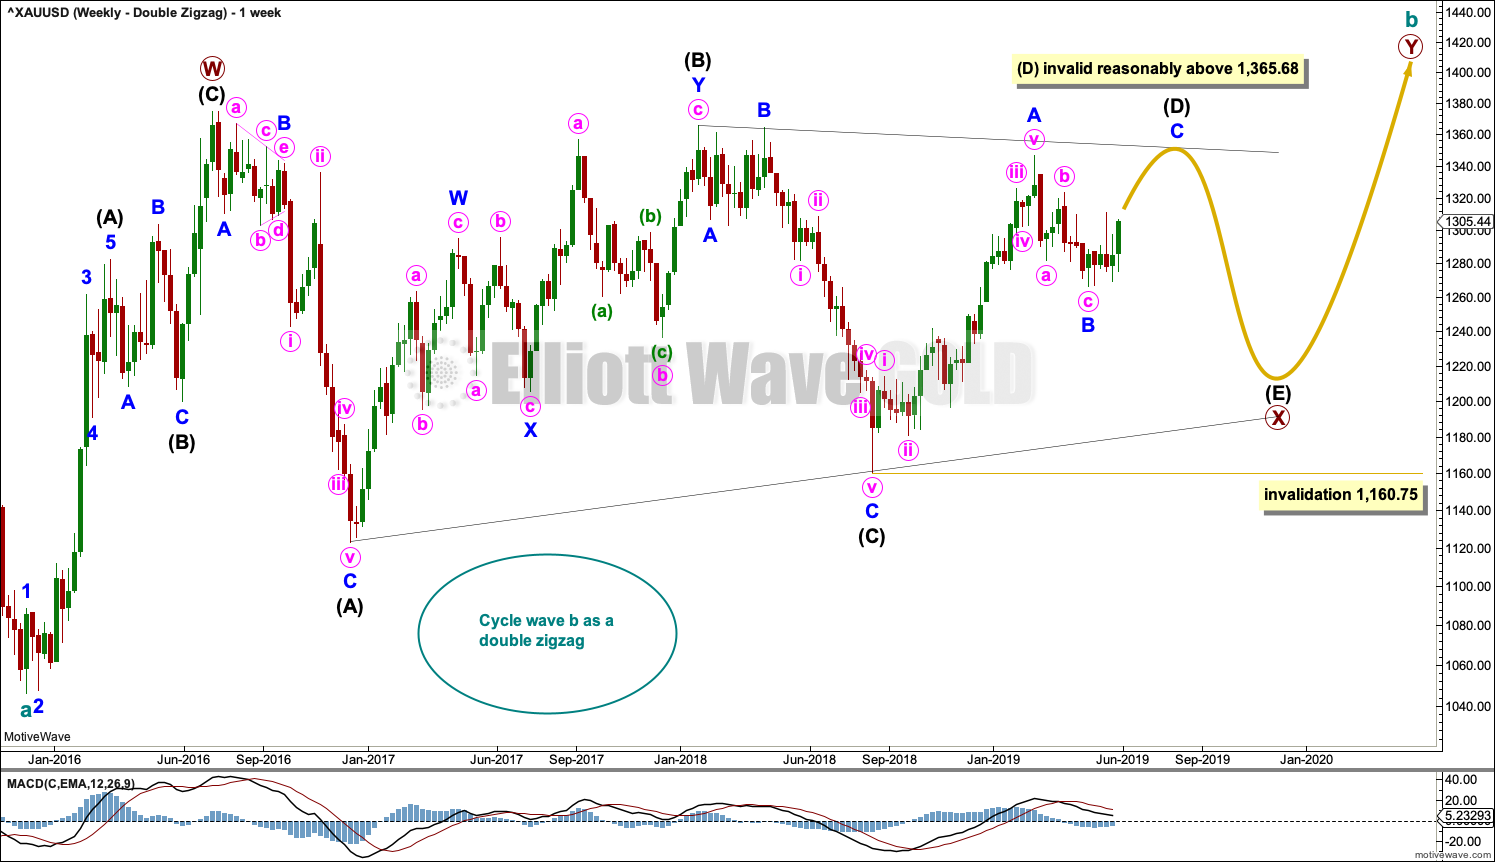
WEEKLY CHART – DOUBLE ZIGZAG
Click chart to enlarge.
This wave count is identical to the first weekly chart up to the low labelled cycle wave a. Thereafter, a different Elliott wave corrective structure is considered for cycle wave b.
It is possible that cycle wave b may be an incomplete double zigzag or a double combination.
The first zigzag in the double is labelled primary wave W. This has a good fit.
The double may be joined by a corrective structure in the opposite direction, a triangle labelled primary wave X. The triangle may be incomplete.
Within multiples, X waves are almost always zigzags and rarely triangles. Within the possible triangle of primary wave X, it is intermediate wave (B) that is a multiple; this is acceptable, but note this is not the most common triangle sub-wave to subdivide as a multiple. These two points reduce the probability of this wave count in terms of Elliott wave.
Intermediate wave (D) of a contracting triangle may not move beyond the end of intermediate wave (B) above 1,365.68.
Intermediate wave (D) of a barrier triangle may end about the same level as intermediate wave (B); as long as the (B)-(D) trend line remains essentially flat the triangle will remain valid. This is the only Elliott wave rule that is not black and white. In practice, intermediate wave (D) may end slightly above intermediate wave (B) at 1,365.68 and this wave count would remain valid.
Primary wave Y would most likely be a zigzag because primary wave X would be shallow; double zigzags normally have relatively shallow X waves.
Primary wave Y may also be a flat correction if cycle wave b is a double combination, but combinations normally have deep X waves. This would be less likely.
This wave count has good proportions and no problems in terms of subdivisions.
ALTERNATE ELLIOTT WAVE COUNT
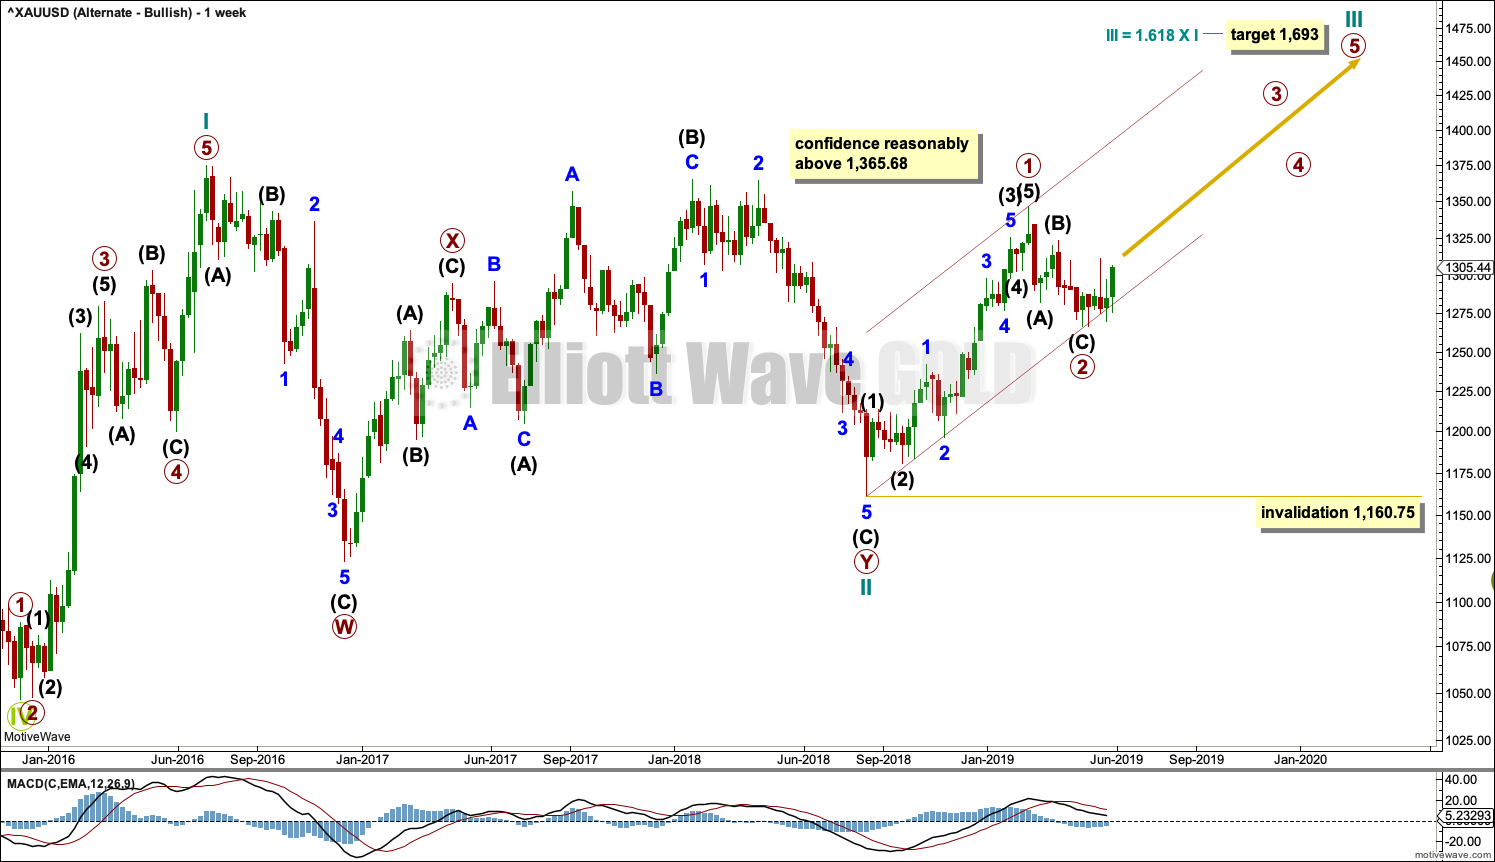
WEEKLY CHART
Click chart to enlarge.
This wave count sees the three waves back now complete at the last major low for Gold in November 2019.
If Gold is in a new bull market, then it should begin with a five wave structure upwards on the weekly chart. However, the biggest problem with this wave count is the structure labelled cycle wave I because this wave count must see it as a five wave structure, but it looks more like a three wave structure.
Commodities often exhibit swift strong fifth waves that force the fourth wave corrections coming just prior and just after to be more brief and shallow than their counterpart second waves. It is unusual for a commodity to exhibit a quick second wave and a more time consuming fourth wave, and this is how cycle wave I is labelled. The probability of this wave count is low due to this problem.
Cycle wave II subdivides well as a double combination: zigzag – X – expanded flat.
Cycle wave III may have begun. Within cycle wave III, primary waves 1 and 2 may now be complete. If it continues lower as a double zigzag, then primary wave 2 may not move beyond the start of primary wave 1 below 1,160.75.
Cycle wave III so far for this wave count would have been underway now for 41 weeks. It should be beginning to exhibit some support from volume, increase in upwards momentum and increasing ATR. However, ATR continues to decline and is very low, and momentum is weak in comparison to cycle wave I. This wave count lacks support from classic technical analysis.
TECHNICAL ANALYSIS
WEEKLY CHART
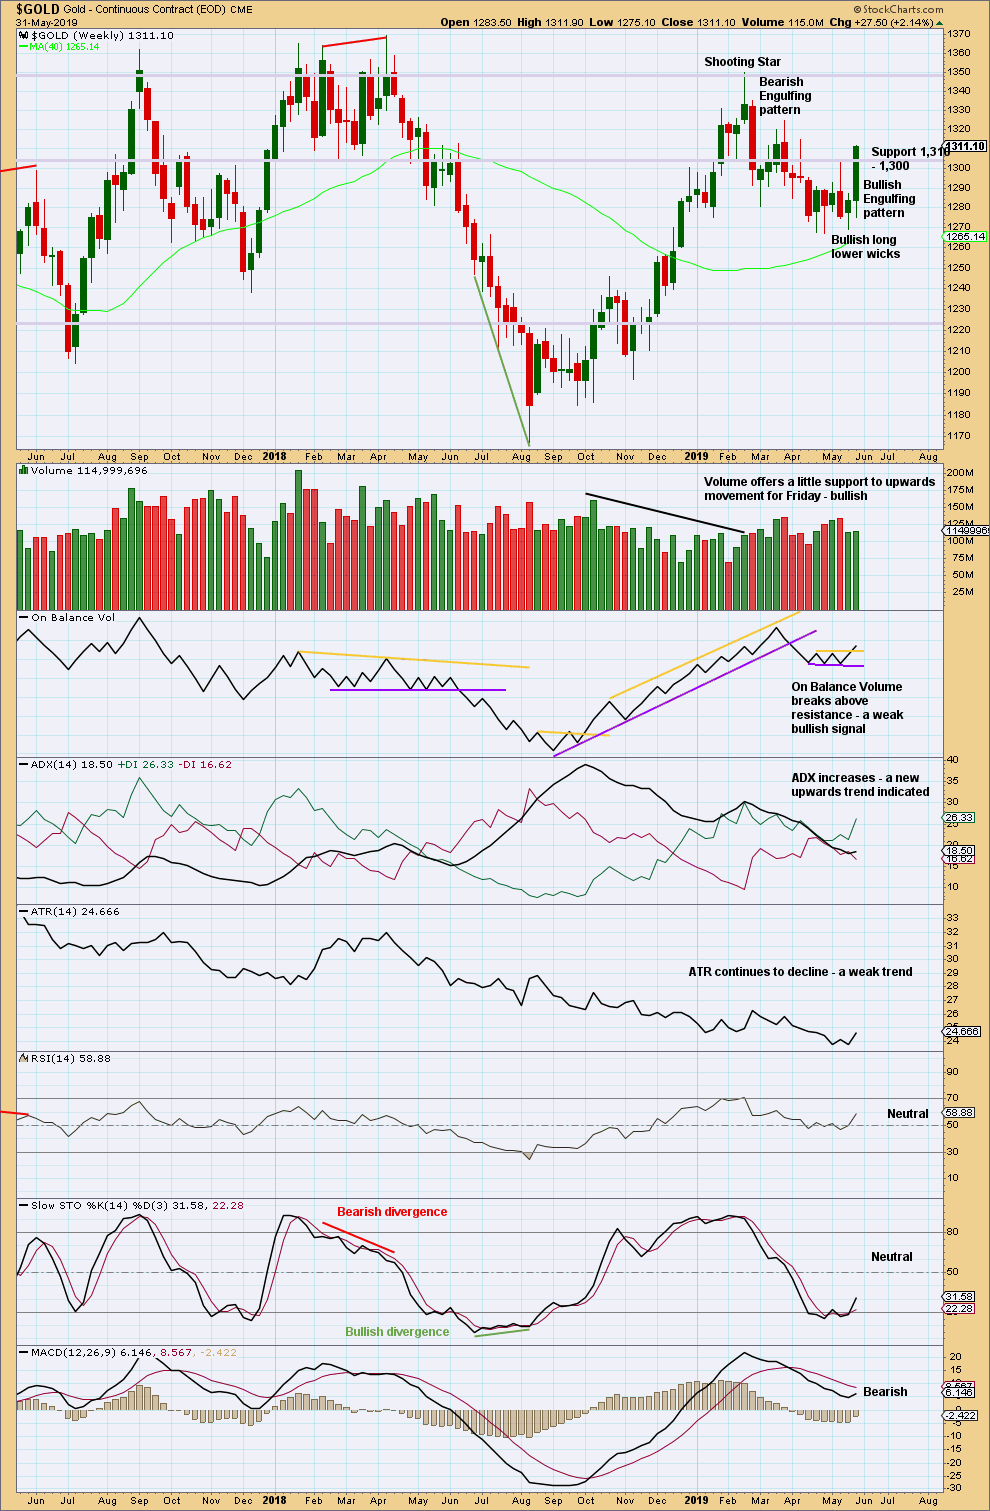
Click chart to enlarge. Chart courtesy of StockCharts.com.
A very strong upwards week with a long lower wick, support from volume and an almost shaven head looks bullish. More upwards movement looks extremely likely next week.
Overall, low and flat to declining ATR now supports both the main Elliott wave count and the double zigzag Elliott wave count.
DAILY CHART
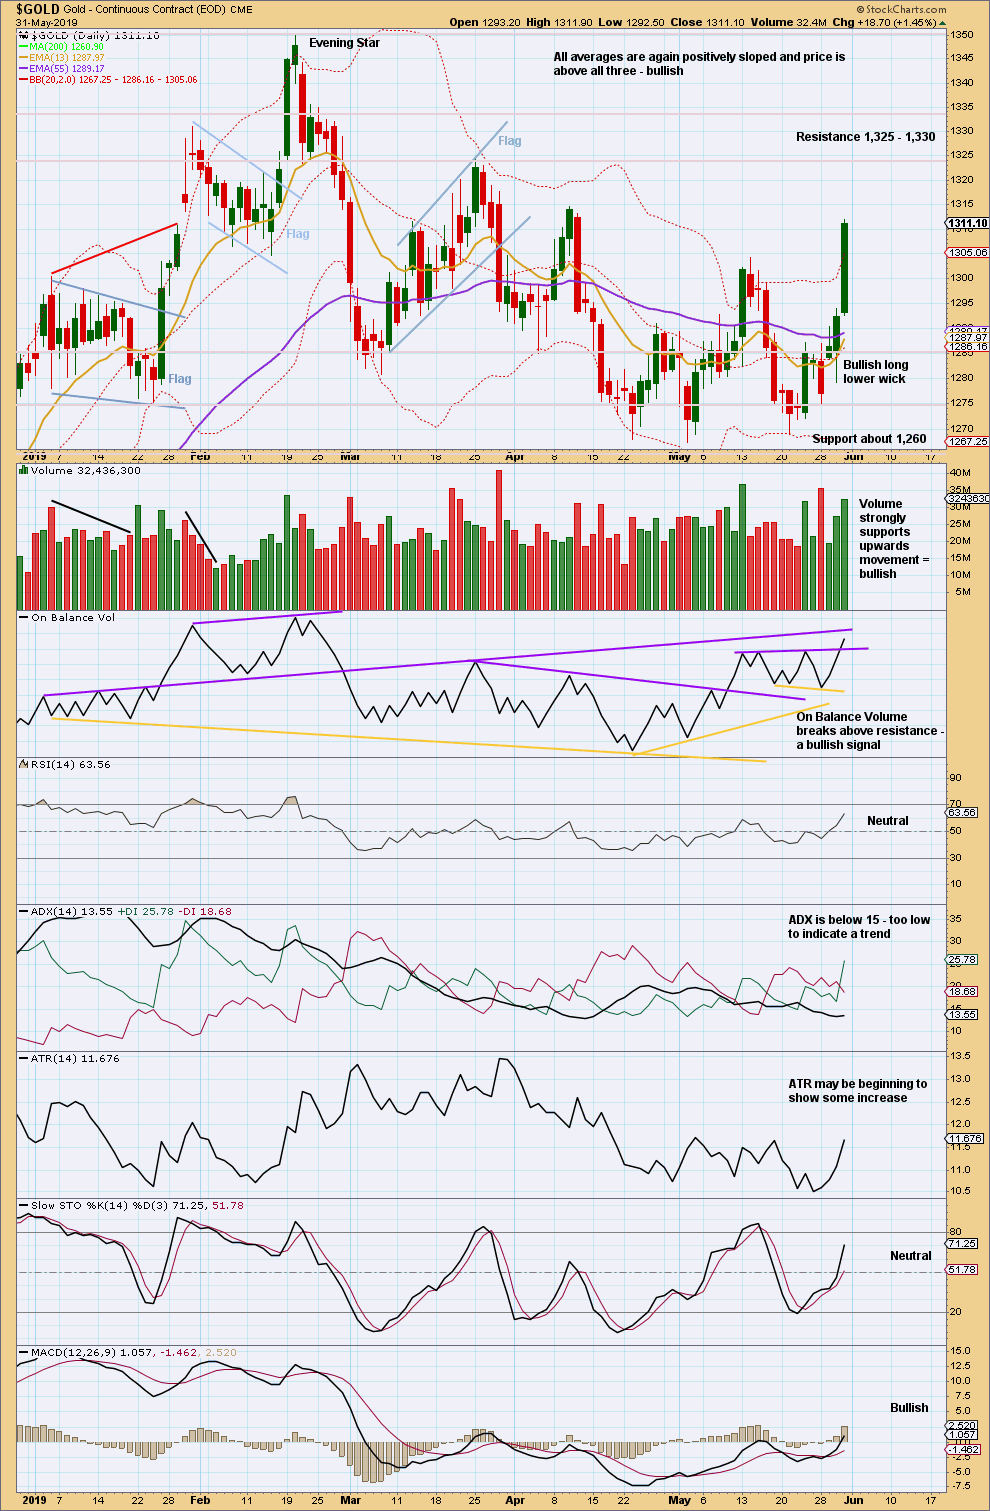
Click chart to enlarge. Chart courtesy of StockCharts.com.
A new swing high above the 14th of May now indicates a potential new upwards trend. ADX does not yet agree, but if it rises to 15 or above, it would then indicate a new upwards trend in the early stages.
A now bullish volume profile and an almost shaven head for Friday’s candlestick strongly suggests more upwards movement next week.
GDX WEEKLY CHART
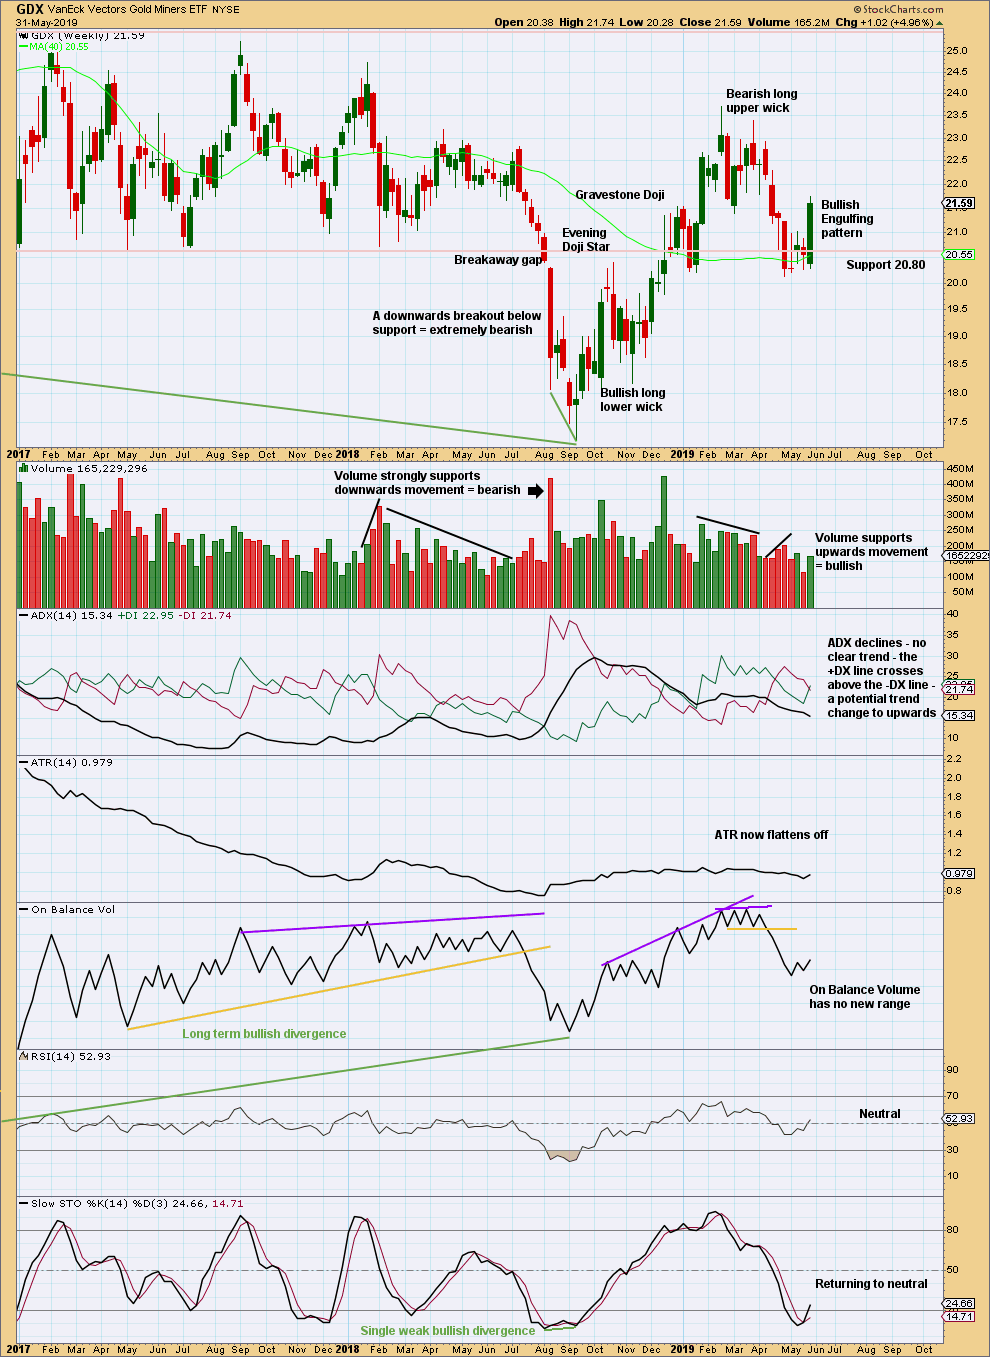
Click chart to enlarge. Chart courtesy of StockCharts.com.
A very strong Bullish Engulfing candlestick pattern, which has support from volume, strongly suggests more upwards movement next week.
GDX DAILY CHART
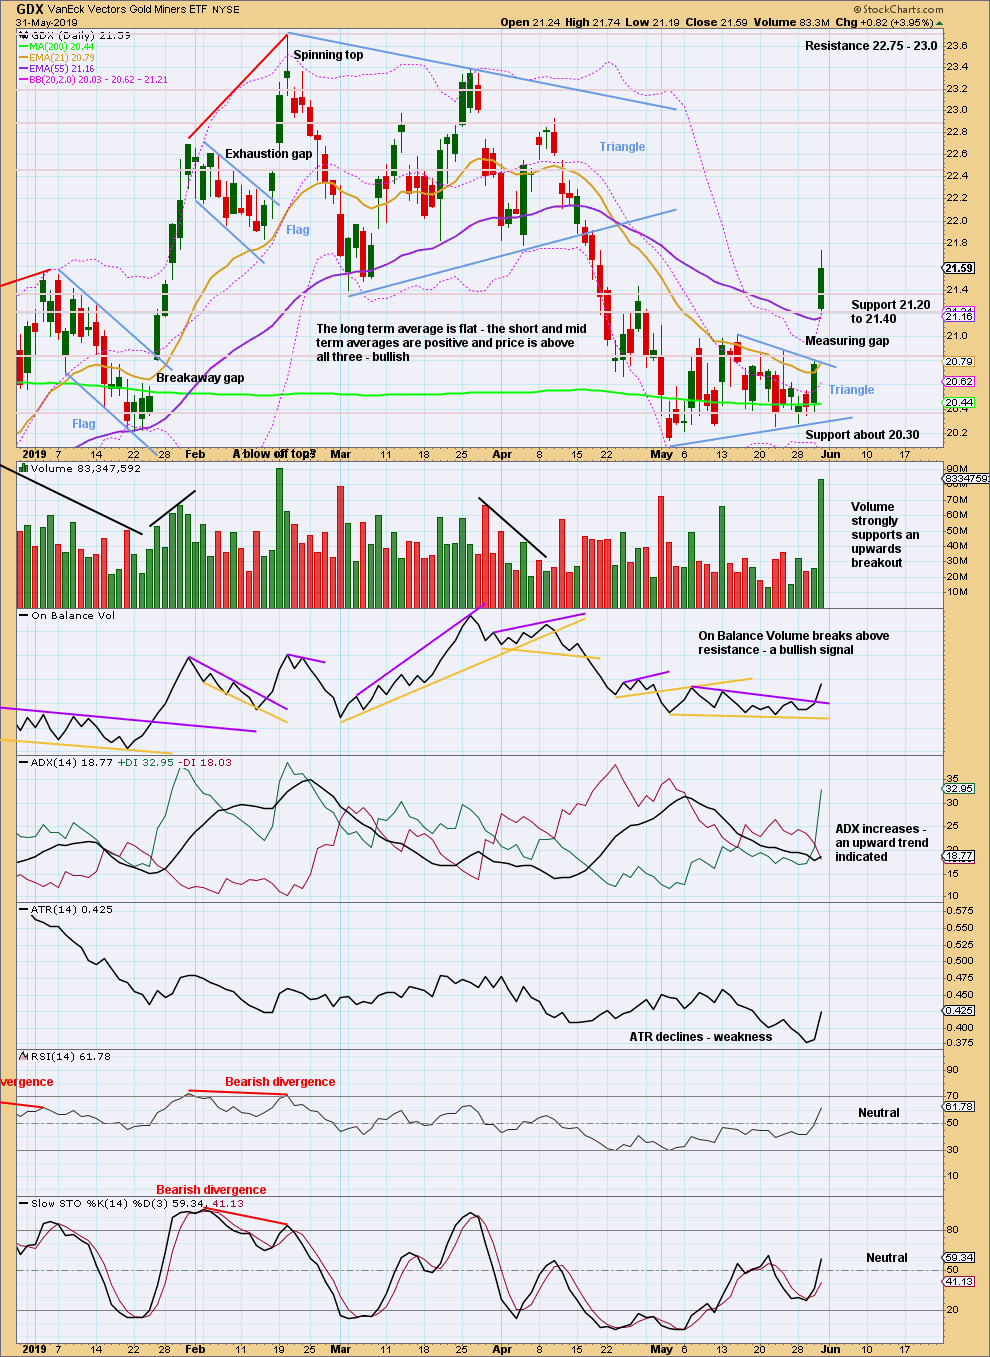
Click chart to enlarge. Chart courtesy of StockCharts.com.
Price has broken out of the triangle upwards. A target calculated using the triangle width is about 21.68, but this has already been met and passed.
A target calculated using the measuring gap is about 21.72, but this too has been met and slightly passed.
The measuring gap may now provide support. It may remain open at 20.81.
Friday looks like a possible blow off top. These are usually followed by some consolidation or a trend change. Here, a consolidation before more upwards movement looks fairly likely.
Published @ 12:51 p.m. EST on June 1, 2019.
—
Careful risk management protects your trading account(s).
Follow my two Golden Rules:
1. Always trade with stops.
2. Risk only 1-5% of equity on any one trade.
—
New updates to this analysis are in bold.
Lara, does this weekly b cycle count (triangle or double zig-zag) still fit in your monthly main count? B/C the main monthly is showing cycle b complete, and the only incomplete is a grand super cycle 5th wave uptrend. Can you clarify for me? Thank you.
Third waves may end with blow off tops (bull market) and so this may be what is happening today.
Look out for minor wave 4 to be relatively brief and shallow. The structure for intermediate wave (C) remains incomplete, and it needs to move above intermediate (A) to avoid a truncation. So the upwards movement is not yet done for this wave count.
The alternate is invalidated.
Hourly chart updated:
If I’m wrong it is in anticipating minor 4 to arrive sooner than it may do so.
The trend is up. The trend is your friend. The structure is incomplete.
Hello Lara, is this possible:
DAILY CHART – TRIANGLE – ALTERNATE
If the blue 2 is only A of 2 (abc staying the same), the upward breakout could be C of 2,
giving an invalidation of 1324 instead of 1311.
regards Juergen
Yes, that is possible.
It doesn’t look very good though, because then minor 2 would be at its termination much longer in duration than intermediate (2) one degree higher. Now, that doesn’t invalidate the idea, it just means it doesn’t have the right look.
I can handle some disproportion with a lower degree correction being more time consuming than corrections of higher degrees, but in this case the difference would be quite big.
And now it’s not possible after today.