
A new high above 1,346.45 was expected for the main Elliott wave count, although some further consolidation was expected first.
Summary: This upwards trend is expected to end above 1,346.45 but not above 1,365.68. Along the way up, one more small multi day consolidation or shallow pullback for a fourth wave may have again just begun.
Grand SuperCycle analysis is here.
Last monthly charts are here. Video is here.
MAIN ELLIOTT WAVE COUNT
WEEKLY CHART – TRIANGLE
Click chart to enlarge.
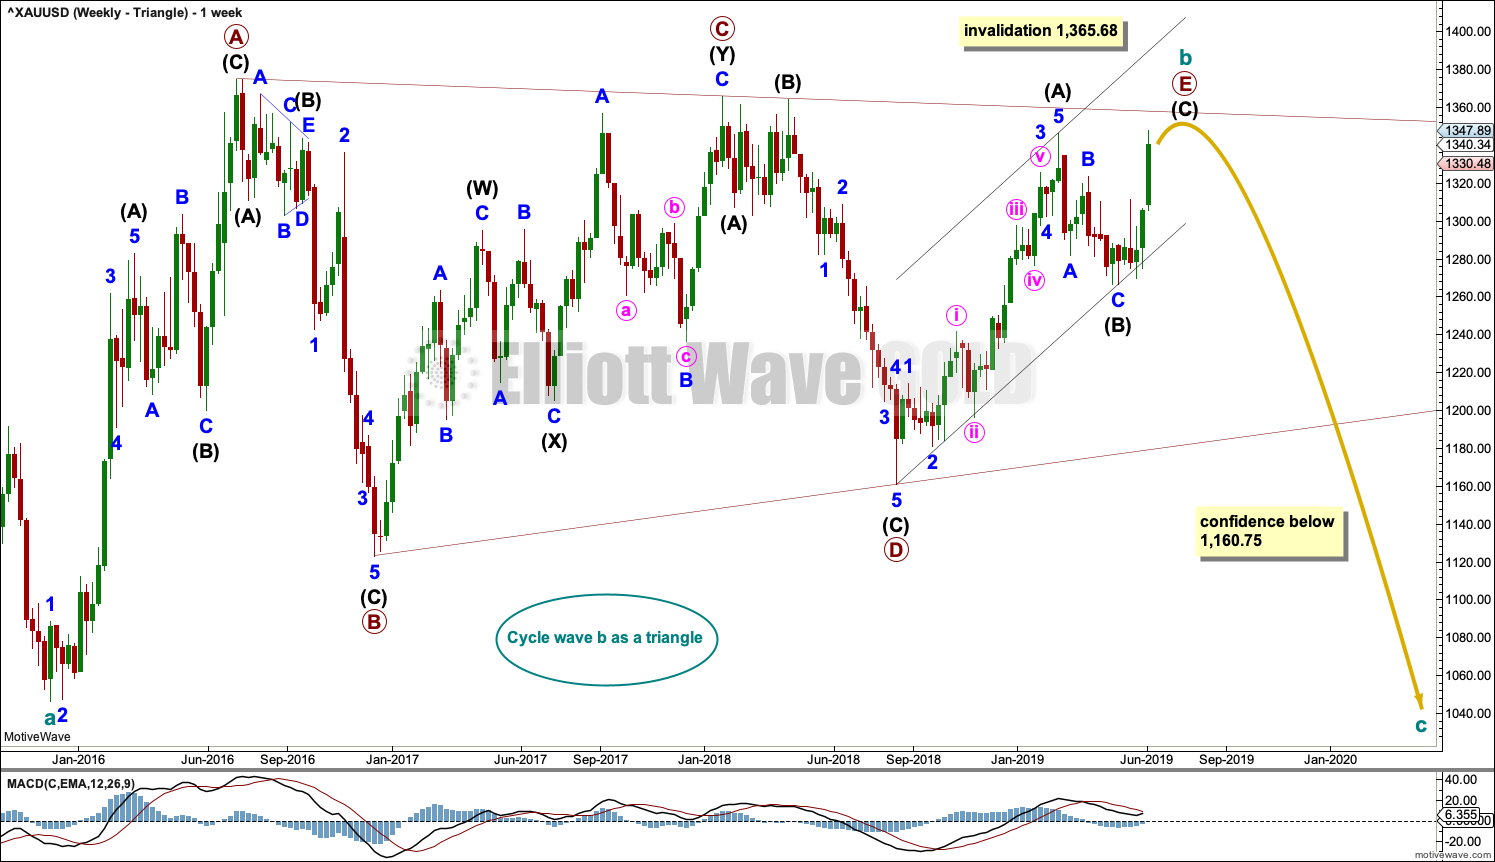
The basic Elliott wave structure is five waves up followed by three waves back (in a bull market). At this time, the preferred Elliott wave count sees Gold as still within three waves back, which began at the all time high in September 2011.
Five waves up are labelled 1,2,3,4,5. Three waves back are labelled A,B,C.
This wave count sees Gold as now about two thirds through the three waves back. The three wave structure is labelled cycle waves a, b and c.
The triangle for cycle wave b may still be incomplete. The final sub-wave of primary wave E may be an incomplete zigzag. Within the zigzag of primary wave E, intermediate wave (C) has now made a slight new high above the end of intermediate wave (A). A truncation is now avoided; intermediate wave (C) could be over here or very soon indeed.
Primary wave E may either undershoot or overshoot the A-C trend line. Primary wave E may not move beyond the end of primary wave C above 1,365.68.
Draw a channel about the zigzag of primary wave E using Elliott’s technique. Draw the first trend line from the start of intermediate wave (A) to the end of intermediate wave (B), then place a parallel copy on the end of intermediate wave (A). Now that it is possible that intermediate wave (C) may be over, a breach of the channel by downwards movement would be a strong indication that the triangle for cycle wave b is over and cycle wave c downwards may then have just begun.
DAILY CHART – TRIANGLE
Click chart to enlarge.
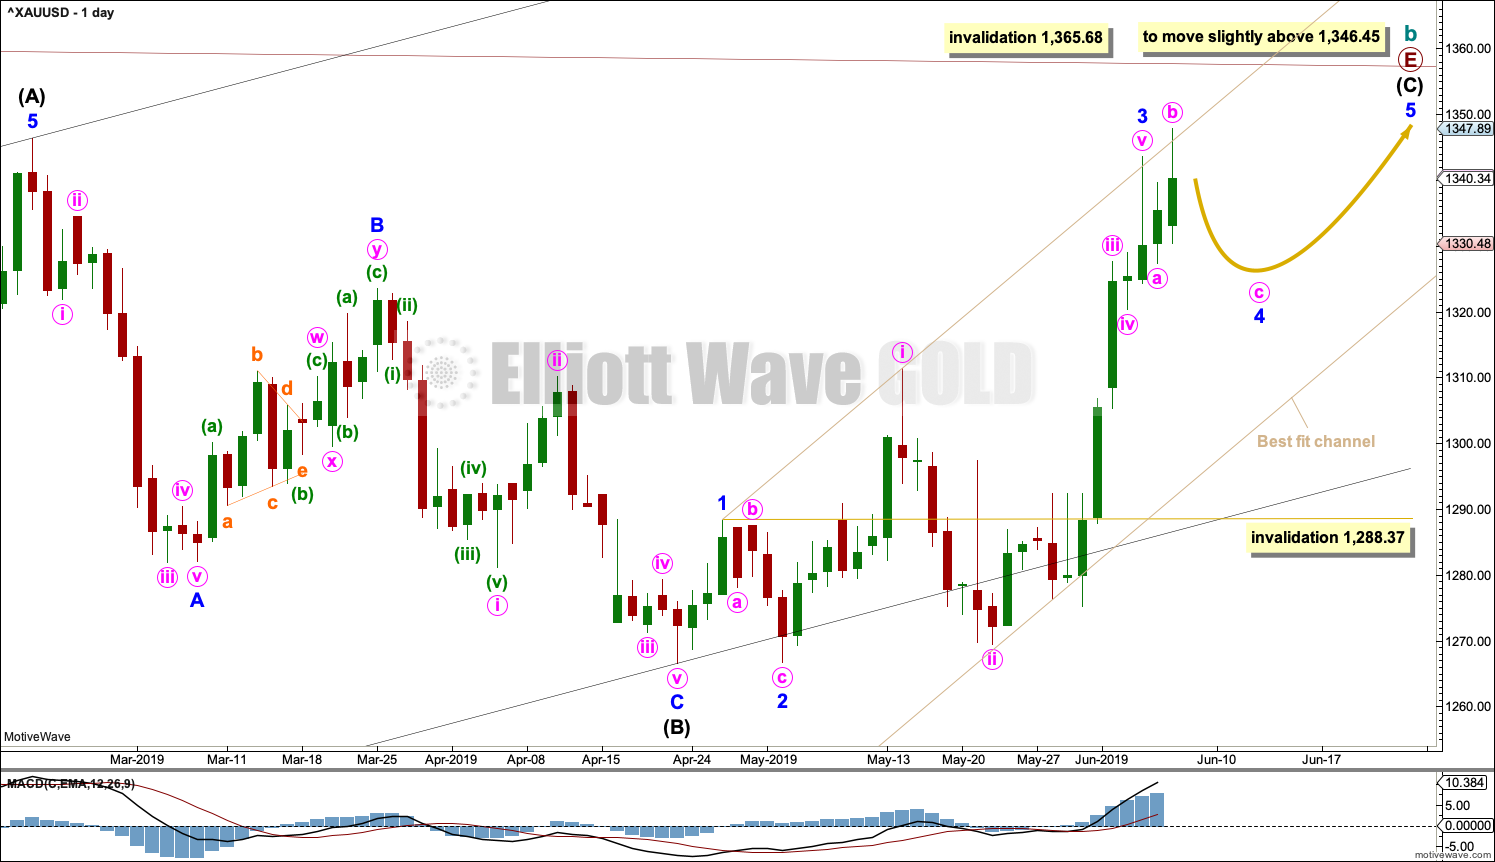
The final zigzag of primary wave E must subdivide 5-3-5. Intermediate wave (C) must subdivide as a five wave motive structure, most likely an impulse.
Within the impulse of intermediate wave (C), minor waves 1 through to 3 may be complete.
Minor wave 4 may not move into minor wave 1 price territory below 1,288.37. Minor wave 4 may be expected to very likely be relatively brief and shallow.
HOURLY CHART – TRIANGLE
Click chart to enlarge.
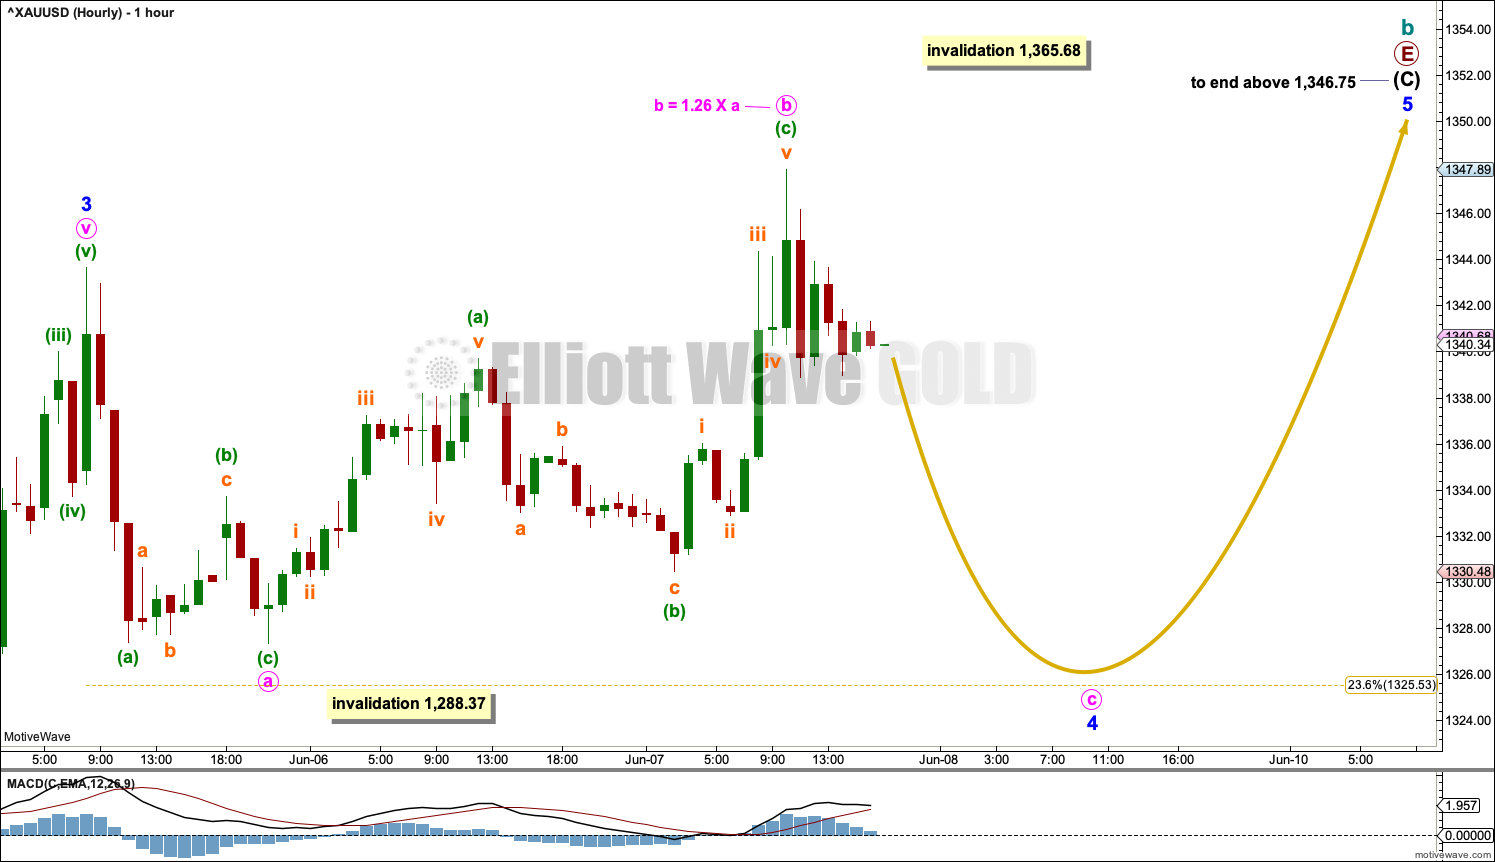
A reasonable target for minor wave 4 may be the 0.236 Fibonacci ratio of minor wave 3. Minor wave 2 lasted 4 sessions as a zigzag. Minor wave 4 may be more brief; it may last only one or two sessions. Minor wave 4 may most likely be a shallow sideways flat, combination or triangle.
It is also possible that minor wave 4 may be a little longer lasting than minor wave 2 as sideways flats, triangles and combinations tend to be longer lasting than zigzags.
Minor wave 4 may be unfolding as an expanded flat correction. Within the flat, minute wave b is between the most common range of 1 to 1.38 times the length of minute wave a. Minute wave c would be likely to make at least a slight new low below the end of minute wave a at 1,327.34 to avoid a truncation.
A short and sharp upwards breakout would be expected for minor wave 5 to follow it. Now that minor wave 3 does not exhibit a Fibonacci ratio to minor wave 1, minor wave 5 would be fairly likely to exhibit a Fibonacci ratio to minor waves 1 or 3, and the most likely ratio would be equality in length with minor wave 1 at $21.76.
DAILY CHART – TRIANGLE – ALTERNATE
Click chart to enlarge.
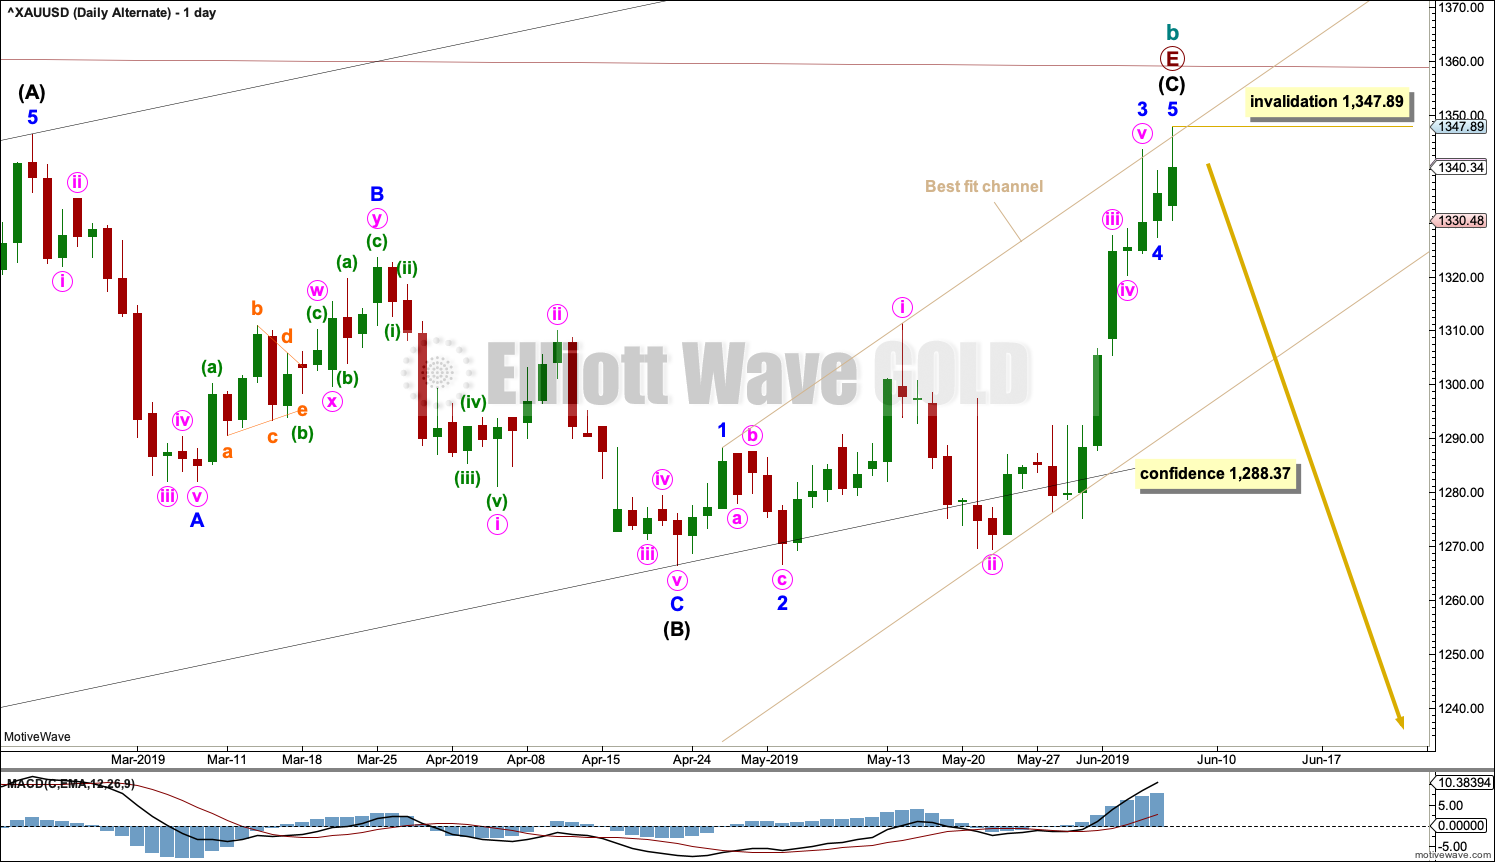
It is also possible that intermediate wave (C) may be complete in its entirety. Minor wave 4 may have been very brief as was minute wave iv. This follows a common pattern for Gold.
Reasonable confidence that a high is in place would come with a breach of the taupe best fit channel. Thereafter, strong confidence would come with a breach of the black Elliott channel.
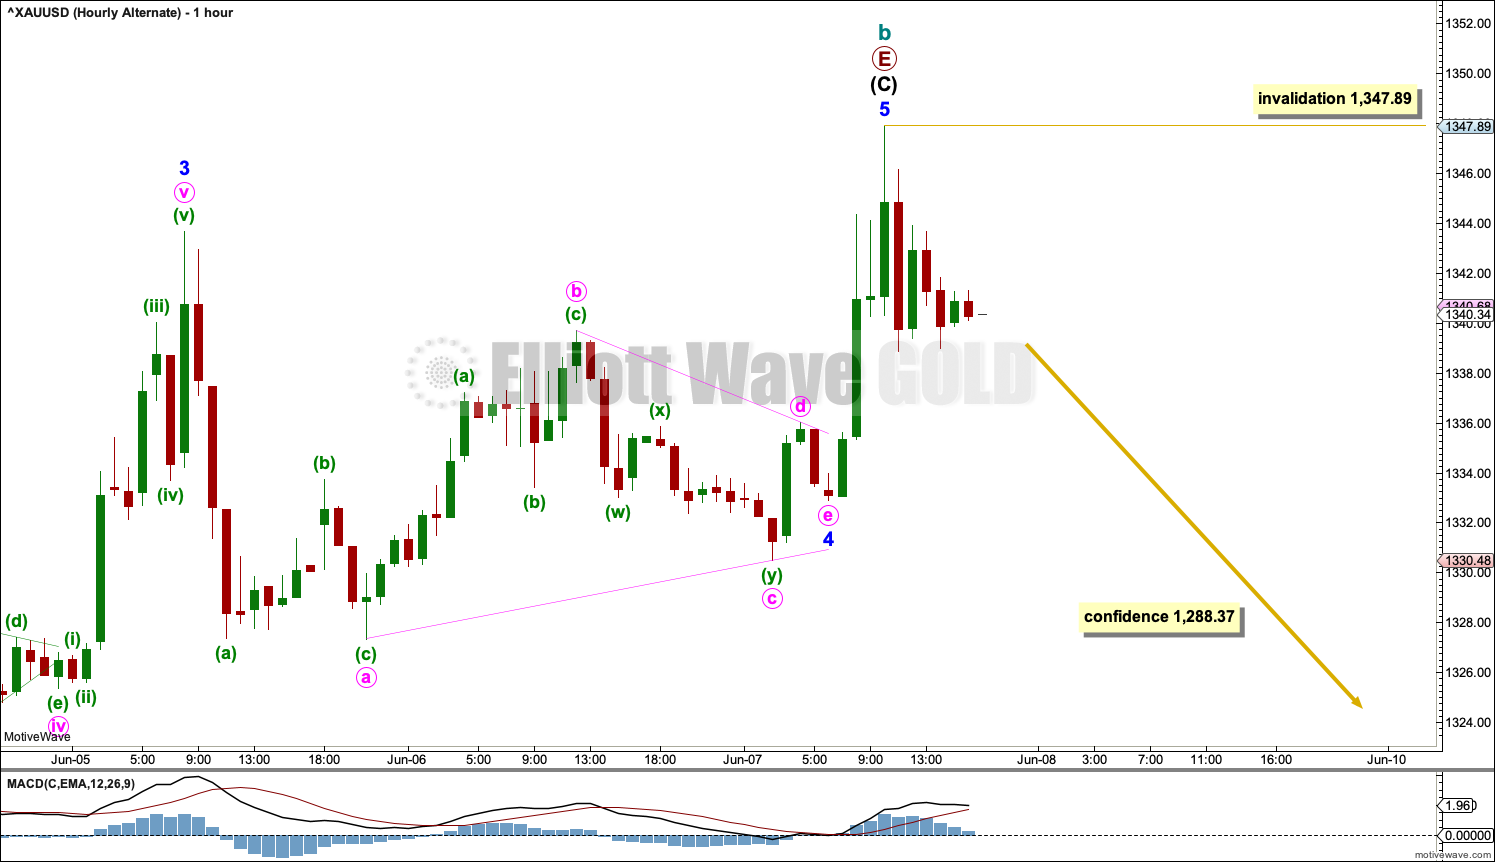
HOURLY CHART – TRIANGLE – ALTERNATE
Click chart to enlarge.
Minor wave 4 fits well as a regular contracting triangle. However, minute waves d and e with the triangle look to be too brief for a normal look. Elliott wave triangles do not normally come to such a quick conclusion.
If there has been a trend change at cycle degree on Friday, then within the new downwards trend no second wave may move beyond the start of its first wave above 1,347.89.
WEEKLY CHART – DOUBLE ZIGZAG
Click chart to enlarge.
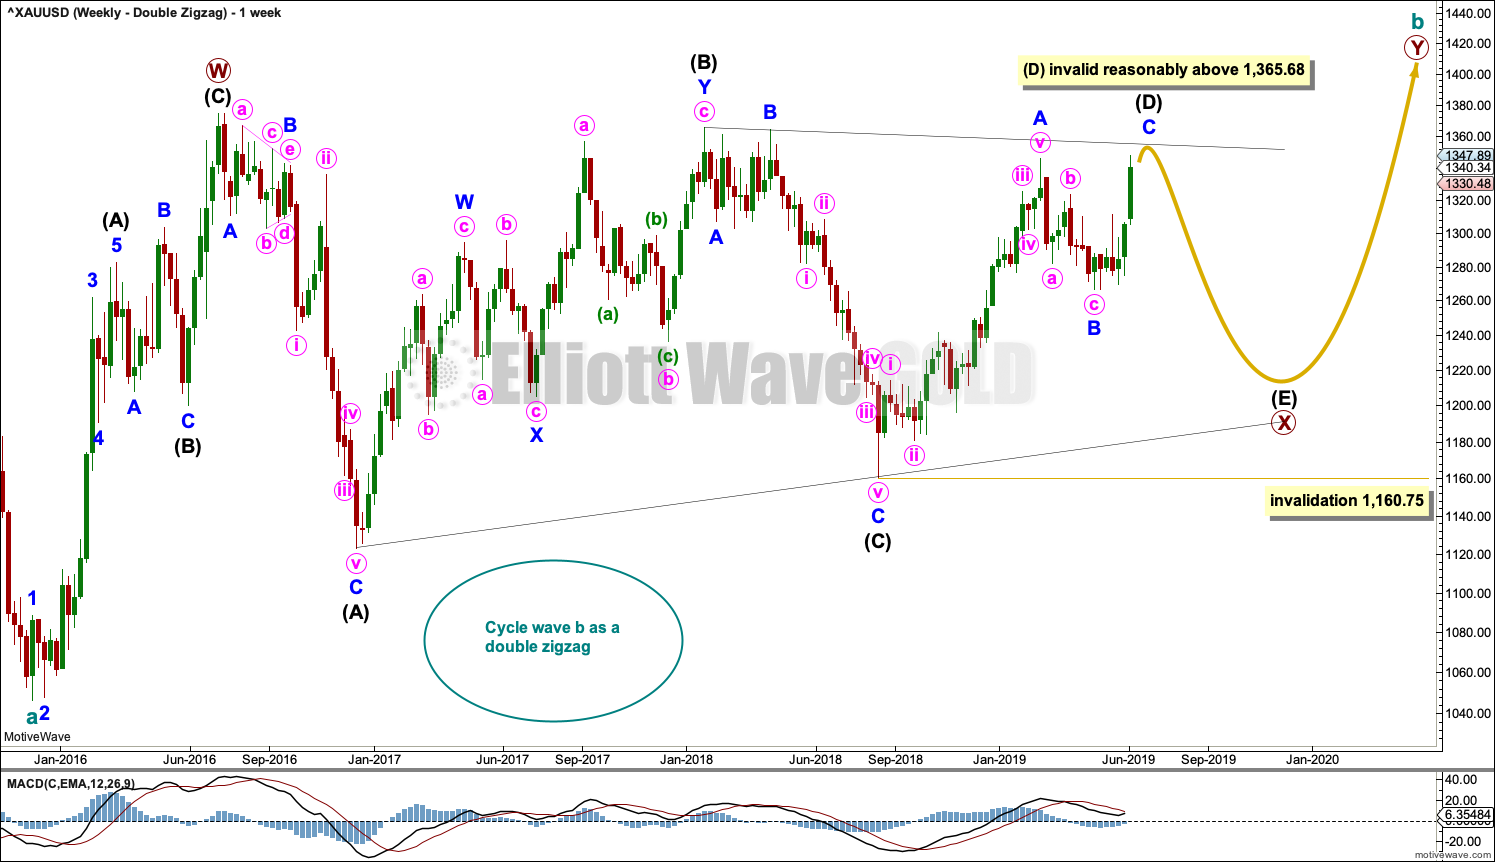
This wave count is identical to the first weekly chart up to the low labelled cycle wave a. Thereafter, a different Elliott wave corrective structure is considered for cycle wave b.
It is possible that cycle wave b may be an incomplete double zigzag or a double combination.
The first zigzag in the double is labelled primary wave W. This has a good fit.
The double may be joined by a corrective structure in the opposite direction, a triangle labelled primary wave X. The triangle may be incomplete.
Within multiples, X waves are almost always zigzags and rarely triangles. Within the possible triangle of primary wave X, it is intermediate wave (B) that is a multiple; this is acceptable, but note this is not the most common triangle sub-wave to subdivide as a multiple. These two points reduce the probability of this wave count in terms of Elliott wave.
Intermediate wave (D) of a contracting triangle may not move beyond the end of intermediate wave (B) above 1,365.68.
Intermediate wave (D) of a barrier triangle may end about the same level as intermediate wave (B); as long as the (B)-(D) trend line remains essentially flat the triangle will remain valid. This is the only Elliott wave rule that is not black and white. In practice, intermediate wave (D) may end slightly above intermediate wave (B) at 1,365.68 and this wave count would remain valid. The (B)-(D) trend line is carefully laid to sit across the end of intermediate wave (B) and minor wave B within intermediate wave (C). This may show exactly where intermediate wave (D) ends if this wave count is correct. This wave count would expect just a little more upwards movement next week so that the (B)-(D) trend line sits as shown with no to little overshoots.
Primary wave Y would most likely be a zigzag because primary wave X would be shallow; double zigzags normally have relatively shallow X waves.
Primary wave Y may also be a flat correction if cycle wave b is a double combination, but combinations normally have deep X waves. This would be less likely.
This wave count has good proportions and no problems in terms of subdivisions.
ALTERNATE ELLIOTT WAVE COUNT
WEEKLY CHART
Click chart to enlarge.
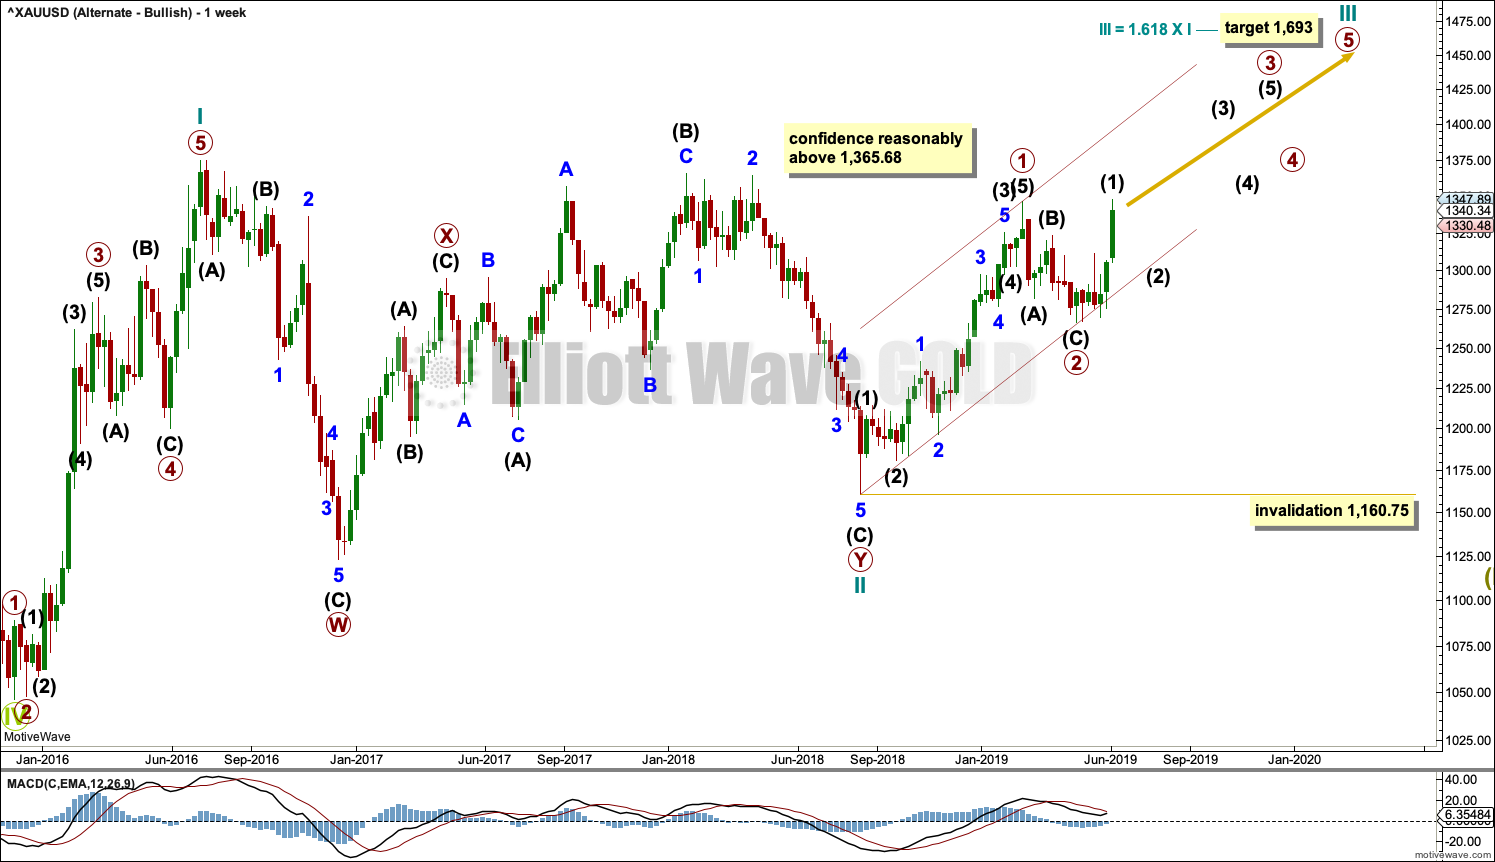
This wave count sees the three waves back now complete at the last major low for Gold in November 2019.
If Gold is in a new bull market, then it should begin with a five wave structure upwards on the weekly chart. However, the biggest problem with this wave count is the structure labelled cycle wave I because this wave count must see it as a five wave structure, but it looks more like a three wave structure.
Commodities often exhibit swift strong fifth waves that force the fourth wave corrections coming just prior and just after to be more brief and shallow than their counterpart second waves. It is unusual for a commodity to exhibit a quick second wave and a more time consuming fourth wave, and this is how cycle wave I is labelled. The probability of this wave count is low due to this problem.
Cycle wave II subdivides well as a double combination: zigzag – X – expanded flat.
Cycle wave III may have begun. Within cycle wave III, primary waves 1 and 2 may now be complete. If it continues lower as a double zigzag, then primary wave 2 may not move beyond the start of primary wave 1 below 1,160.75.
Cycle wave III so far for this wave count would have been underway now for 43 weeks. This week it may be beginning to exhibit some support from volume and increasing ATR. If this increase continues, then this wave count would have some support from technical analysis.
TECHNICAL ANALYSIS
WEEKLY CHART
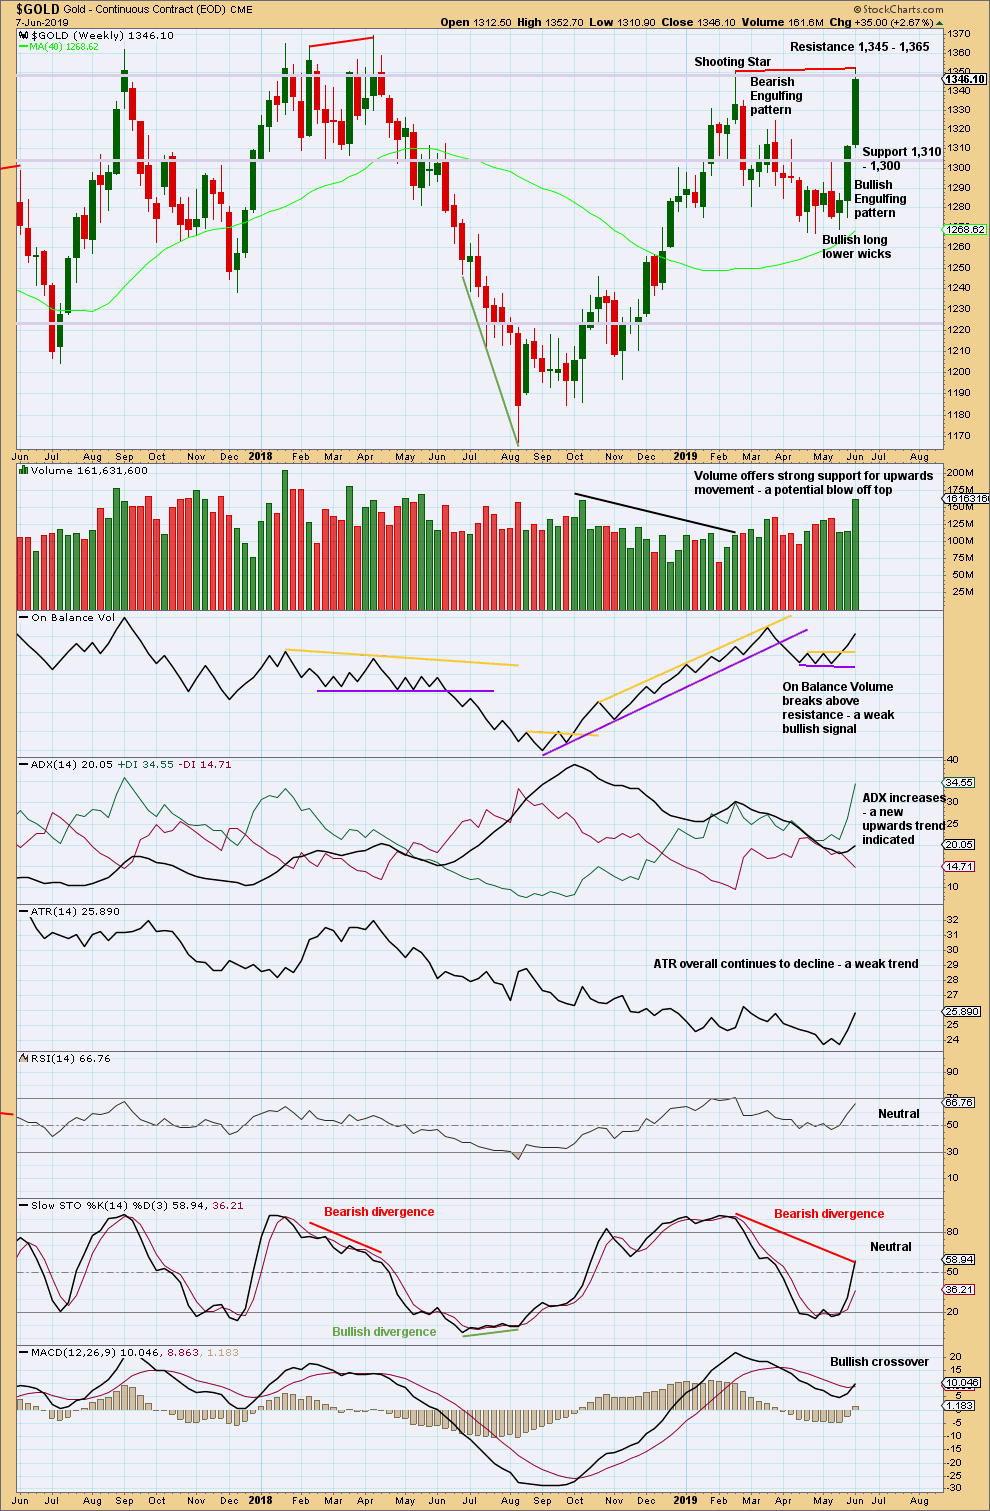
Click chart to enlarge. Chart courtesy of StockCharts.com.
At the last few major highs for Gold (on weeks of 5th July 2016, 5th September 2017, 9th April 2018 and 19th February 2019) the following points are noted:
– Volume was not the strongest for the last upwards week. Some decline in volume accompanied the final high.
– Bearish divergence was seen between price and Stochastics in only two of four of the identified major highs.
– Bearish divergence was seen between price and RSI in only one of four of the identified major highs.
Currently, there is very strong bearish divergence between price and Stochastics: This week price has made a slight new high, but Stochastics is reasonably lower than it was at the last swing high.
Volume however shows no decline this week. It shows a strong increase. This is rarely seen right at a final high, so some further upwards movement may be reasonably expected. This favours the main Elliott wave count.
DAILY CHART
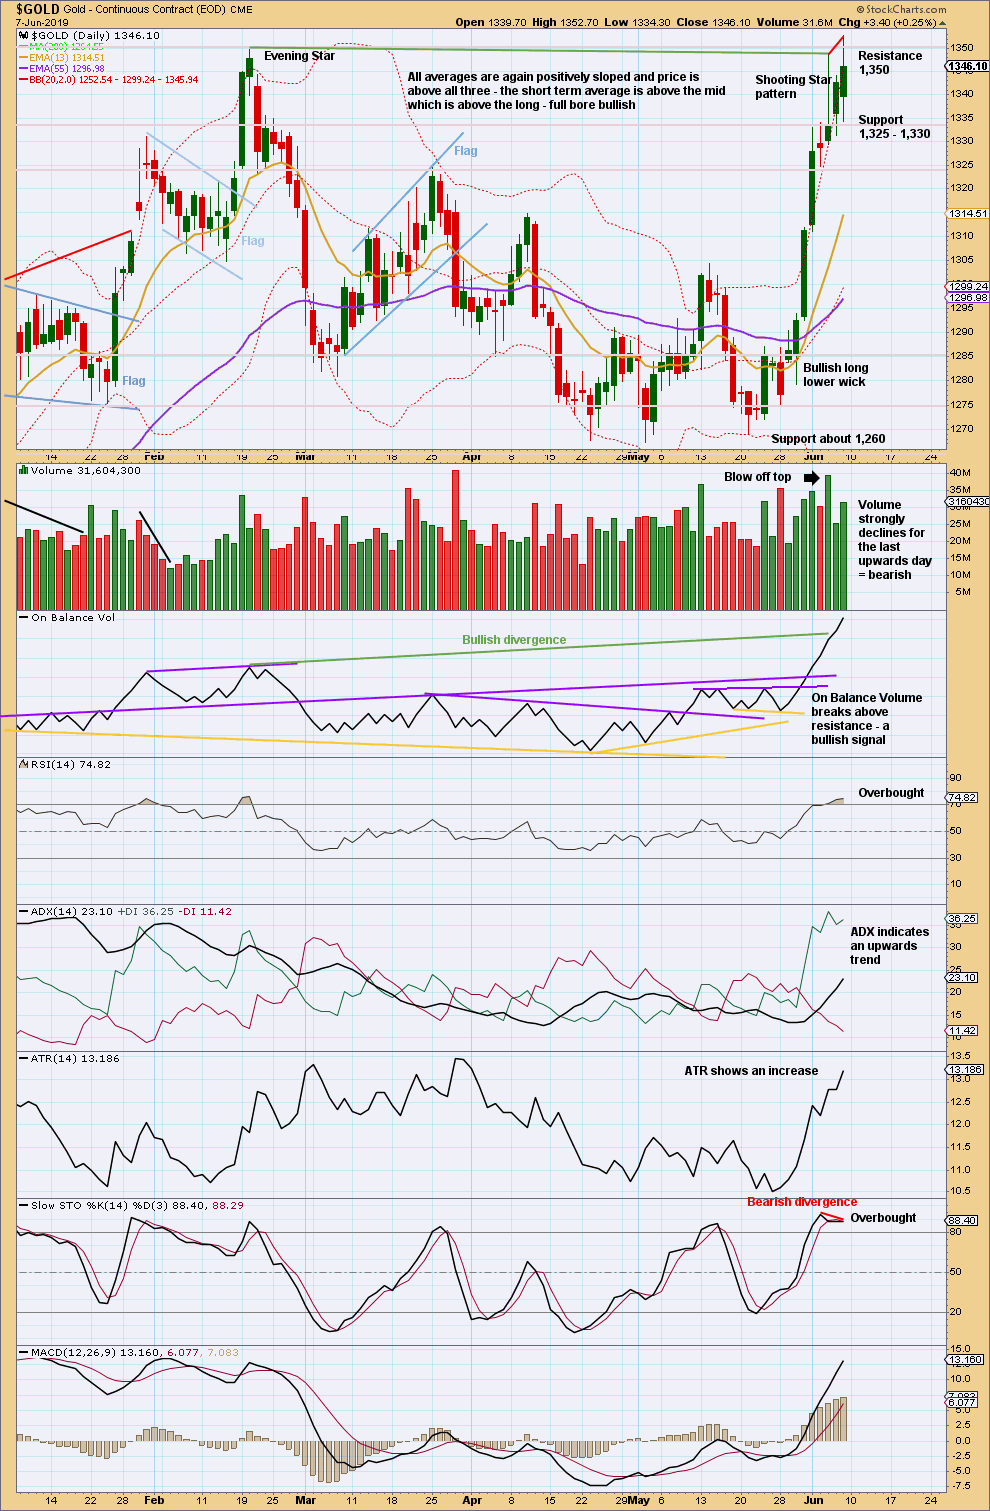
Click chart to enlarge. Chart courtesy of StockCharts.com.
At the daily chart level, there is some decline in volume at the last high for Friday. With both RSI and Stochastics extreme and some bearish divergence between price and Stochastics, some consolidation to relieve extreme conditions would be normal to see after the blow off top. Thereafter, price may continue higher.
The trend is currently upwards. Assume the trend remains the same until proven otherwise. At this stage, there is no evidence that the trend is over.
GDX WEEKLY CHART
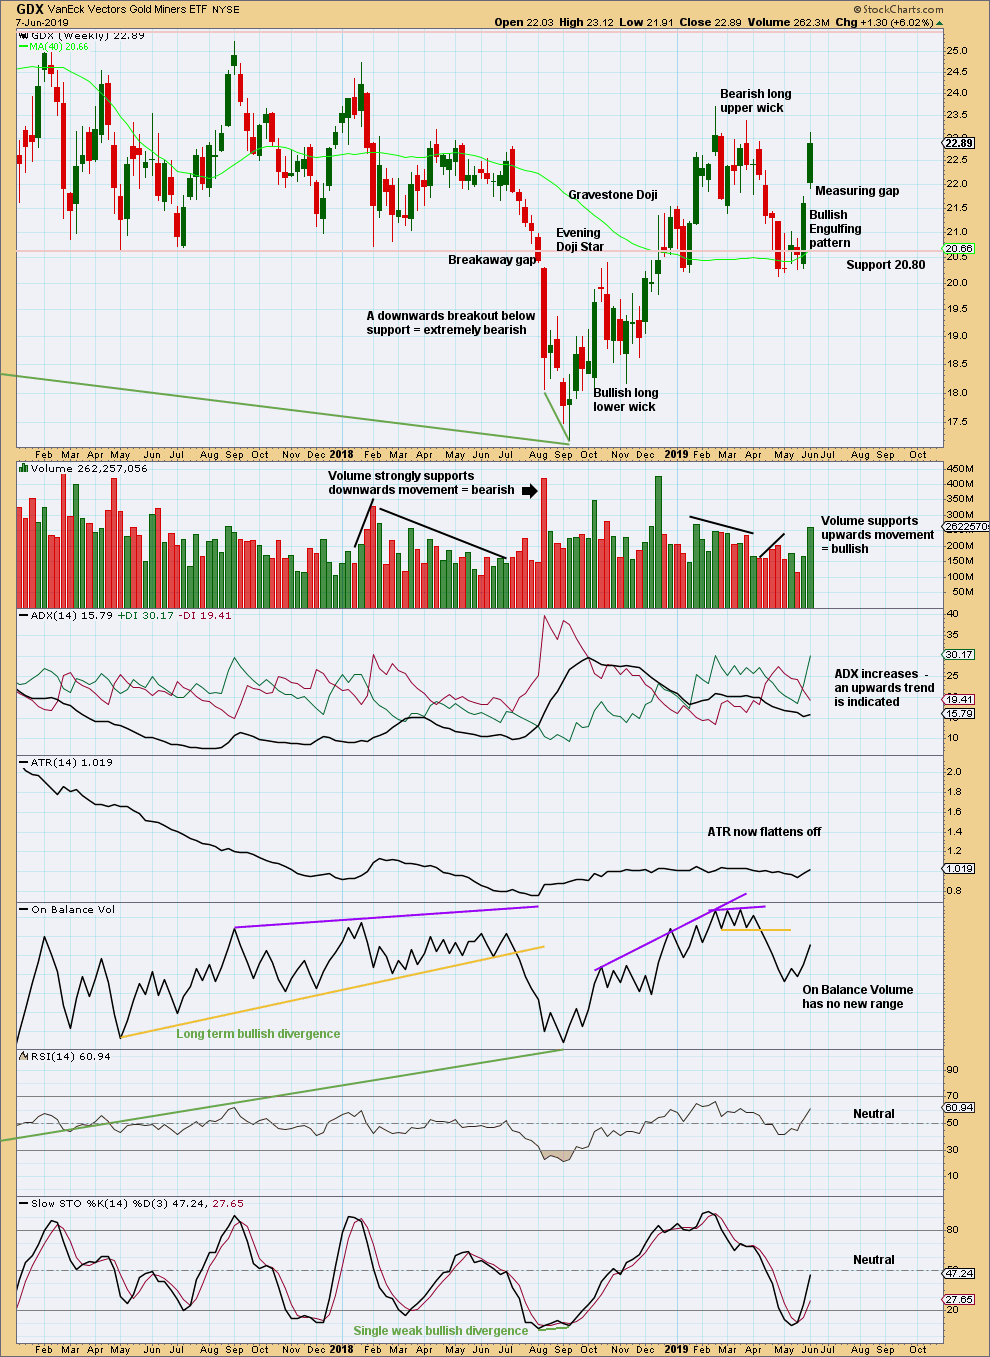
Click chart to enlarge. Chart courtesy of StockCharts.com.
The measuring gap gives a target at 23.39. However, this has already been almost met.
GDX DAILY CHART
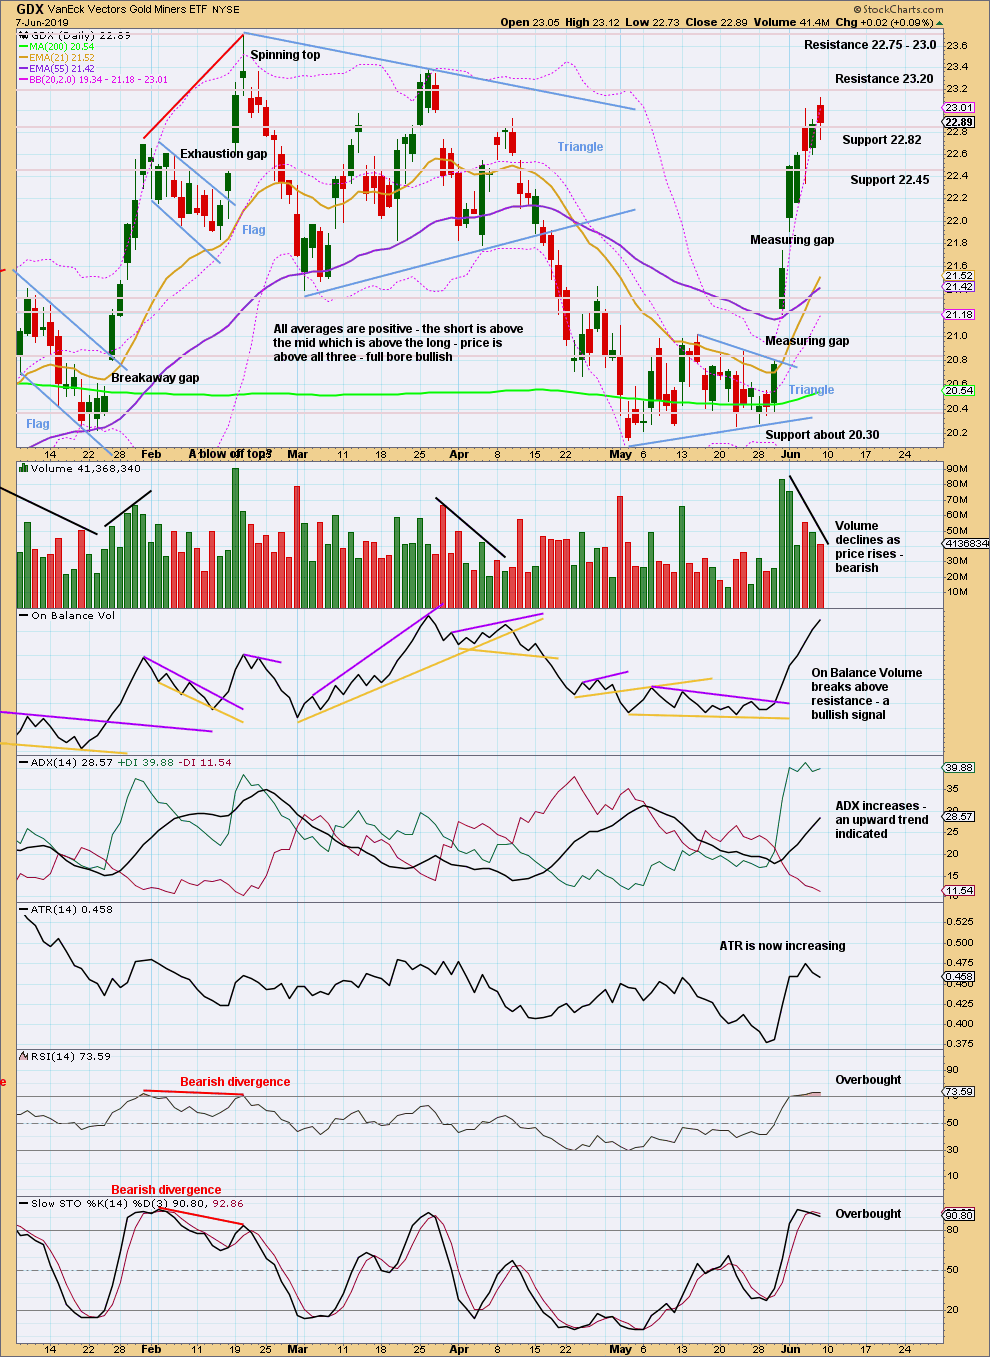
Click chart to enlarge. Chart courtesy of StockCharts.com.
The last measuring gap may now provide support. It may remain open at 21.74.
With both Stochastics and RSI extreme and volume declining, this upwards trend is showing enough weakness at this time for extreme caution to be warranted.
Published @ 10:03 p.m. EST.
—
Careful risk management protects your trading account(s).
Follow my two Golden Rules:
1. Always trade with stops.
2. Risk only 1-5% of equity on any one trade.
—
New updates to this analysis are in bold.
Updated main hourly chart:
Minor 4 may now be a complete expanded flat correction. If minor 5 were to only reach = with minor 1 in length then a new high would not be made. Minor 5 may not exhibit a Fibonacci ratio. The target remains the same.
This count expects one final high for Gold before a cycle degree trend change.
Alternate hourly chart updated:
If cycle b is over then a five down should develop at hourly, daily and weekly time frames. There may now be a five down on the hourly chart. This should then be followed by a bounce for the first reasonable second wave correction, this may be minor wave 2.
Rambus Gold TA ;
https://rambus1.com/2019/06/08/the-golden-neckline/
Now the question remains, how may bears are left to defend the 2013 neckline?
Big patterns lead to big moves.
Enjoy!
Alternate Gold/silver EW counts.
Unfortunately Not as detail as Lara’s analysis.
https://www.youtube.com/watch?time_continue=4&v=qRauGDaJ2nk
Every one in the world is eyeing on 1365 breach. ????
Me! lol