
Upwards movement was expected to continue for the week to reach above 15.467. An inside week failed to reach the expected target, but the structure for the Elliott wave count may now be complete.
Summary: Upwards movement may be over now. A mid-term target may now be about 12.06. A longer-term target remains at 10.05. The final target remains at 3.858.
A new high above 16.195 is still required for confidence in the very bullish alternate. While price remains below this point, the main wave count will remain overall bearish.
Monthly charts were reviewed here.
ELLIOTT WAVE COUNTS
MAIN WAVE COUNT
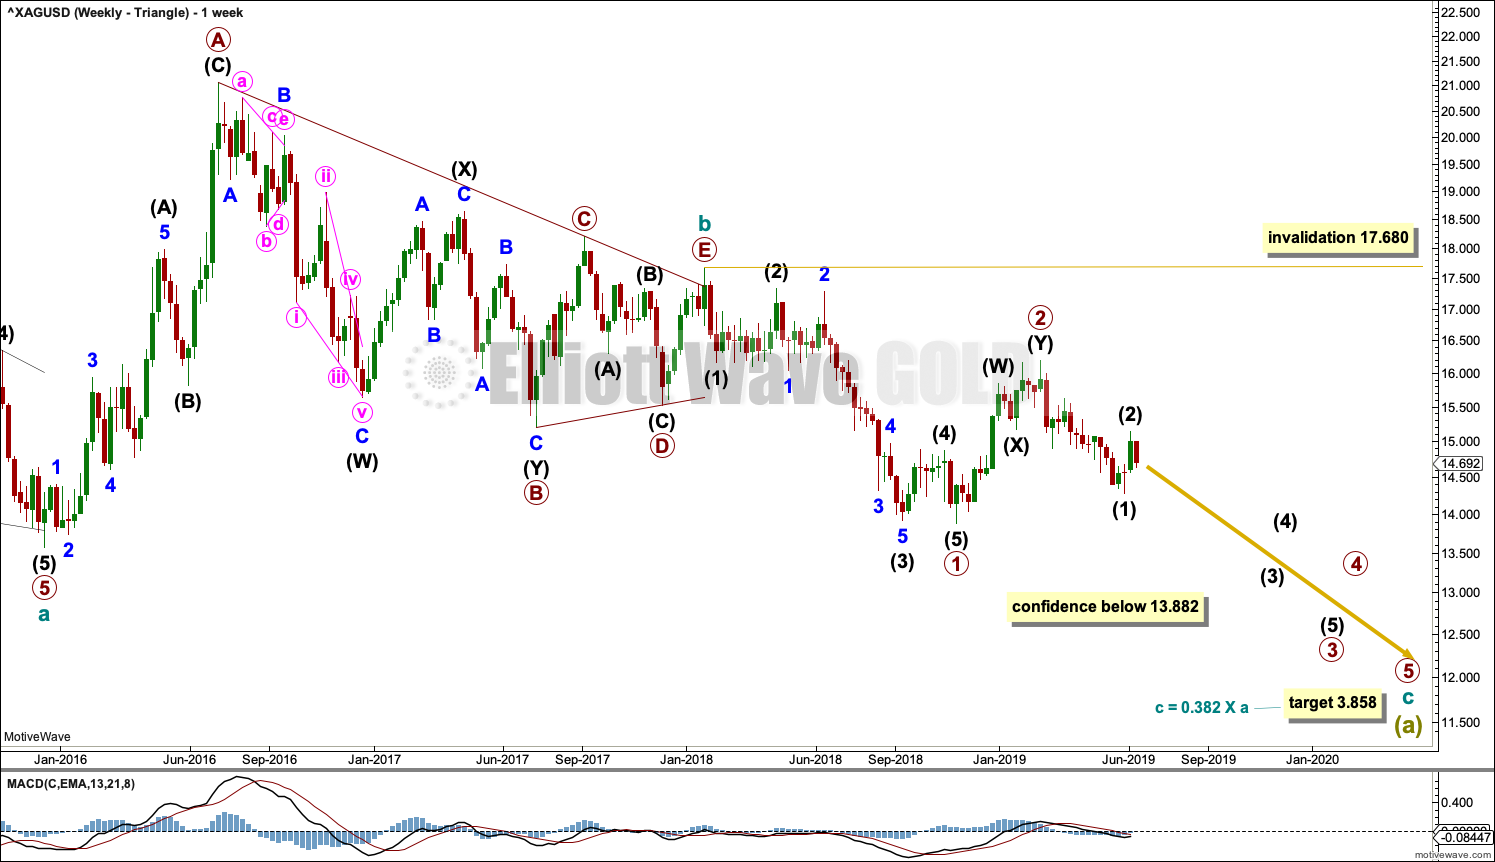
WEEKLY CHART – TRIANGLE
Click chart to enlarge.
The basic Elliott wave structure is five steps forward followed by three steps back. At this time, it is expected that Silver is within a very large three steps back pattern that began at the all time high in April 2011.
Three steps back are almost always labelled in Elliott wave as A-B-C. This Elliott wave count expects that wave A is incomplete, and this is labelled Super Cycle wave (a).
The Elliott wave structure for Super Cycle wave (a) may be a zigzag. Zigzags subdivide 5-3-5. Within this zigzag, cycle waves a and b may be complete. Cycle wave c must subdivide as a five wave Elliott wave structure, most likely an impulse.
Within the impulse of cycle wave c, if primary wave 2 continues higher, it may not move beyond the start of primary wave 1 above 17.680.
Within the zigzag of Super Cycle wave (a), it would be extremely likely for cycle wave c to move below the end of cycle wave a at 13.569 to avoid a truncation. The target would see this achieved.
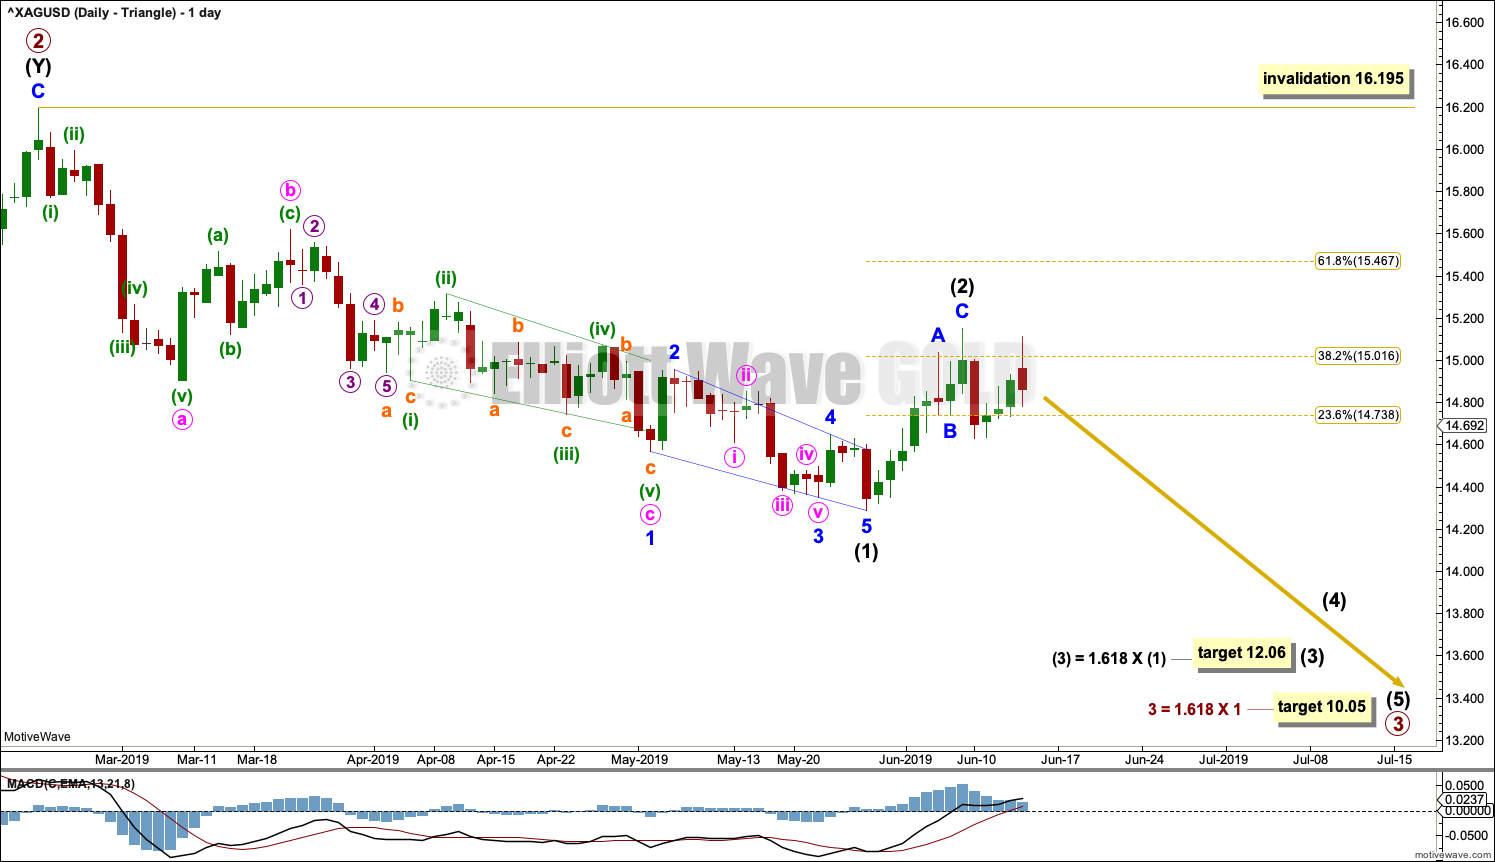
The daily chart below focusses on price movement from the end of primary wave 2.
DAILY CHART – TRIANGLE
Click chart to enlarge.
Primary wave 3 may only subdivide as a five wave impulse. Within this impulse, intermediate wave (1) may have been complete at the last low as a leading contracting diagonal.
Intermediate wave (2) may now be complete. Some strong downwards movement on Friday prints a strong Bearish Engulfing candlestick pattern on Barchart data, which indicates a trend change.
If it continues higher, then intermediate wave (2) may not move beyond the start of intermediate wave (1) above 16.195.
ALTERNATE WAVE COUNT
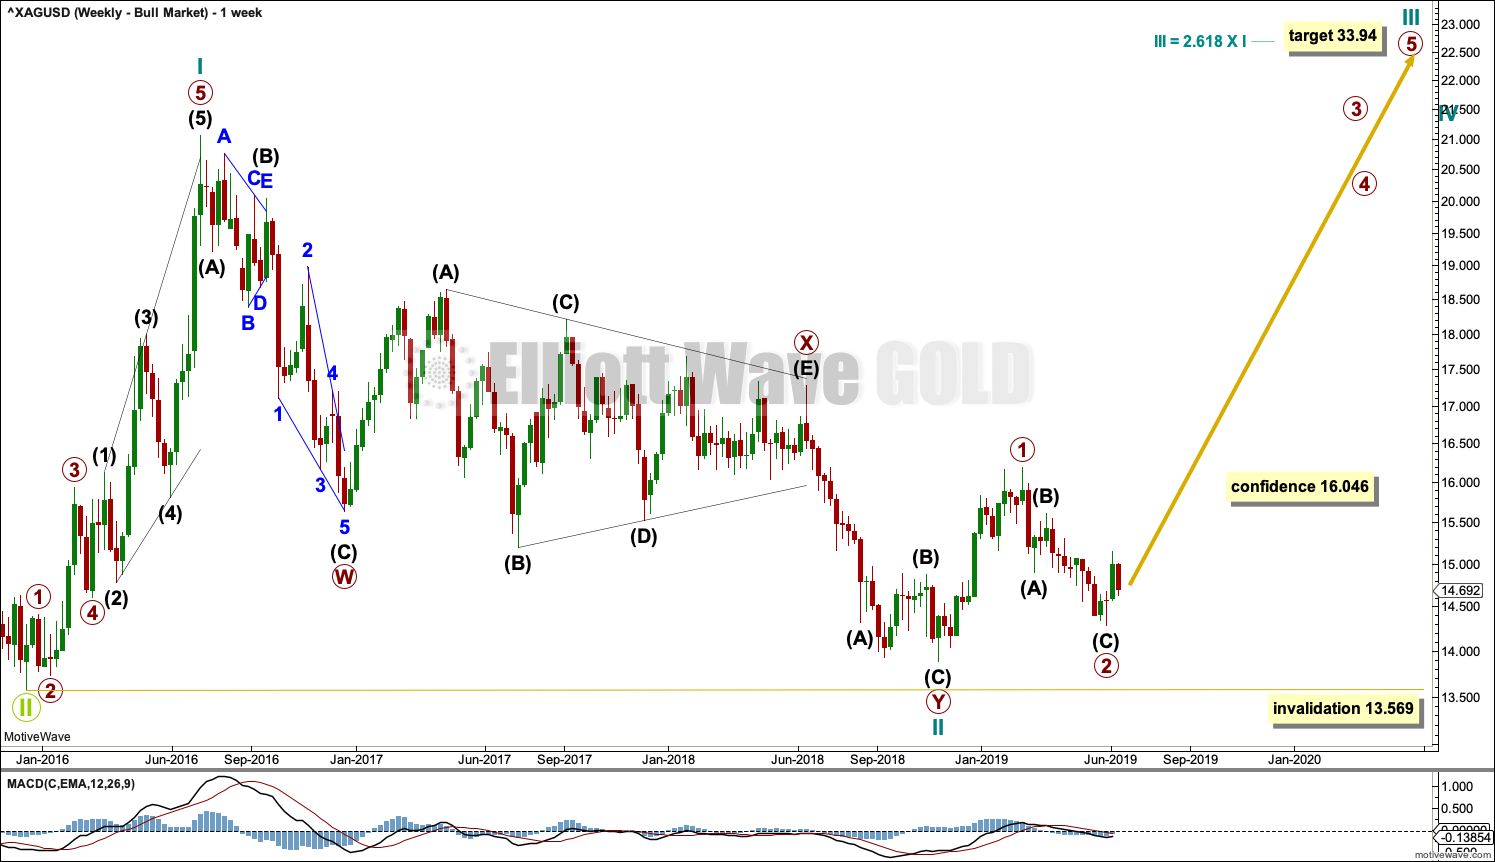
WEEKLY CHART – BULL WAVE COUNT
Click chart to enlarge.
This alternate Elliott wave count sees the three steps back pattern as complete and a new bull market beginning for Silver at the low in December 2015.
A new bull market should begin with a five wave structure upwards. This is labelled cycle wave I.
Following five steps forward should be three steps back. This is labelled cycle wave II. The Elliott wave corrective structure of cycle wave II is labelled as a double zigzag, which is a fairly common structure.
If it continues any further, then cycle wave II may not move beyond the start of cycle wave I below 13.569.
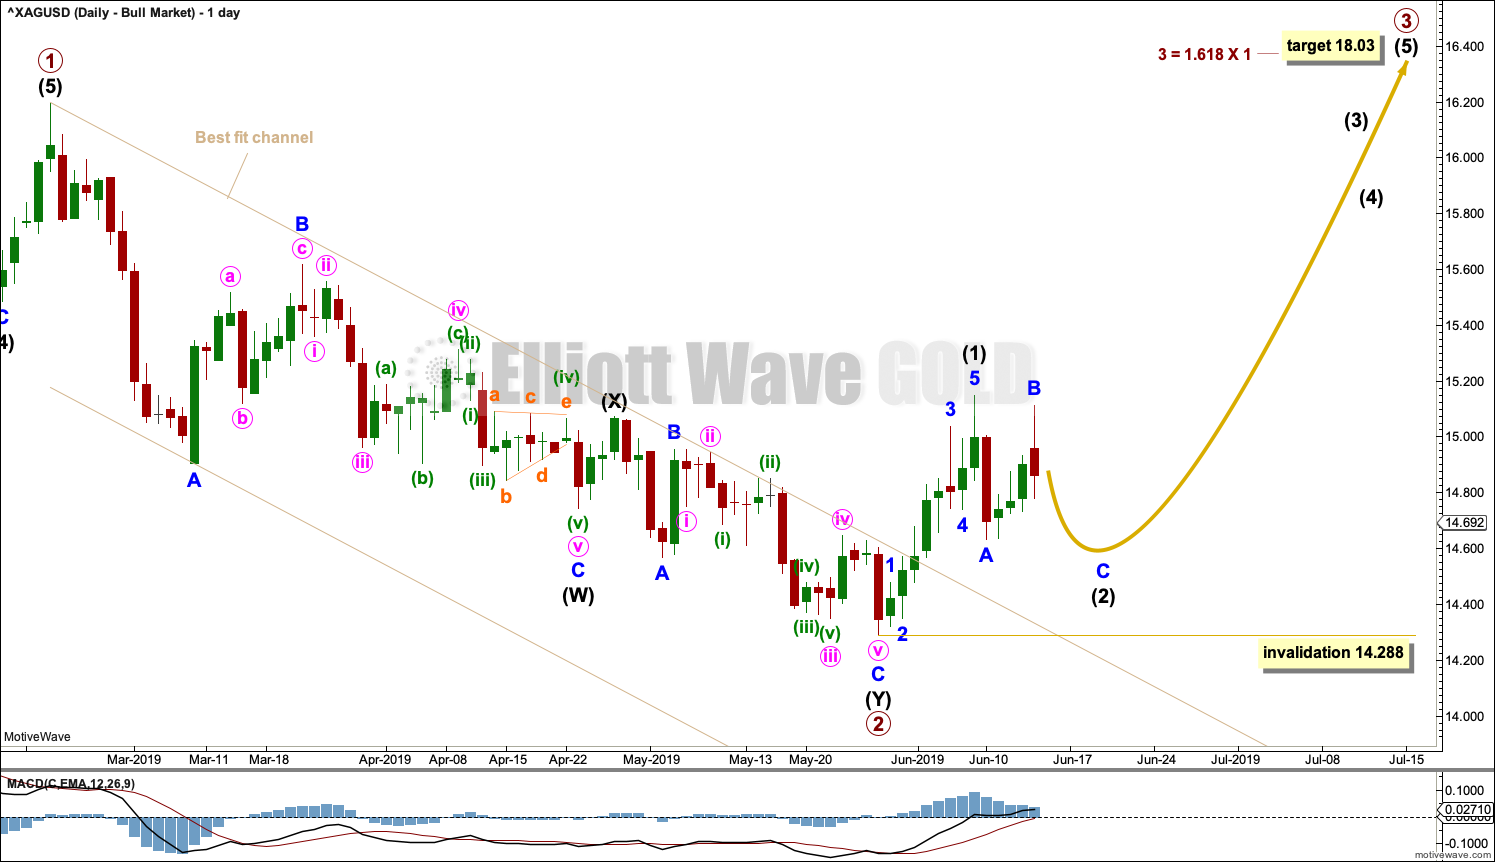
DAILY CHART – BULL WAVE COUNT
Click chart to enlarge.
If cycle wave II is over, then the new trend up for cycle wave III should begin with a five wave structure. This is labelled primary wave 1. The structure may now be complete.
Five steps up should be followed by three steps back, labelled primary wave 2. Primary wave 2 may now be also complete as a double zigzag.
A target is calculated for primary wave 3 that expects to exhibit a common Fibonacci ratio to primary wave 1. Within primary wave 3, no second wave correction may move beyond the start of its first wave below 14.288.
TECHNICAL ANALYSIS
WEEKLY CHART
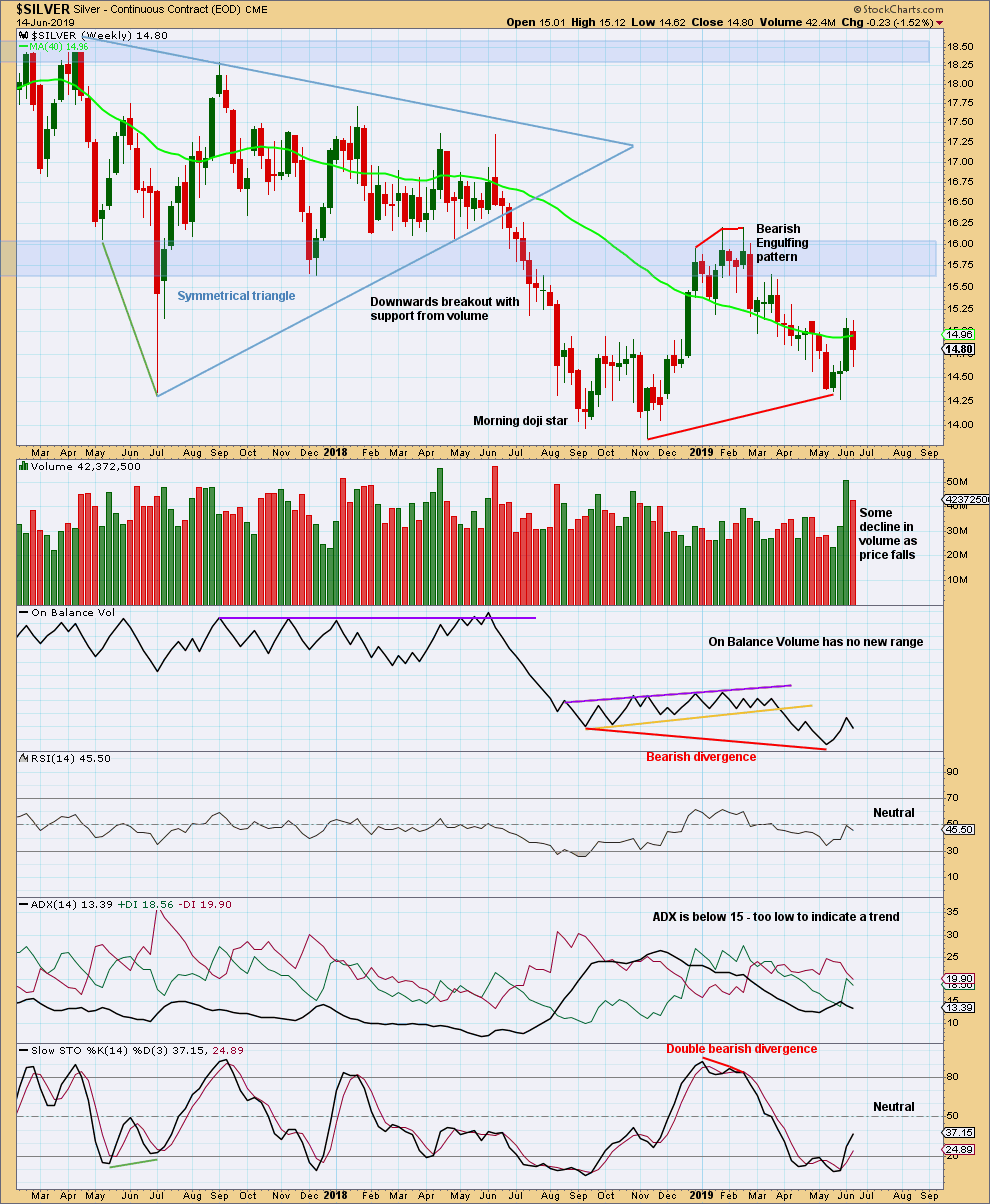
Click chart to enlarge. Chart courtesy of StockCharts.com.
Overall, Silver has been in a downwards trend since the high on the week beginning 19th February. At this stage, there is no evidence of a trend change. ADX has not caught up yet with the downwards trend.
This week the balance of volume was downwards and the candlestick has closed red. Within the week, price has fallen of its own weight.
DAILY CHART
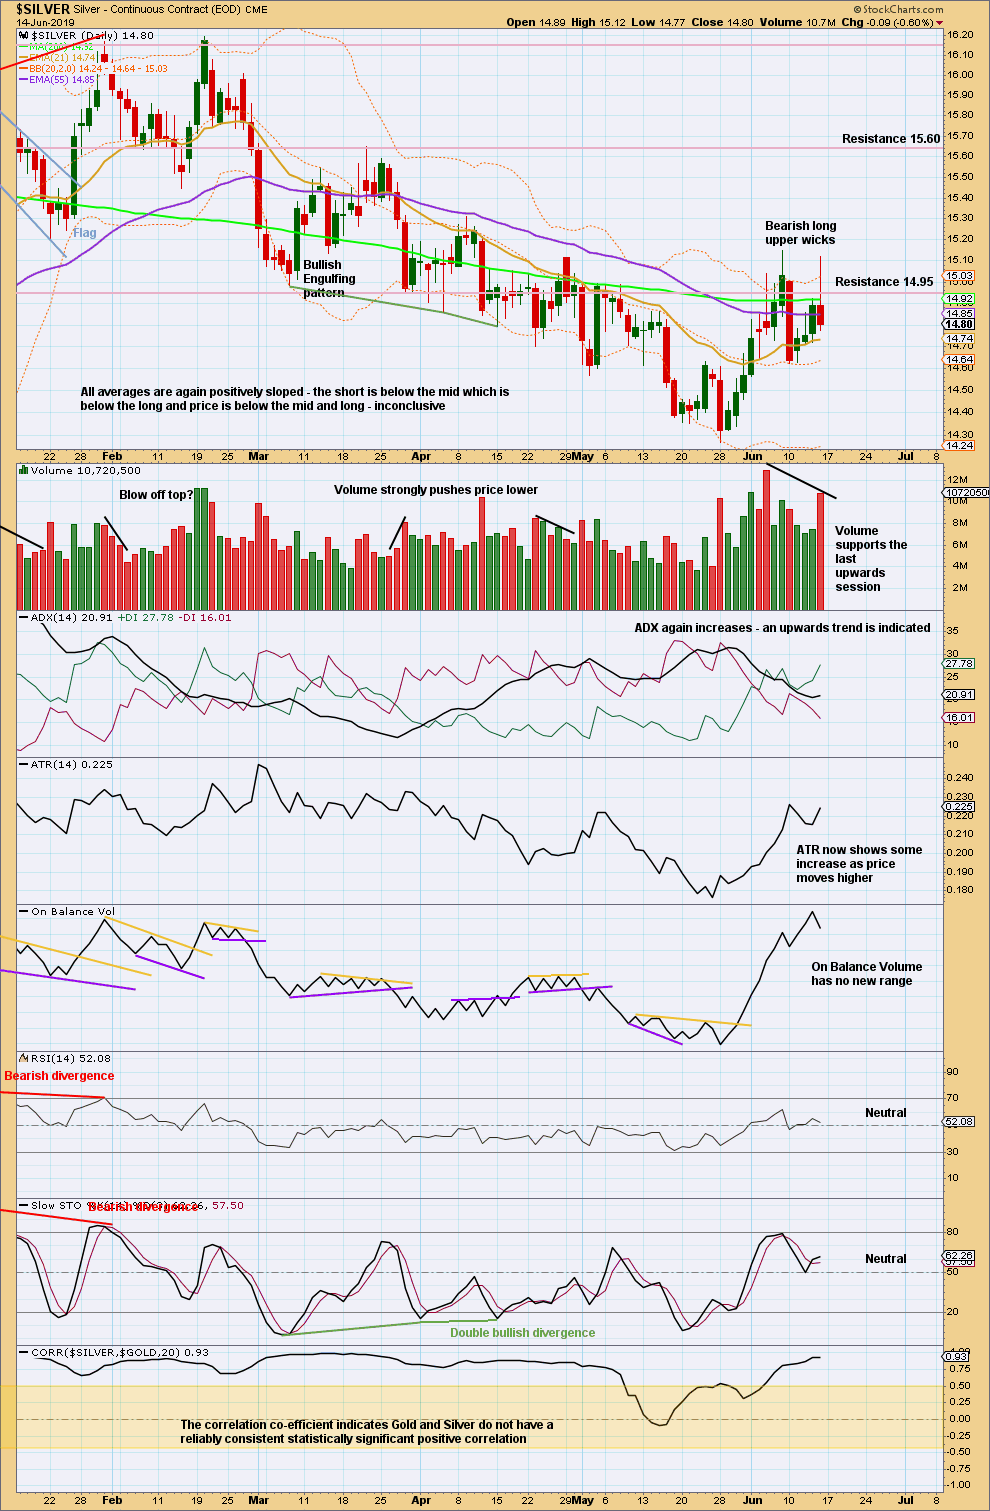
Click chart to enlarge. Chart courtesy of StockCharts.com.
The last swing high at 14.990 on the 8th of May has been breached; the series of lower lows and lower highs has been broken. It is possible that Silver has had a trend change. ADX agrees. ATR shows it has some strength.
Another bearish wick along with some decline in volume between the two swing highs is bearish for the short term.
The correlation coefficient is added to this technical analysis chart to show the correlation between Gold and Silver. Gold and Silver do not always find major highs and lows at the same time. They can spend periods of time during which they do not exhibit a statistically significant correlation. Any correlation which does appear must be understood to be unreliable.
Published @ 09:18 a.m. EST on June 15, 2019.
—
Careful risk management protects your trading account(s).
Follow my two Golden Rules:
1. Always trade with stops.
2. Risk only 1-5% of equity on any one trade.
—
New updates to this analysis are in bold.
Main wave count weekly chart updated:
To be more in line with the bearish wave counts for Gold, for this main wave count primary 2 may be continuing.
Daily chart updated:
Look out for the possibility for minor 3 to end with a blow off top. Minor 4 may be brief and shallow.
Be interested to hear what count you think we are now on Silver.
Really want to go long on Silver, when we think the time is right.
The bullish count must now be judged to have a higher probability. But for Silver both counts remain valid.
In this instance, although the two markets don’t have a reliable statistically significant correlation, the very big picture (bull market vs bear market) for Gold and Silver should be roughly the same. So for Silver I’d lean now more towards the bullish count mostly for this reason.