
Upwards movement has continued, which fits the alternate Elliott wave count. The main Elliott wave count is changed this week.
Summary: A target for this upwards movement to end is now at 16.600.
If price makes a new high by any amount at any time frame above 17.680, then only the very bullish Elliott wave count would remain.
Monthly charts were reviewed here.
ELLIOTT WAVE COUNTS
MAIN WAVE COUNT
WEEKLY CHART – TRIANGLE
Click chart to enlarge.
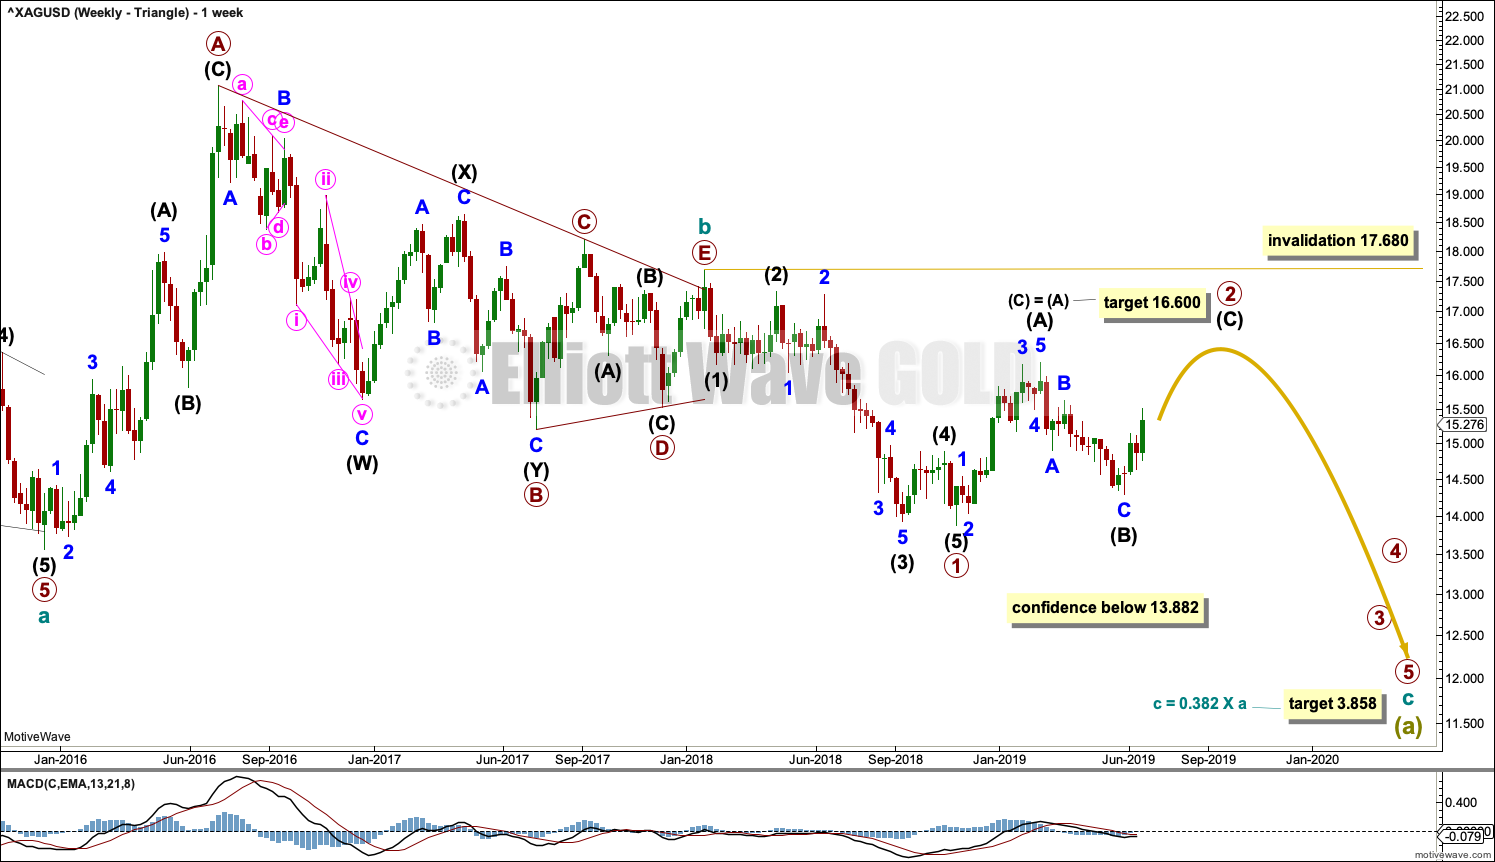
The basic Elliott wave structure is five steps forward followed by three steps back. At this time, it is expected that Silver is within a very large three steps back pattern that began at the all time high in April 2011.
Three steps back are almost always labelled in Elliott wave as A-B-C. This Elliott wave count expects that wave A is incomplete, and this is labelled Super Cycle wave (a).
The Elliott wave structure for Super Cycle wave (a) may be a zigzag. Zigzags subdivide 5-3-5. Within this zigzag, cycle waves a and b may be complete. Cycle wave c must subdivide as a five wave Elliott wave structure, most likely an impulse.
Within the impulse of cycle wave c, if primary wave 2 continues higher, it may not move beyond the start of primary wave 1 above 17.680.
Within the zigzag of Super Cycle wave (a), it would be extremely likely for cycle wave c to move below the end of cycle wave a at 13.569 to avoid a truncation. The target would see this achieved.
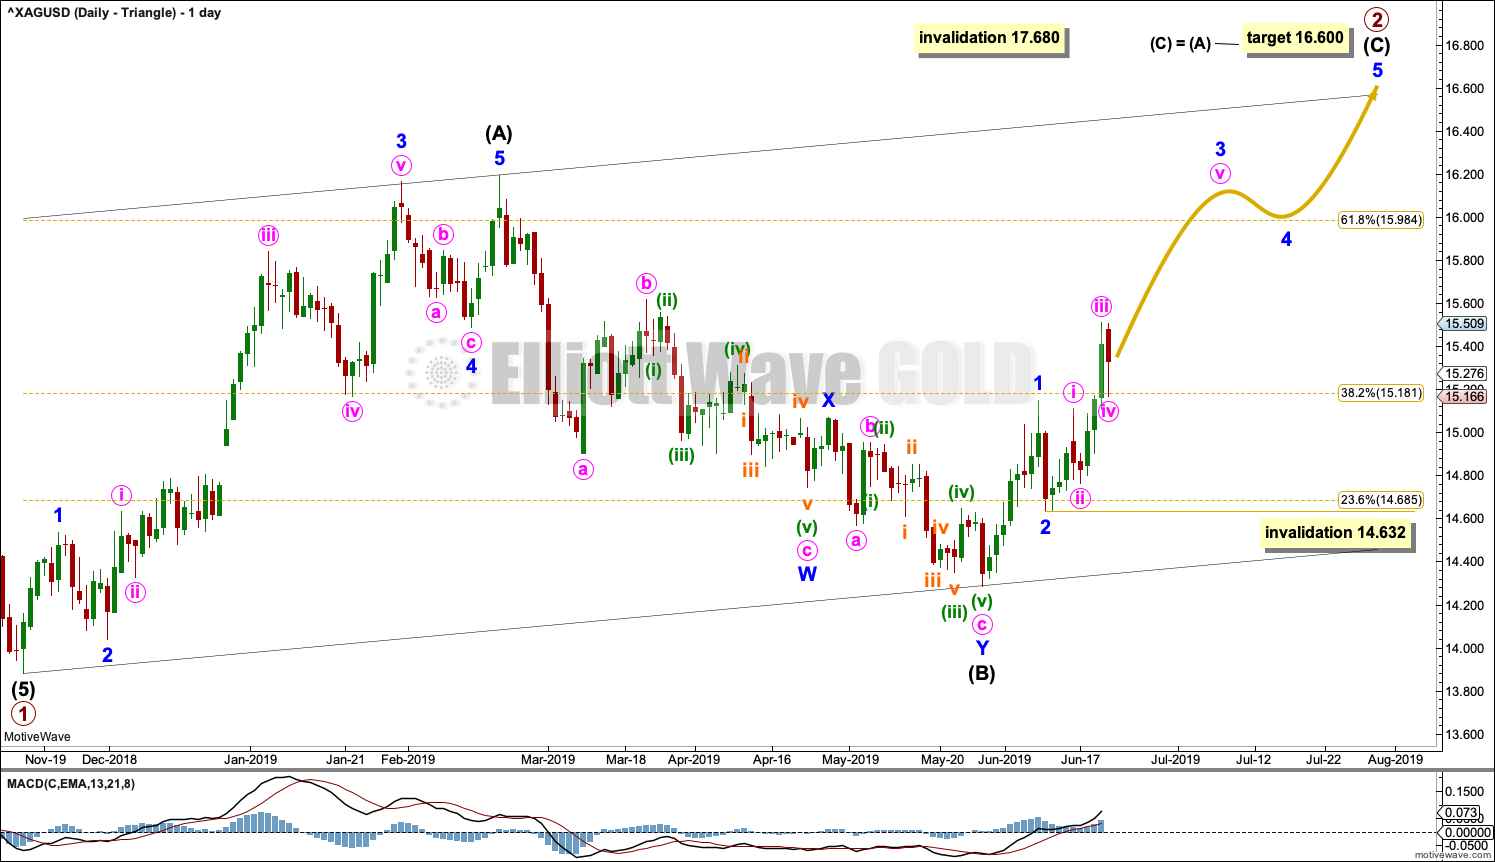
The daily chart below focusses on price movement from the end of primary wave 1.
DAILY CHART – TRIANGLE
Click chart to enlarge.
Primary wave 2 may be an incomplete zigzag.
Intermediate wave (C) would be very likely to make at least a slight new high above the end of intermediate wave (A) at 16.195 to avoid a truncation. The target expects to see the most common Fibonacci ratio between intermediate waves (A) and (C).
Intermediate wave (C) may only subdivide as a five wave impulse. Within intermediate wave (C), minor waves 1 and 2 may be complete. Within minor wave 3, no second wave correction may move beyond the start of its first wave below 14.632.
ALTERNATE WAVE COUNT
WEEKLY CHART – BULL WAVE COUNT
Click chart to enlarge.
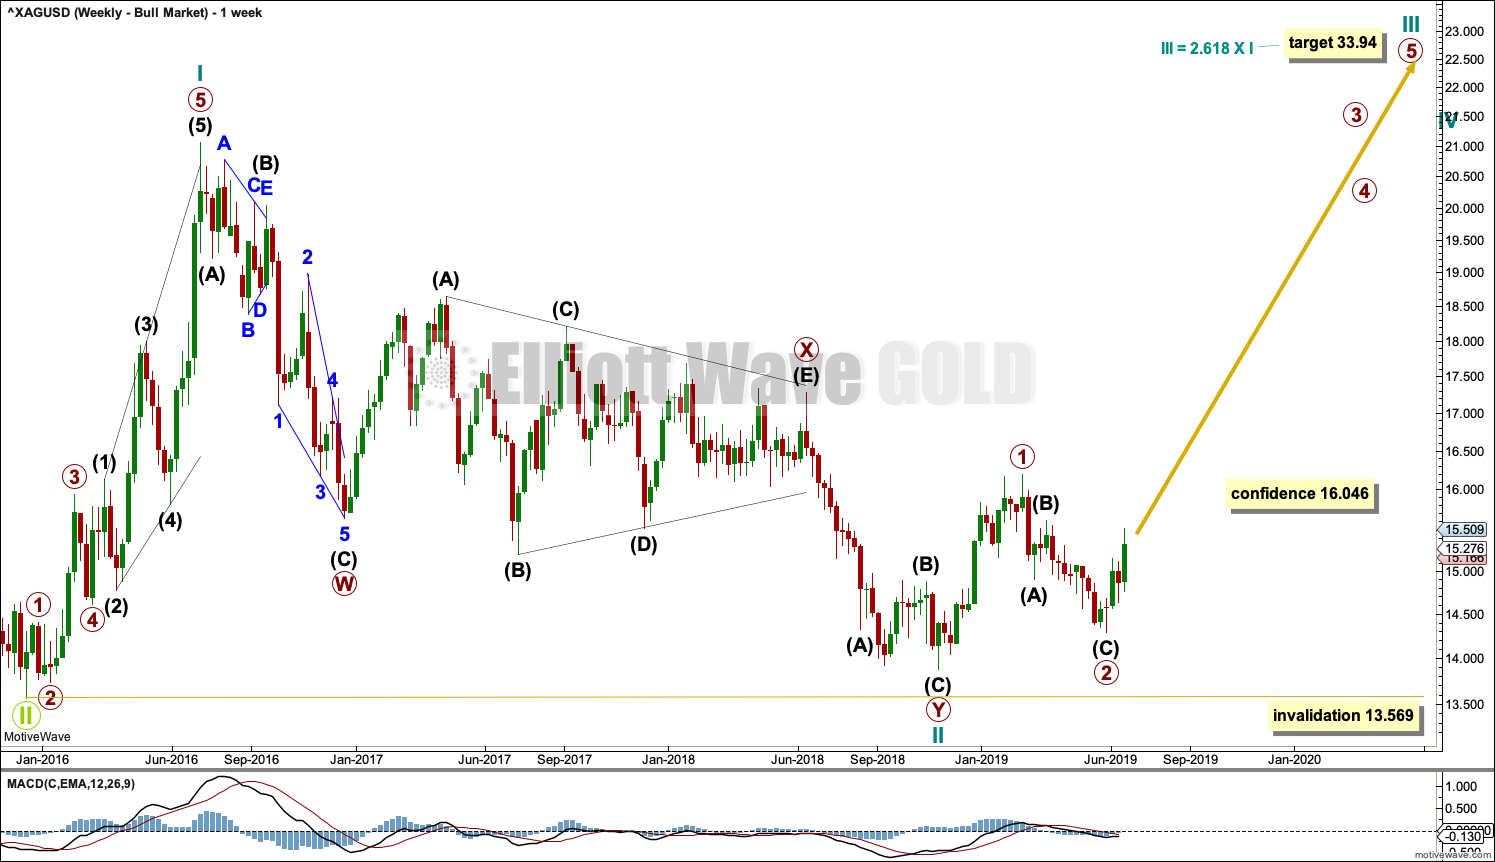
This alternate Elliott wave count sees the three steps back pattern as complete and a new bull market beginning for Silver at the low in December 2015.
A new bull market should begin with a five wave structure upwards. This is labelled cycle wave I.
Following five steps forward should be three steps back. This is labelled cycle wave II. The Elliott wave corrective structure of cycle wave II is labelled as a double zigzag, which is a fairly common structure.
If it continues any further, then cycle wave II may not move beyond the start of cycle wave I below 13.569.
DAILY CHART – BULL WAVE COUNT
Click chart to enlarge.
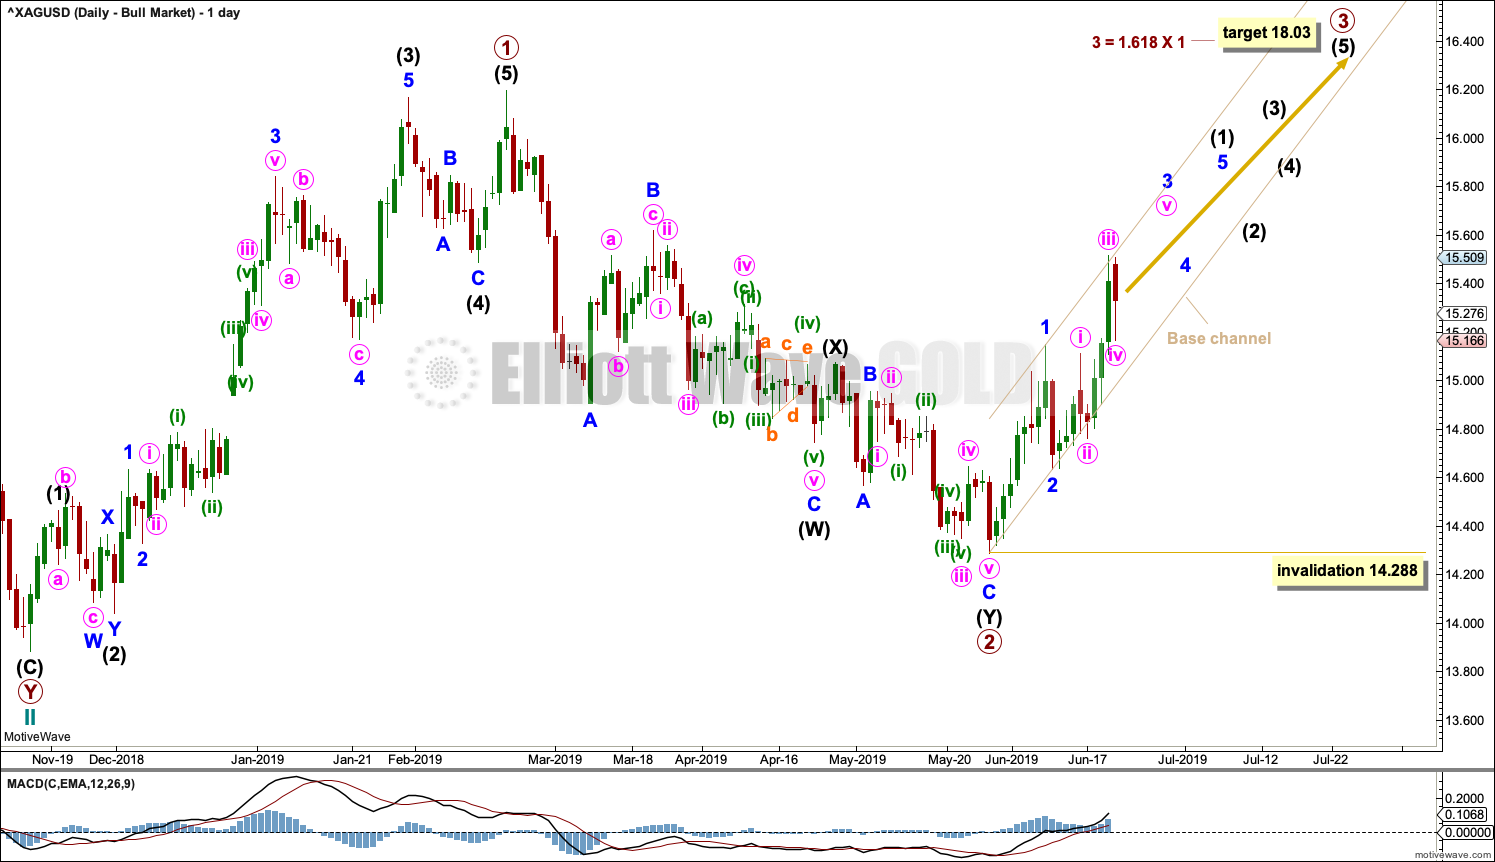
If cycle wave II is over, then the new trend up for cycle wave III should begin with a five wave structure. This is labelled primary wave 1. The structure may now be complete.
Five steps up should be followed by three steps back, labelled primary wave 2. Primary wave 2 may now be also complete as a double zigzag.
A target is calculated for primary wave 3 that expects to exhibit a common Fibonacci ratio to primary wave 1. Within primary wave 3, no second wave correction may move beyond the start of its first wave below 14.288.
TECHNICAL ANALYSIS
WEEKLY CHART
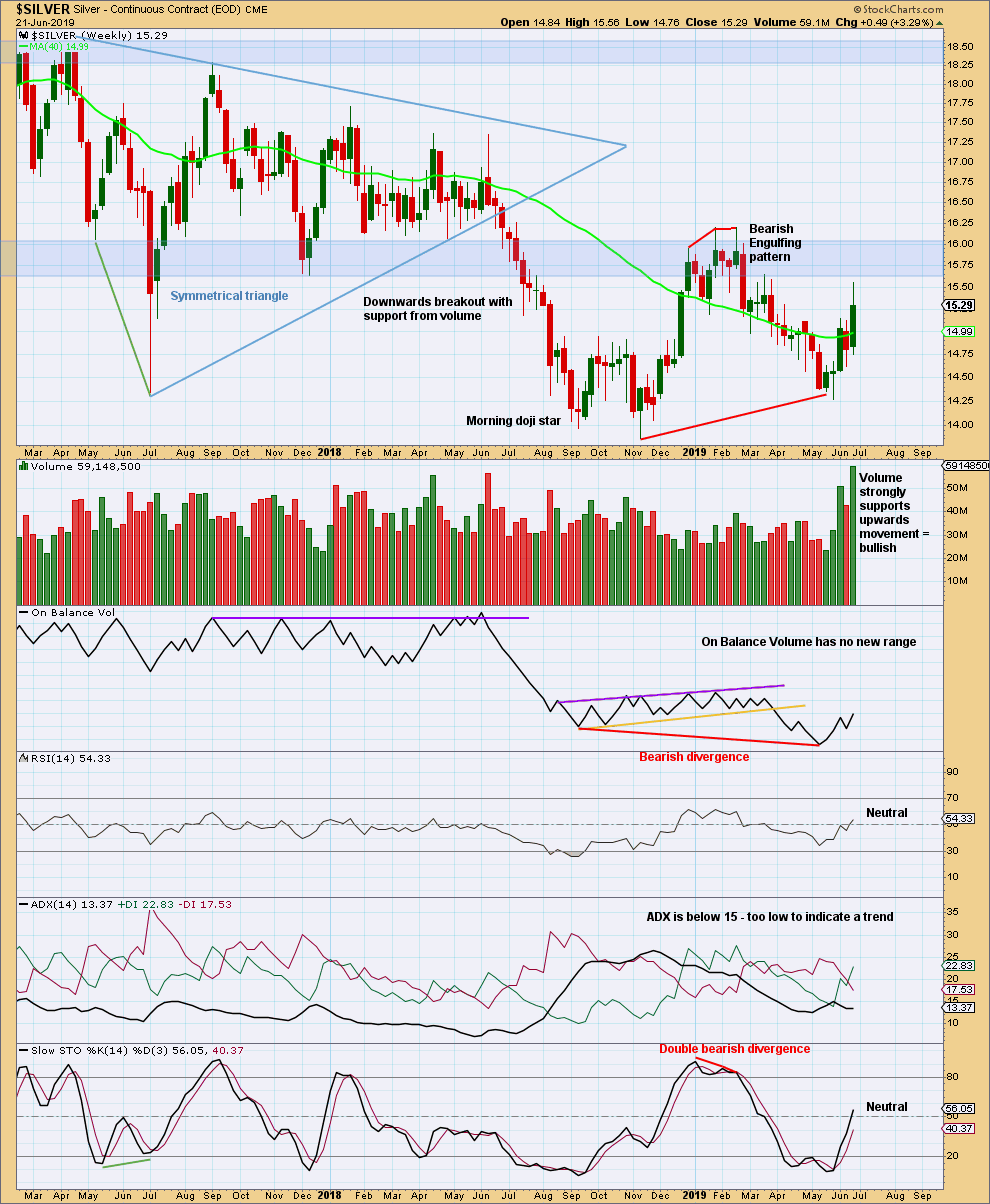
Click chart to enlarge. Chart courtesy of StockCharts.com.
Strong support for upwards movement within this last week does not necessarily mean more upwards movement should follow next week. Silver can end upwards movements with very strong volume.
Look for strong resistance in a zone about 15.64 to 16.05.
DAILY CHART
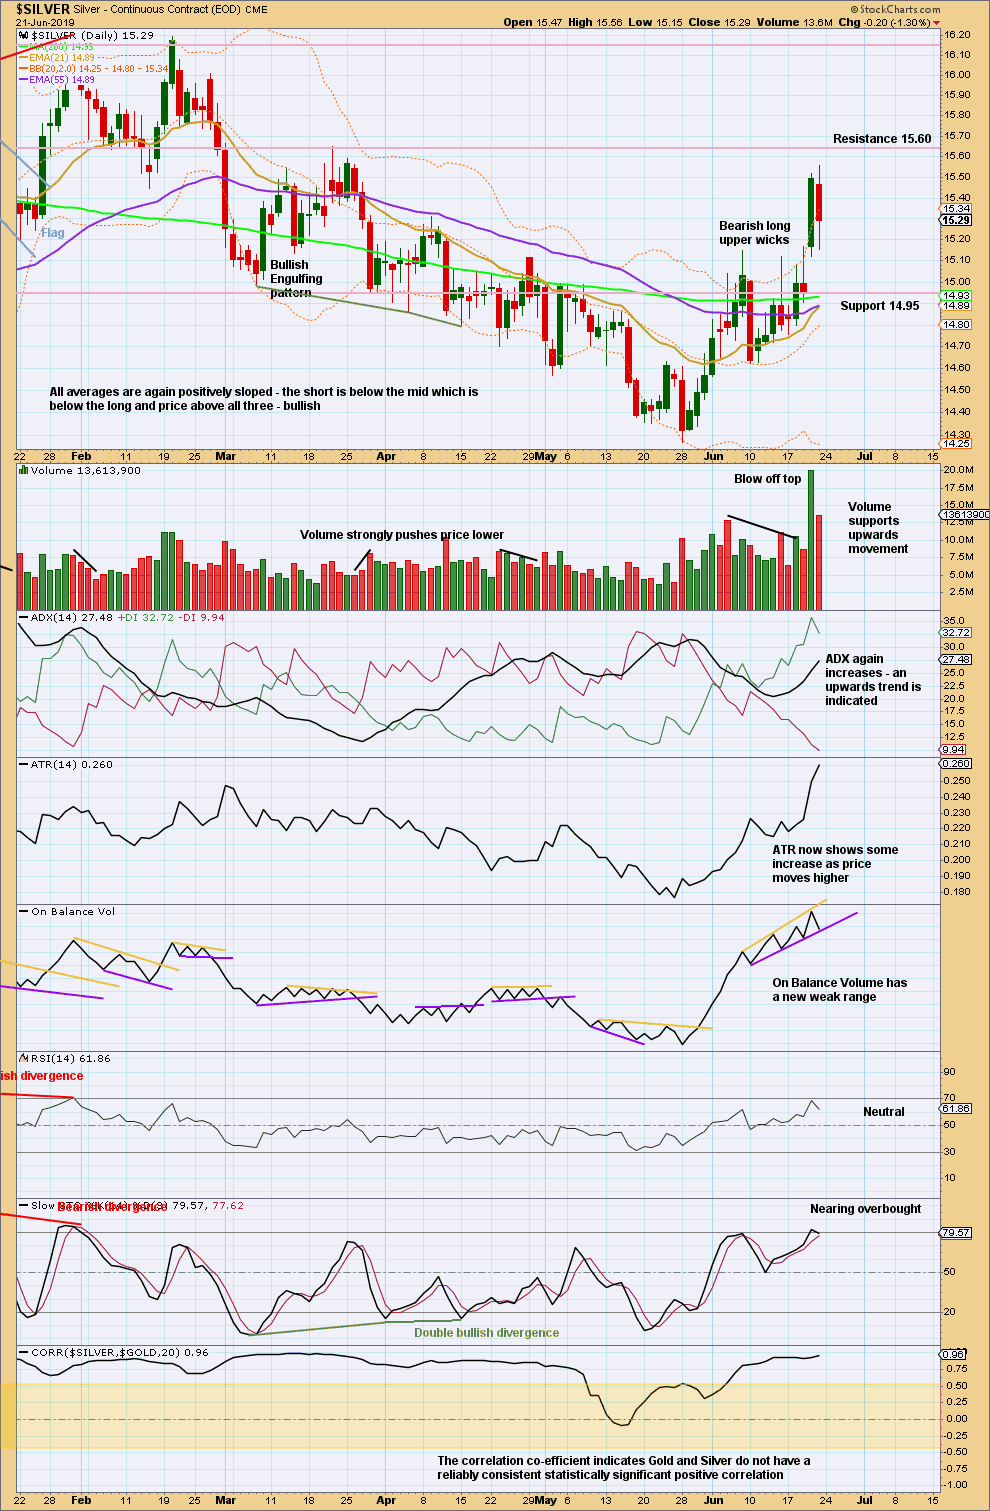
Click chart to enlarge. Chart courtesy of StockCharts.com.
Blow off tops are usually followed by some consolidation or a pullback, before price makes new highs which may end a trend. They seem to rarely be the end of a movement.
Published @ 01:12 p.m. EST on June 22, 2019.
—
Careful risk management protects your trading account(s).
Follow my two Golden Rules:
1. Always trade with stops.
2. Risk only 1-5% of equity on any one trade.
—
New updates to this analysis are in bold.
Any further thoughts or changes on silver, Lara?