
The channel on the daily chart is mostly showing about where bounces have found resistance so far. Price remains below the invalidation point.
Summary: A series of lower highs will remain intact while price remains below 14.990. A breach of 14.990 would produce a higher high and indicate a potential trend change to upwards.
The short-term target is at 13.524. Look for bounces to continue to find resistance at the upper edge of the best fit channel on daily charts.
The long-term target remains at 10.05.
At the end of the week, the 50 day moving average has crossed below the 200 day moving average giving a bearish signal for Silver, which supports the main Elliott wave count.
Monthly charts were reviewed here.
ELLIOTT WAVE COUNTS
MAIN WAVE COUNT
WEEKLY CHART – TRIANGLE
Click chart to enlarge.
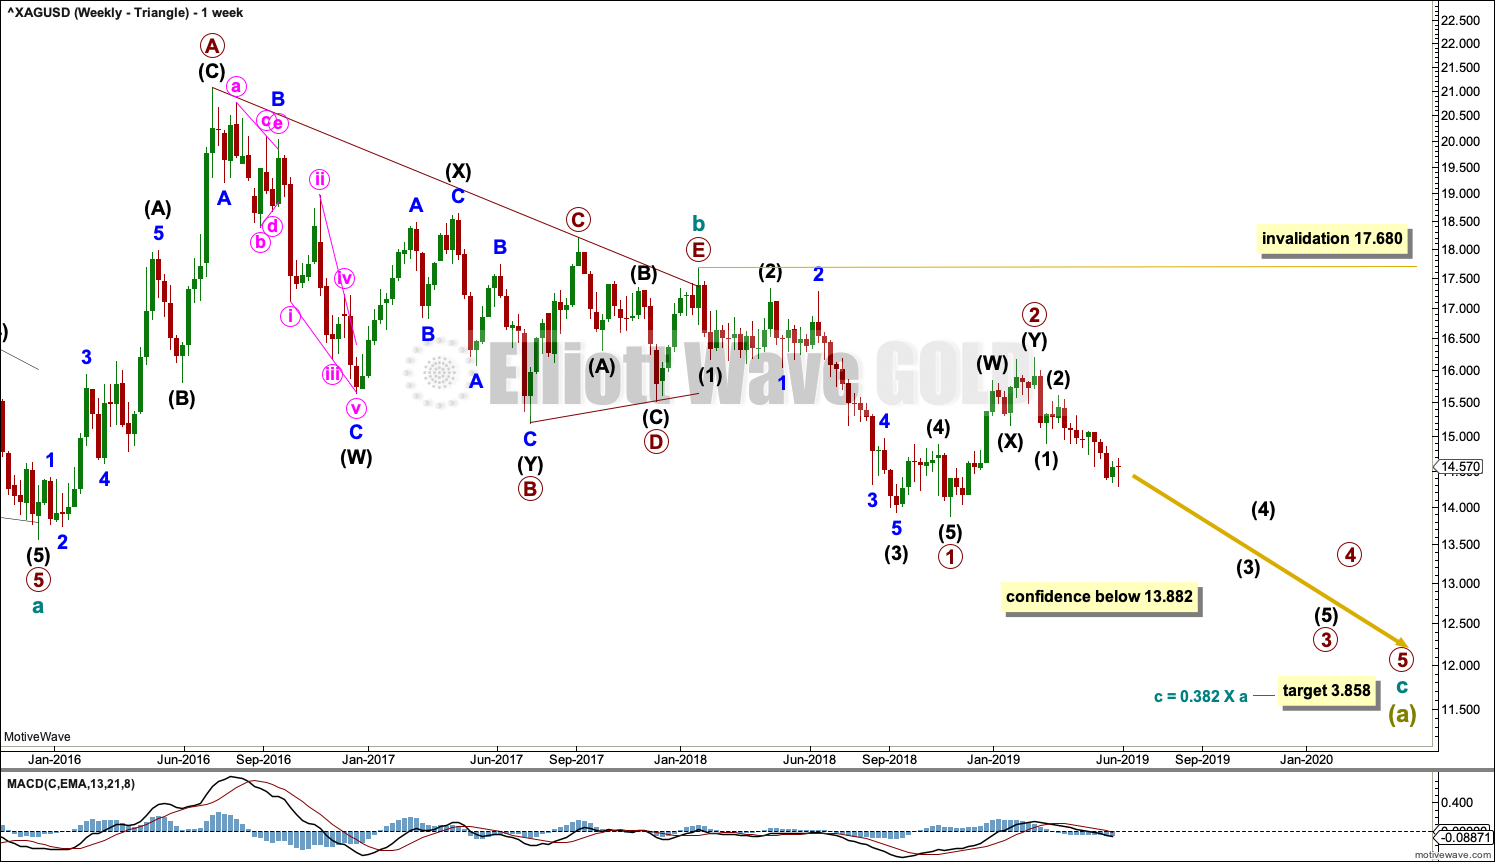
The basic Elliott wave structure is five steps forward followed by three steps back. At this time, it is expected that Silver is within a very large three steps back pattern that began at the all time high in April 2011.
Three steps back are almost always labelled in Elliott wave as A-B-C. This Elliott wave count expects that wave A is incomplete, and this is labelled Super Cycle wave (a).
The Elliott wave structure for Super Cycle wave (a) may be a zigzag. Zigzags subdivide 5-3-5. Within this zigzag, cycle waves a and b may be complete. Cycle wave c must subdivide as a five wave Elliott wave structure, most likely an impulse.
Within the impulse of cycle wave c, if primary wave 2 continues higher, it may not move beyond the start of primary wave 1 above 17.680.
Within the zigzag of Super Cycle wave (a), it would be extremely likely for cycle wave c to move below the end of cycle wave a at 13.569 to avoid a truncation. The target would see this achieved.
The daily chart below focusses on price movement from the end of primary wave 2.
DAILY CHART – TRIANGLE
Click chart to enlarge.
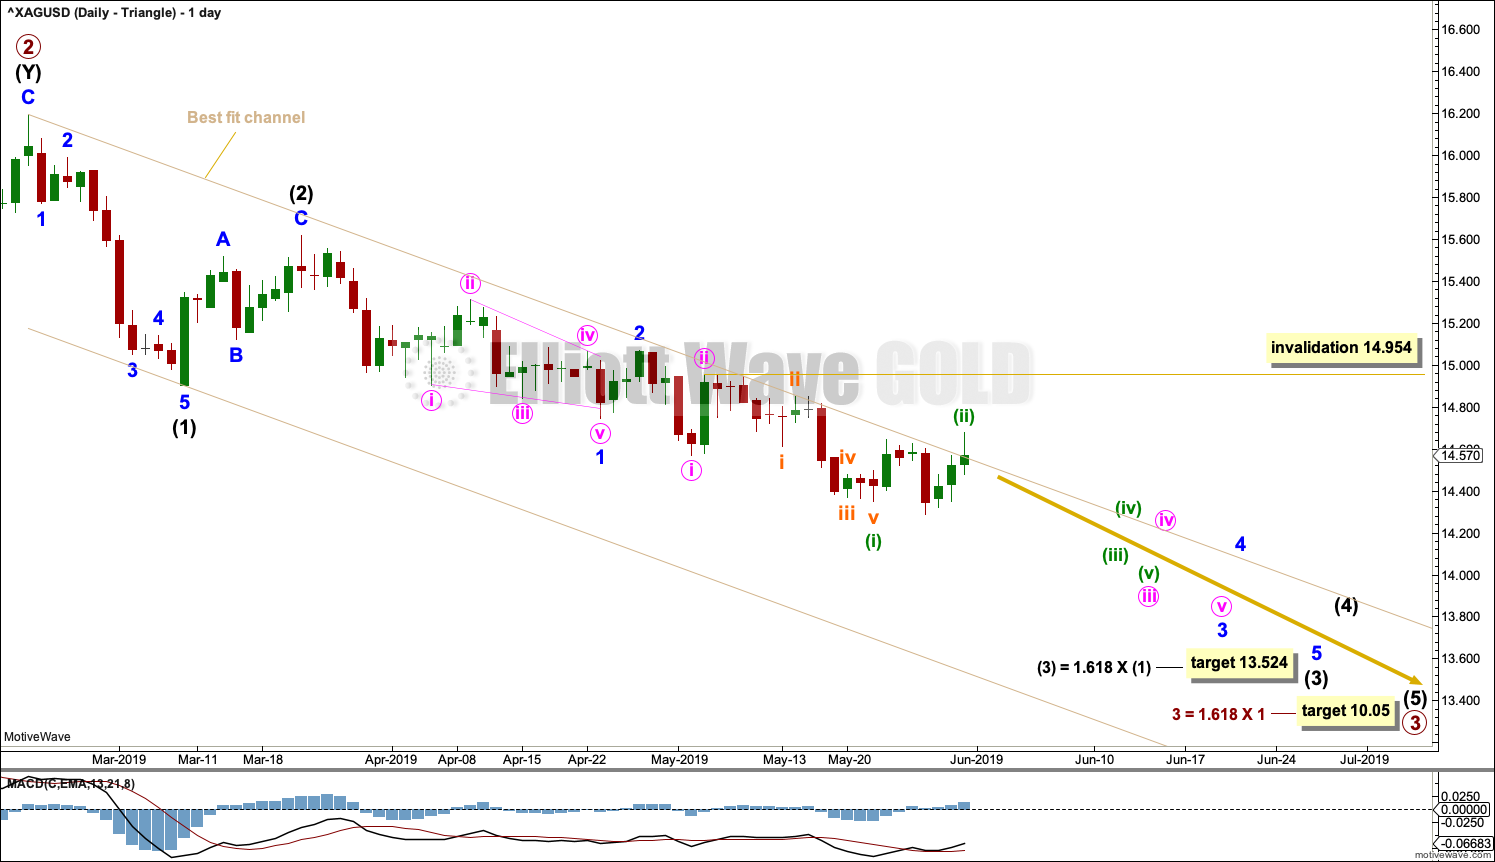
Primary wave 3 may only subdivide as a five wave impulse. Within this impulse, intermediate waves (1) and (2) may be complete.
Intermediate wave (3) may only subdivide as a five wave impulse. Within this impulse, minor waves 1 and 2 may be complete.
Minor wave 3 may only subdivide as a five wave impulse. Within this impulse, minute waves i and ii may be complete.
Minute wave iii may only subdivide as a five wave impulse. Within this impulse, minuette waves (i) and (ii) may be complete.
Minuette wave (iii) may only subdivide as a five wave impulse. Within this impulse, no second wave correction may move beyond the start of its first wave above 14.852.
The upper edge of the best fit channel may continue to provide resistance for bounces along the way down. The channel is overshot by Friday’s upper wick, but it is not properly breached. A breach may be defined as a full daily candlestick above and not touching the upper edge, preferably by upwards movement and not sideways.
Targets are calculated for both of intermediate wave (3) and primary wave 3. The targets expect these third waves to exhibit the most common Fibonacci ratio to their counterpart first waves.
At this stage, this wave count for Silver now sees a series of five overlapping first and second waves complete. This wave count now expects a strong increase in downwards momentum as the middle of a third wave unfolds. Any one or more of the ends of these third waves may end with a selling climax.
ALTERNATE WAVE COUNT
WEEKLY CHART – BULL WAVE COUNT
Click chart to enlarge.
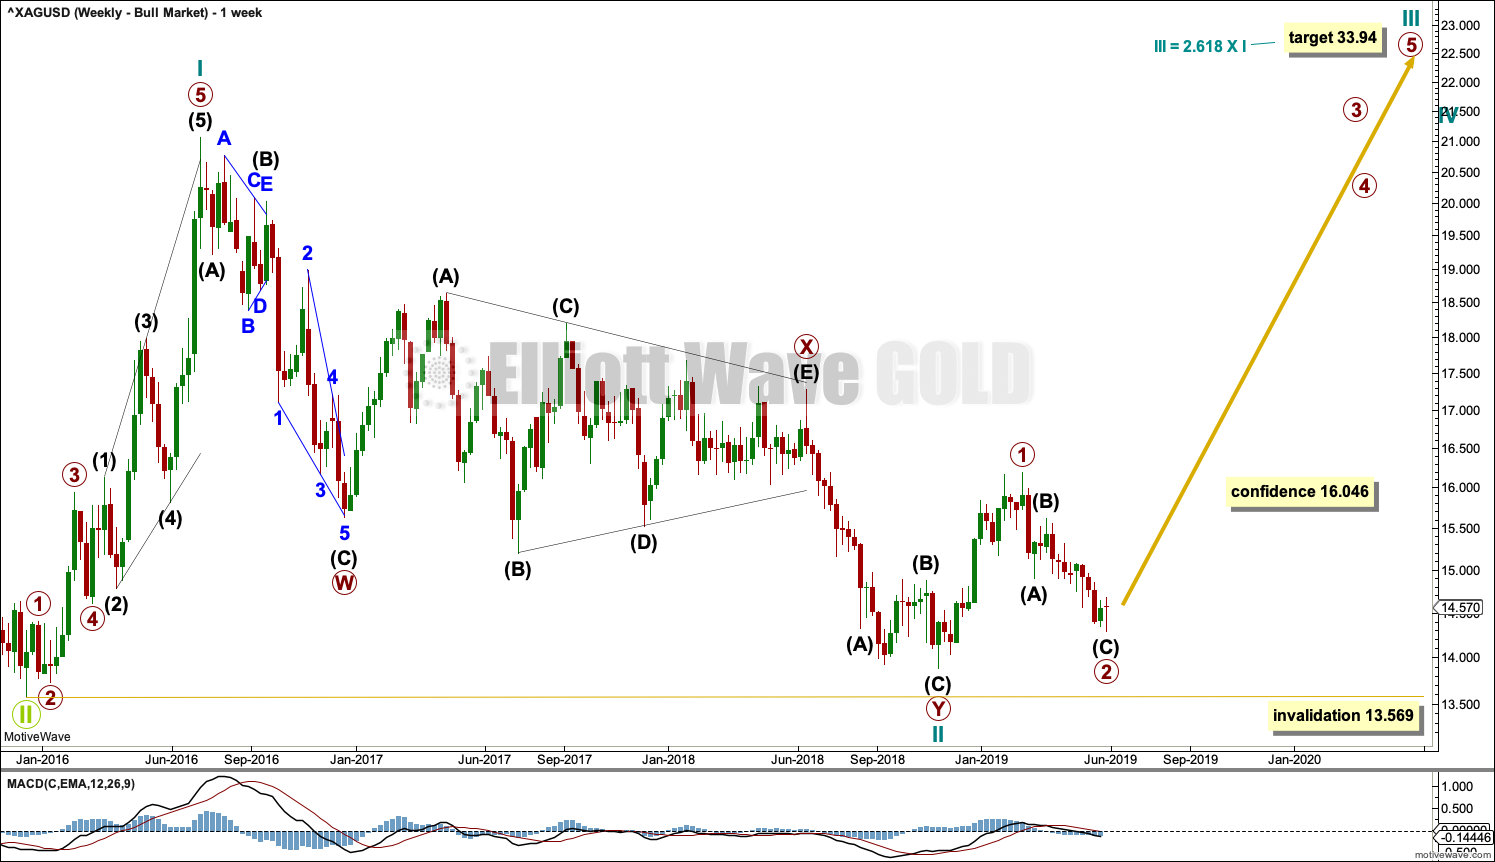
This alternate Elliott wave count sees the three steps back pattern as complete and a new bull market beginning for Silver at the low in December 2015.
A new bull market should begin with a five wave structure upwards. This is labelled cycle wave I.
Following five steps forward should be three steps back. This is labelled cycle wave II. The Elliott wave corrective structure of cycle wave II is labelled as a double zigzag, which is a fairly common structure.
If it continues any further, then cycle wave II may not move beyond the start of cycle wave I below 13.569.
DAILY CHART – BULL WAVE COUNT
Click chart to enlarge.
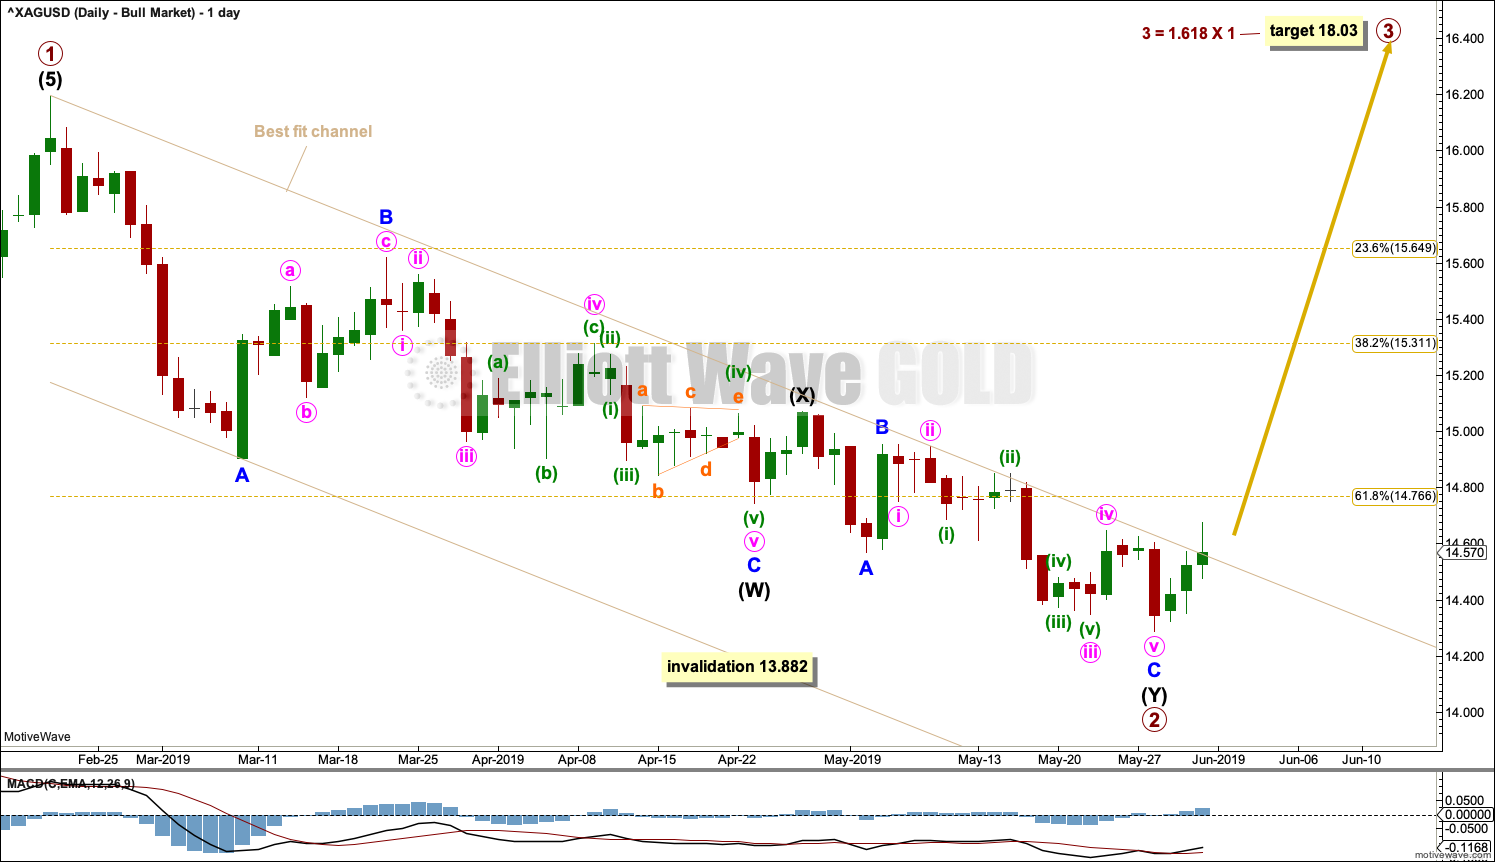
If cycle wave II is over, then the new trend up for cycle wave III should begin with a five wave structure. This is labelled primary wave 1. The structure may now be complete.
Five steps up should be followed by three steps back, labelled primary wave 2. Primary wave 2 may now be also complete as a double zigzag.
If it continues any further, then primary wave 2 may not move beyond the start of primary wave 1 below 13.882.
The best fit channel is drawn in the same way on both daily charts.
TECHNICAL ANALYSIS
WEEKLY CHART
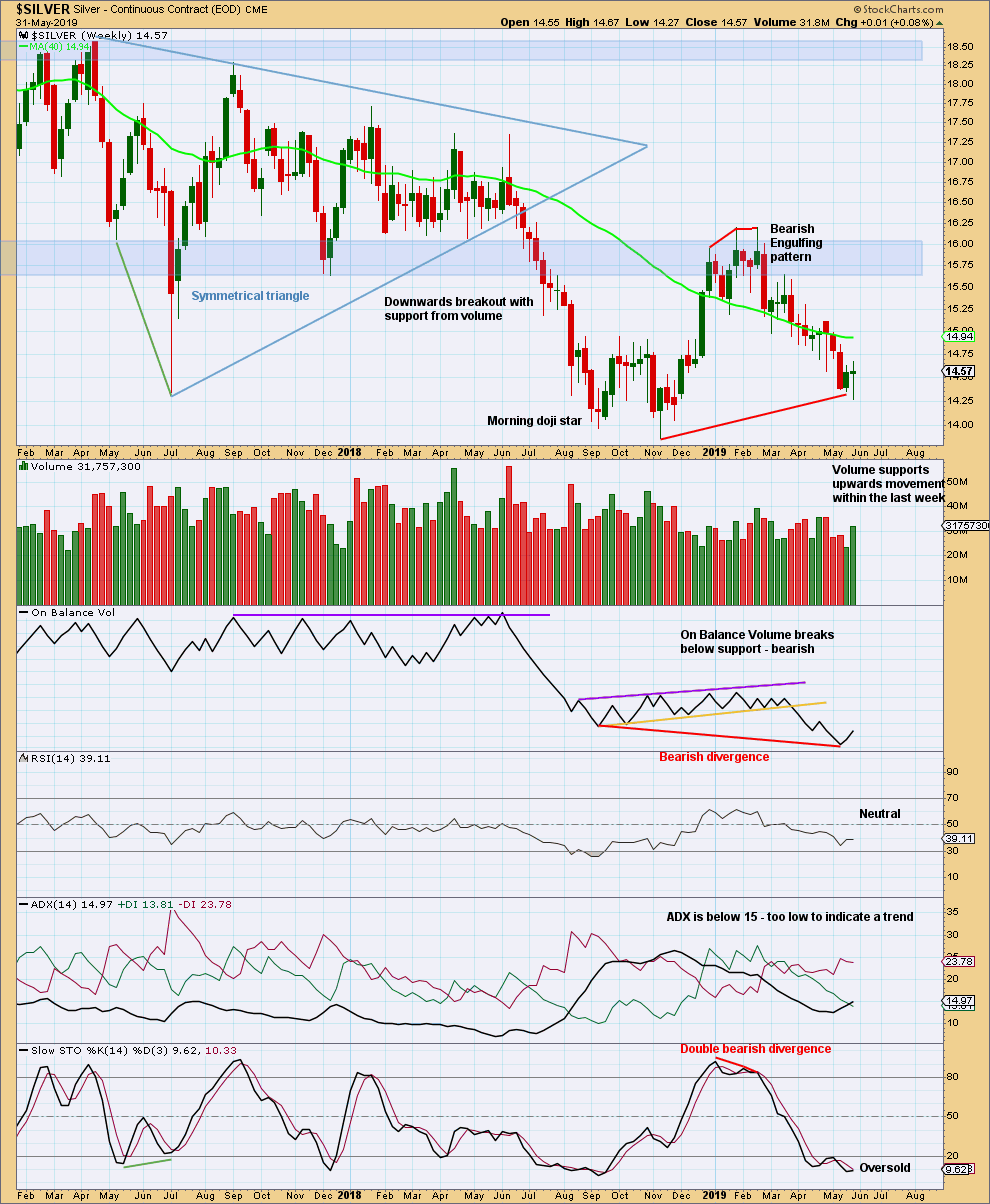
Click chart to enlarge. Chart courtesy of StockCharts.com.
Overall, Silver has been in a downwards trend since the high on the week beginning 19th February. ADX has not yet caught up and indicated a downwards trend, but if it rises to 15 (which is very close now) then it would do so.
An outside week this week closes as a Doji candlestick. This is overall neutral.
DAILY CHART
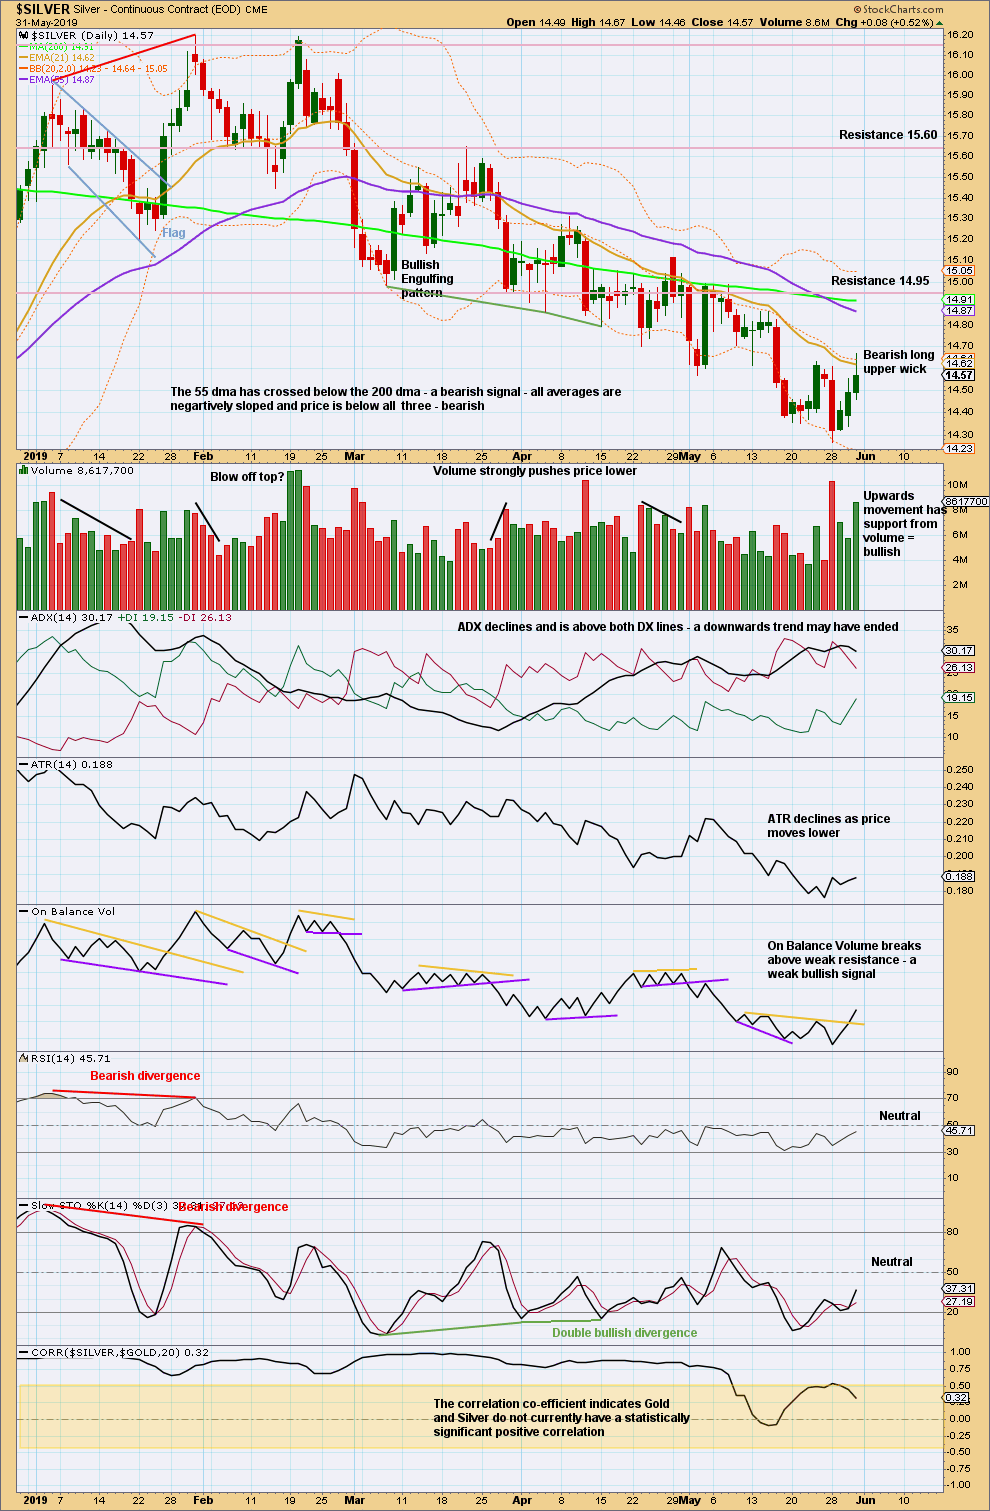
Click chart to enlarge. Chart courtesy of StockCharts.com.
There is now a series of multiple lower lows and lower highs from the high on the 31st of January.
The view of a downwards trend here should remain intact while the last swing high at 14.990 on the 8th of May remains intact.
The correlation coefficient is added to this week’s technical analysis chart to show the correlation between Gold and Silver. I am aware that their main wave counts currently diverge. This is acceptable. Gold and Silver do not always find major highs and lows at the same time. They can spend periods of time during which they do not exhibit a statistically significant correlation, and that is currently the case.
Published @ 10:03 p.m. EST on June 2, 2019.
—
Careful risk management protects your trading account(s).
Follow my two Golden Rules:
1. Always trade with stops.
2. Risk only 1-5% of equity on any one trade.
—
New updates to this analysis are in bold.
Hi Lara
I thought if put it over here, as a bit quieter on comments.
Have you got a general view on Bitcoin at this moment (I’m hoping I can short it down – lol)
Thank you