
A breach of 14.990 created the first higher high from the last major high on the 31st of January 2019. At that stage, it was possible there had been a trend change for Silver.
Summary: Upwards movement may continue next week. It may reach above 15.467.
A new high above 16.195 would still be required to have confidence in the very bullish alternate though. While price remains below this point, the main wave count will remain overall bearish.
Monthly charts were reviewed here.
ELLIOTT WAVE COUNTS
MAIN WAVE COUNT
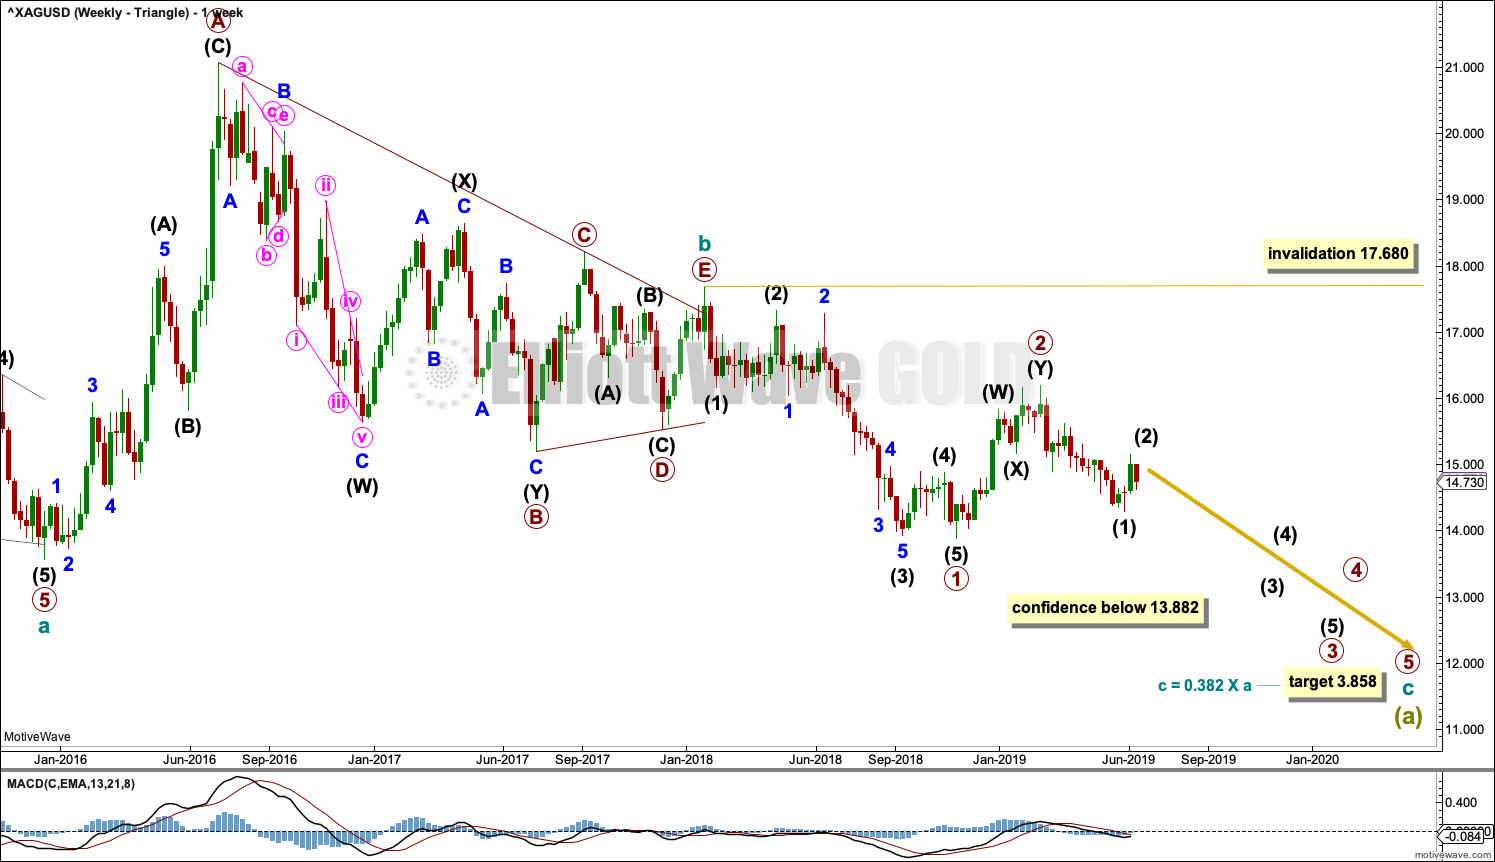
WEEKLY CHART – TRIANGLE
Click chart to enlarge.
The basic Elliott wave structure is five steps forward followed by three steps back. At this time, it is expected that Silver is within a very large three steps back pattern that began at the all time high in April 2011.
Three steps back are almost always labelled in Elliott wave as A-B-C. This Elliott wave count expects that wave A is incomplete, and this is labelled Super Cycle wave (a).
The Elliott wave structure for Super Cycle wave (a) may be a zigzag. Zigzags subdivide 5-3-5. Within this zigzag, cycle waves a and b may be complete. Cycle wave c must subdivide as a five wave Elliott wave structure, most likely an impulse.
Within the impulse of cycle wave c, if primary wave 2 continues higher, it may not move beyond the start of primary wave 1 above 17.680.
Within the zigzag of Super Cycle wave (a), it would be extremely likely for cycle wave c to move below the end of cycle wave a at 13.569 to avoid a truncation. The target would see this achieved.
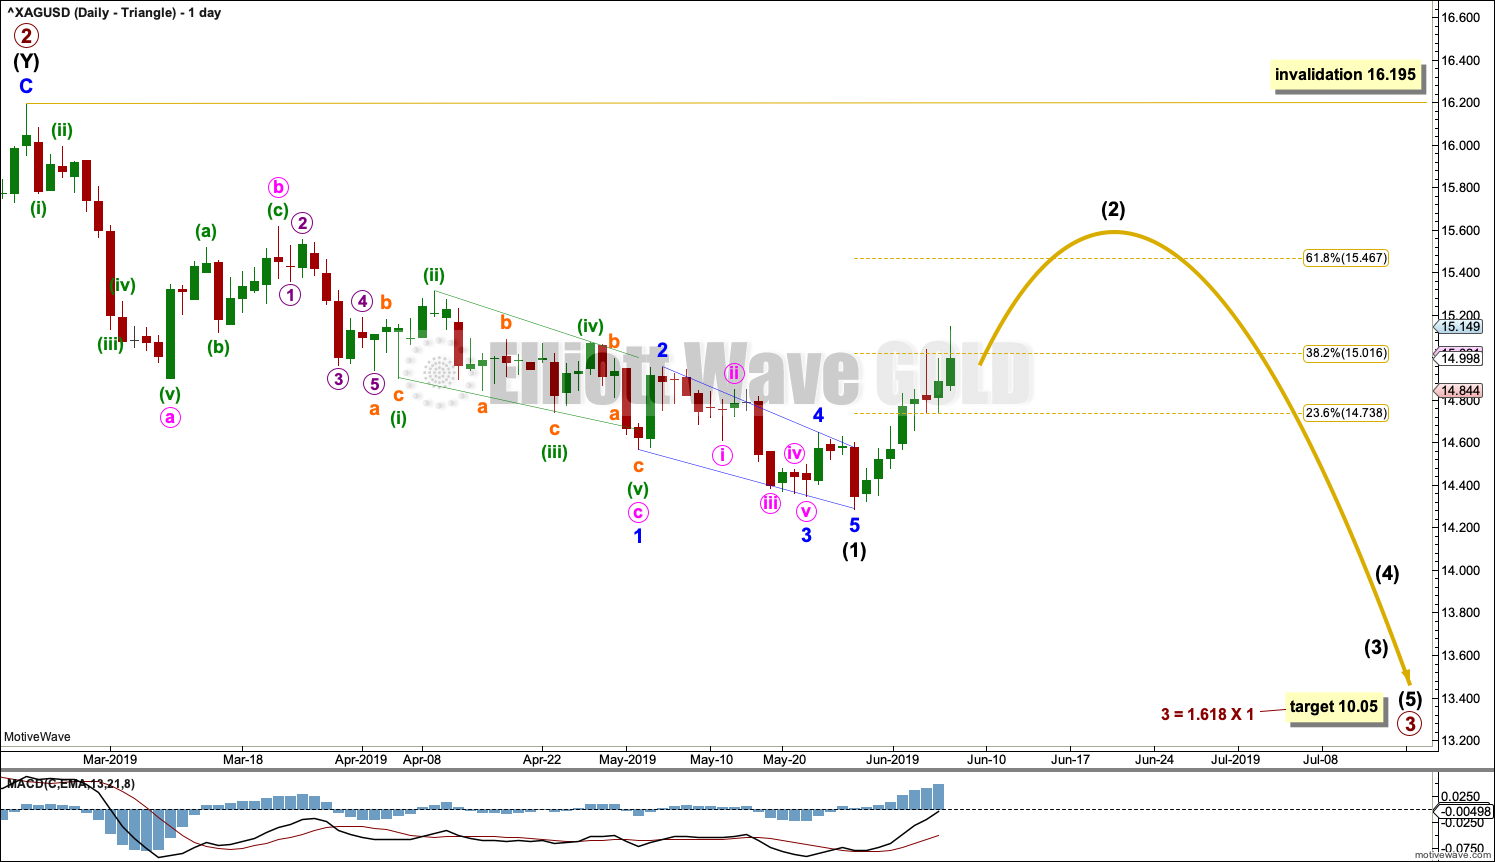
The daily chart below focusses on price movement from the end of primary wave 2.
DAILY CHART – TRIANGLE
Click chart to enlarge.
Primary wave 3 may only subdivide as a five wave impulse. Within this impulse, intermediate wave (1) may have been complete at the last low as a leading contracting diagonal.
Second wave corrections following leading diagonals in first wave positions tend to be very deep. Intermediate wave (2) may correct to the 0.618 Fibonacci ratio at minimum, and it may be reasonably deeper than this.
Intermediate wave (2() may not move beyond the start of intermediate wave (1) above 16.195.
ALTERNATE WAVE COUNT
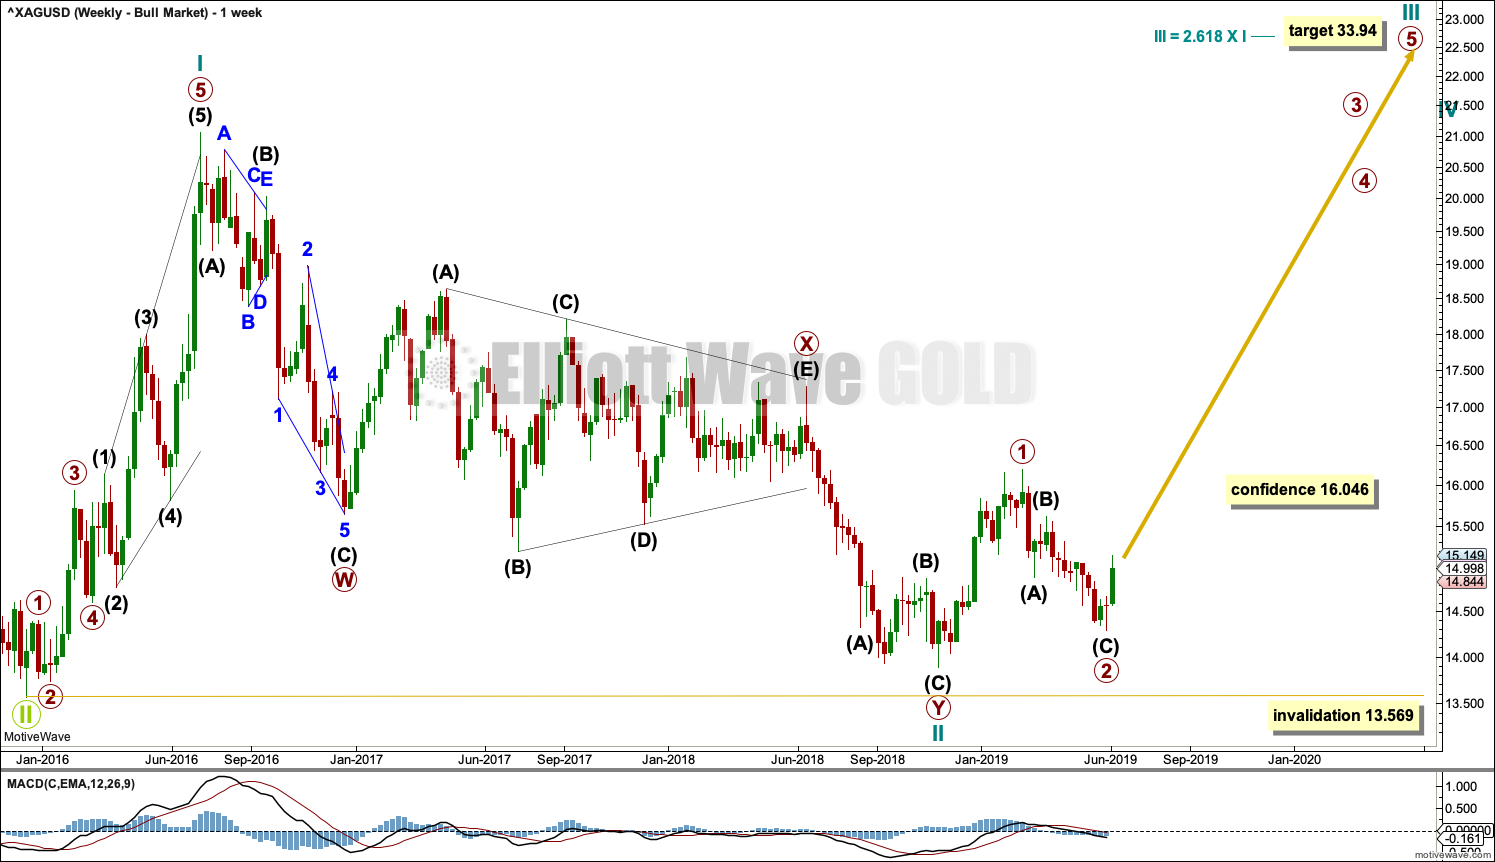
WEEKLY CHART – BULL WAVE COUNT
Click chart to enlarge.
This alternate Elliott wave count sees the three steps back pattern as complete and a new bull market beginning for Silver at the low in December 2015.
A new bull market should begin with a five wave structure upwards. This is labelled cycle wave I.
Following five steps forward should be three steps back. This is labelled cycle wave II. The Elliott wave corrective structure of cycle wave II is labelled as a double zigzag, which is a fairly common structure.
If it continues any further, then cycle wave II may not move beyond the start of cycle wave I below 13.569.
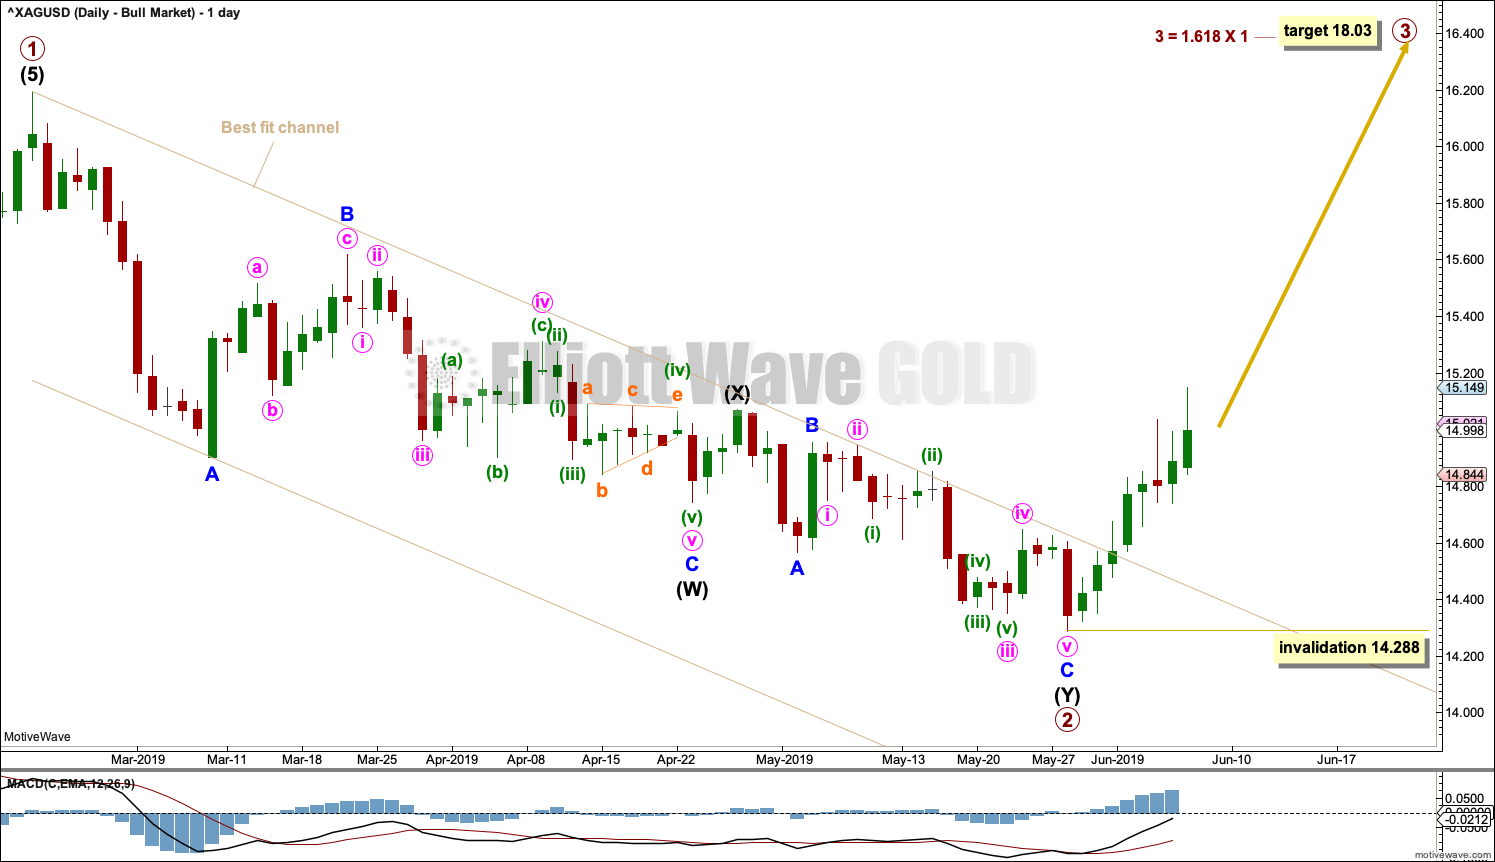
DAILY CHART – BULL WAVE COUNT
Click chart to enlarge.
If cycle wave II is over, then the new trend up for cycle wave III should begin with a five wave structure. This is labelled primary wave 1. The structure may now be complete.
Five steps up should be followed by three steps back, labelled primary wave 2. Primary wave 2 may now be also complete as a double zigzag.
A target is calculated for primary wave 3 that expects to exhibit a common Fibonacci ratio to primary wave 1. Within primary wave 3, no second wave correction may move beyond the start of its first wave below 14.288.
TECHNICAL ANALYSIS
WEEKLY CHART
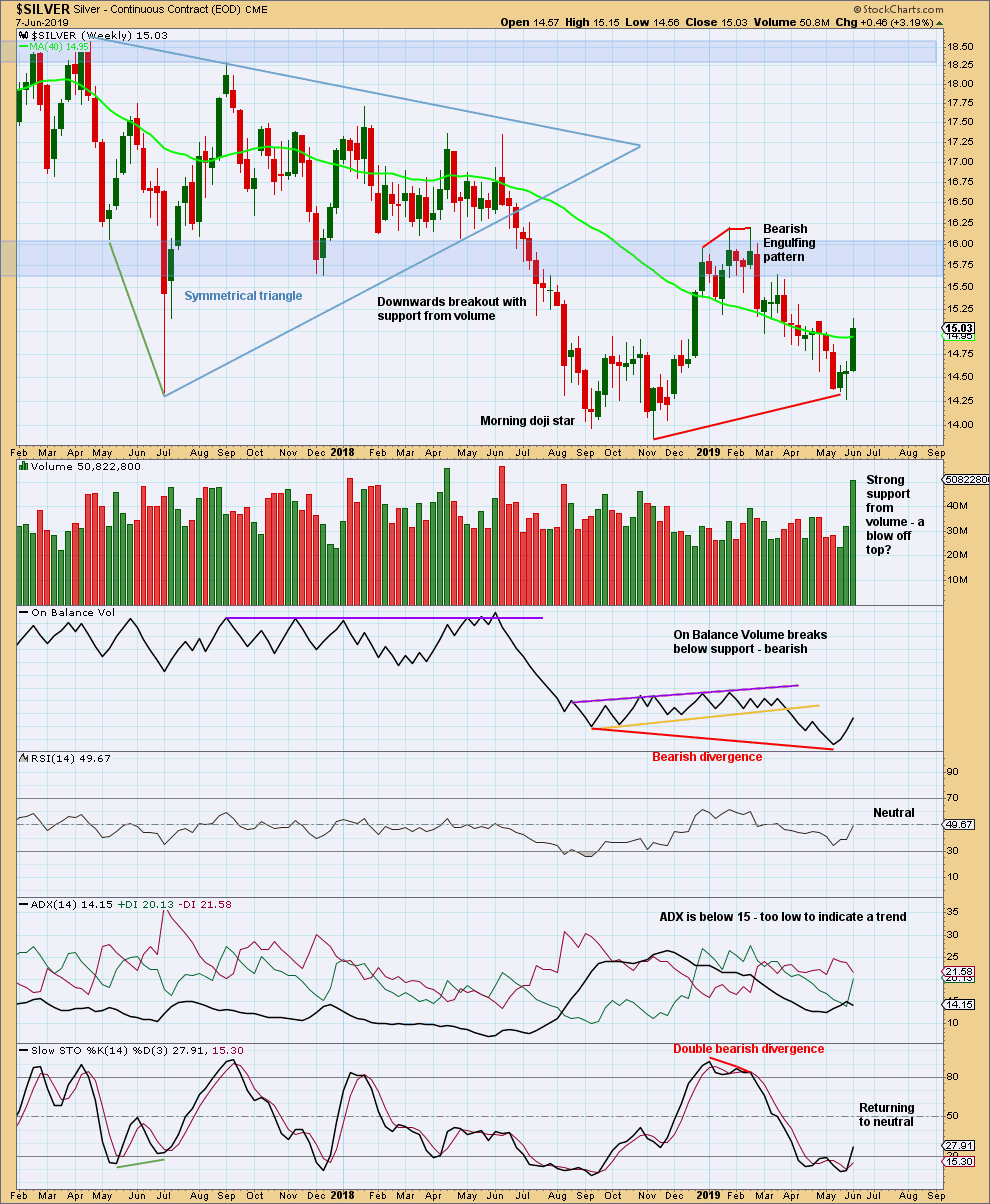
Click chart to enlarge. Chart courtesy of StockCharts.com.
Overall, Silver has been in a downwards trend since the high on the week beginning 19th February. The strong bullish candlestick this week may be an indication that this trend may be over. ADX does not yet indicate any trend change.
DAILY CHART
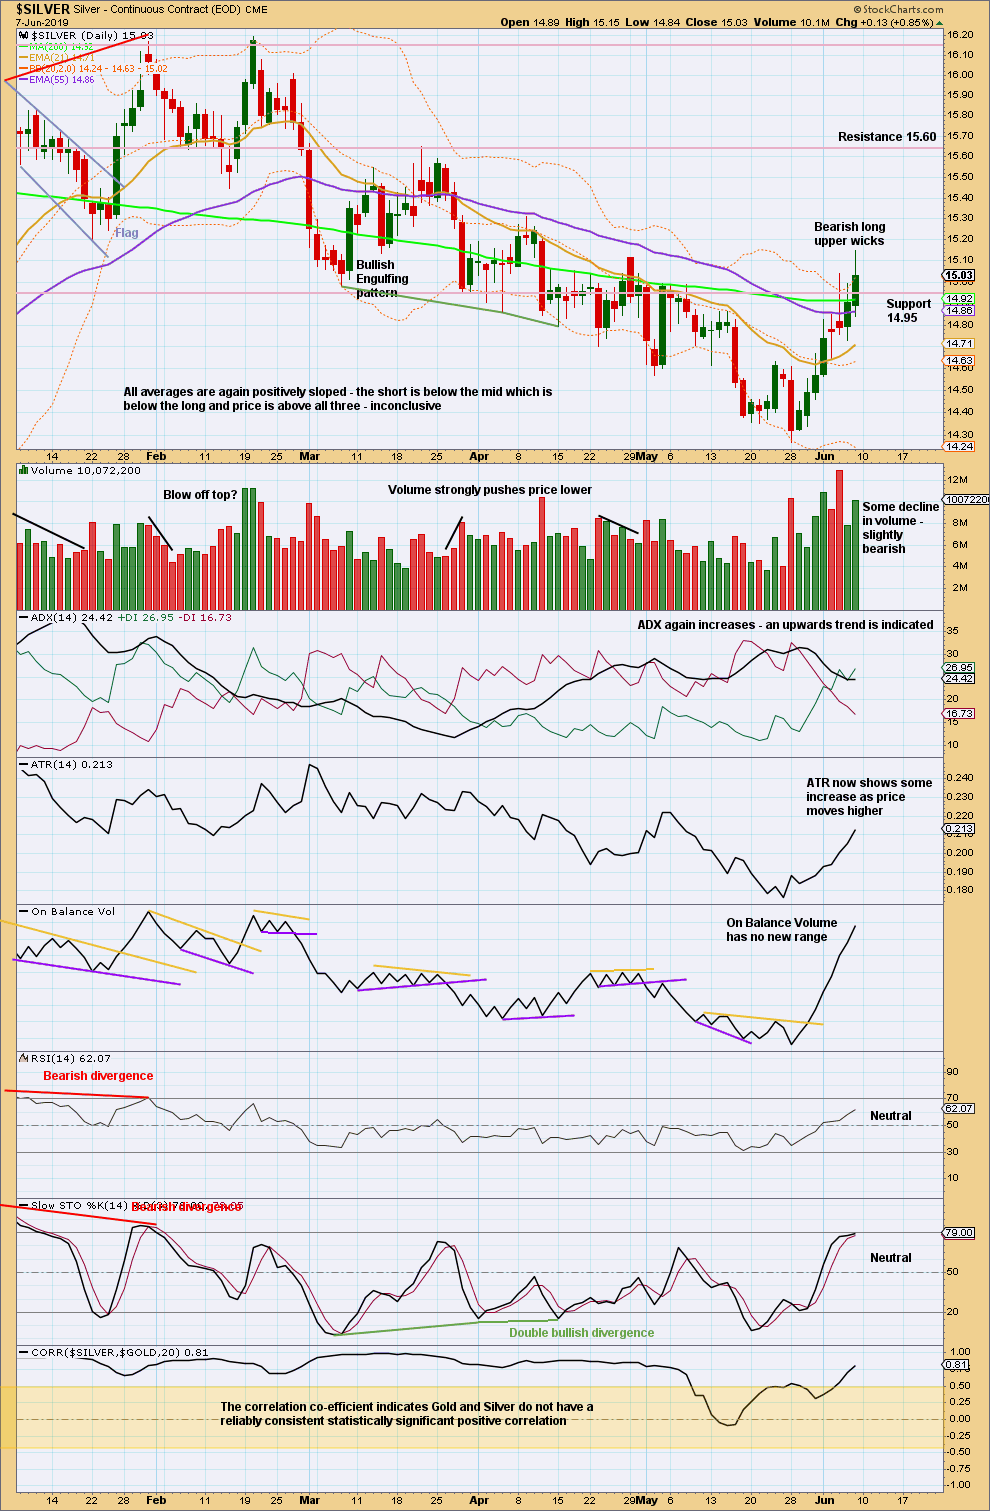
Click chart to enlarge. Chart courtesy of StockCharts.com.
The last swing high at 14.990 on the 8th of May has been breached; the series of lower lows and lower highs has been broken. It is possible that Silver has had a trend change. ADX agrees. ATR shows it has some strength.
The decline in volume and bearish upper wicks are of some concern here though.
The correlation coefficient is added to this technical analysis chart to show the correlation between Gold and Silver. I am aware that their main wave counts currently diverge. This is acceptable. Gold and Silver do not always find major highs and lows at the same time. They can spend periods of time during which they do not exhibit a statistically significant correlation.
Published @ 10:17 p.m. EST.
—
Careful risk management protects your trading account(s).
Follow my two Golden Rules:
1. Always trade with stops.
2. Risk only 1-5% of equity on any one trade.
—
New updates to this analysis are in bold.
Lara, fyi. The placement of Intermediate waves 1&2 within Primary 3 in your main Weekly count do not match the main Daily count. 🧐
Hmmm…. on my main weekly chart I have intermediate (1) ending at 14.288 on the week beginning 26th May. I have intermediate (2)… floating, incomplete.
On my main daily chart I have intermediate (1) ending at 14.288 on 28th of May, and intermediate (2) floating, incomplete.
So, they look the same to me? What am I missing Dreamer?
This?
Oh no, you’re absolutely right Dreamer.
I did fix that… but then neglected to upload the corrected chart.
Will do that now.
Thanks. At least I’m not going crazy…