
Two Elliott wave counts remain. The preferred count is bearish and the alternate is bullish.
Summary: The bearish Elliott wave count expects a new high to 101.13 and then a trend change. The bullish Elliott wave count expects some downwards movement to 93.24 and then a resumption of the upwards trend.
The price point which differentiates the two counts is 88.25. A new low below this point would invalidate the bullish count and provide confidence in the bearish count.
To the upside, only a new high now above 103.82 would invalidate the bearish count and provide confidence in the bullish count.
BEARISH ELLIOTT WAVE ANALYSIS
QUARTERLY CHART
Click chart to enlarge.
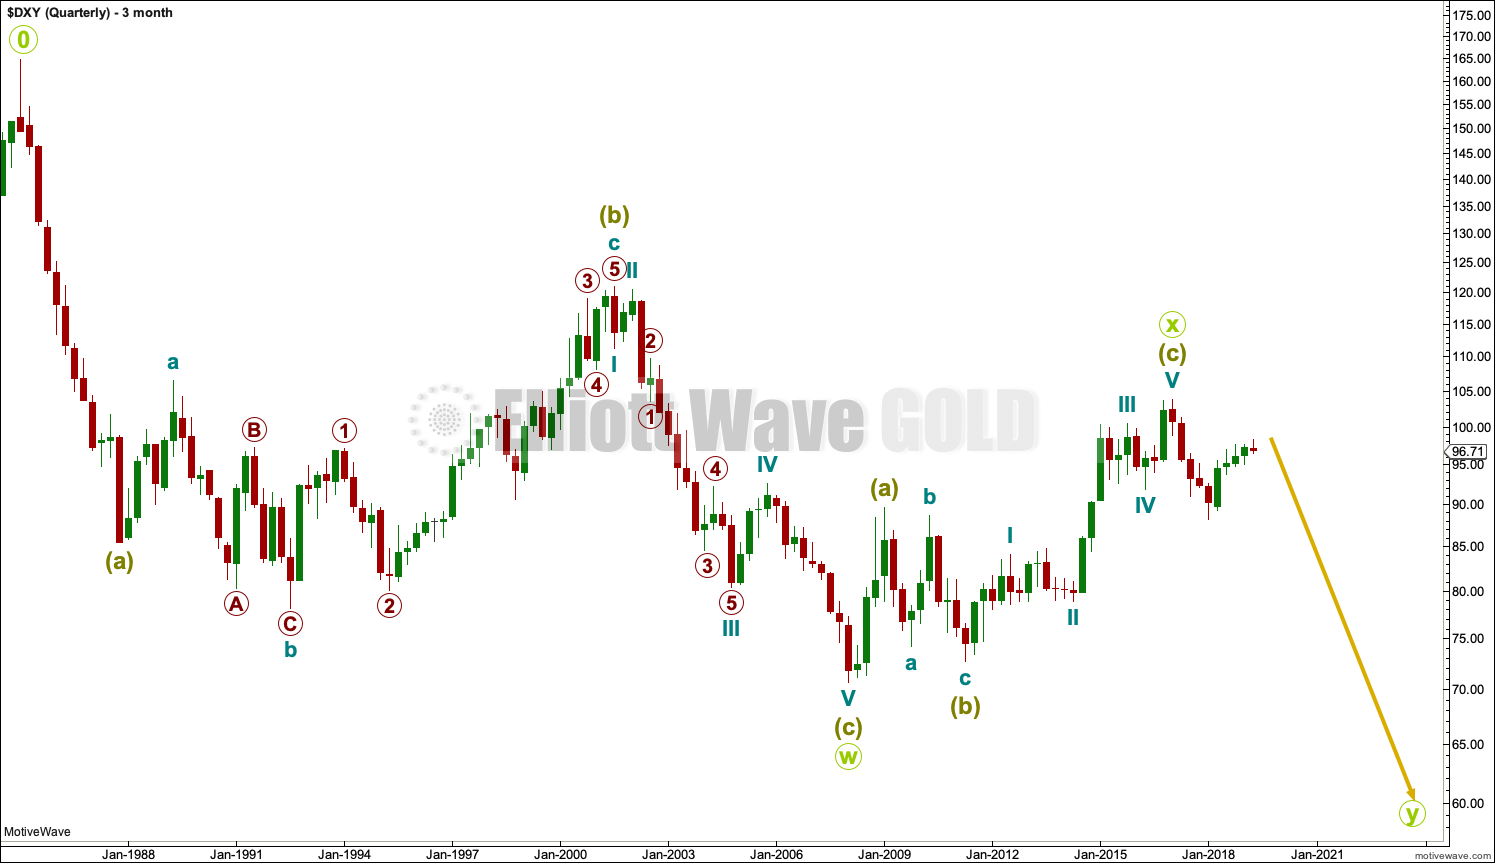
The wave count begins at 0.
This wave count assumes that the high labelled 0 ended a five wave impulse up. The Elliott wave structure of five steps forward should be followed by three steps back.
A huge double zigzag may be continuing lower.
MONTHLY CHART
Click chart to enlarge.
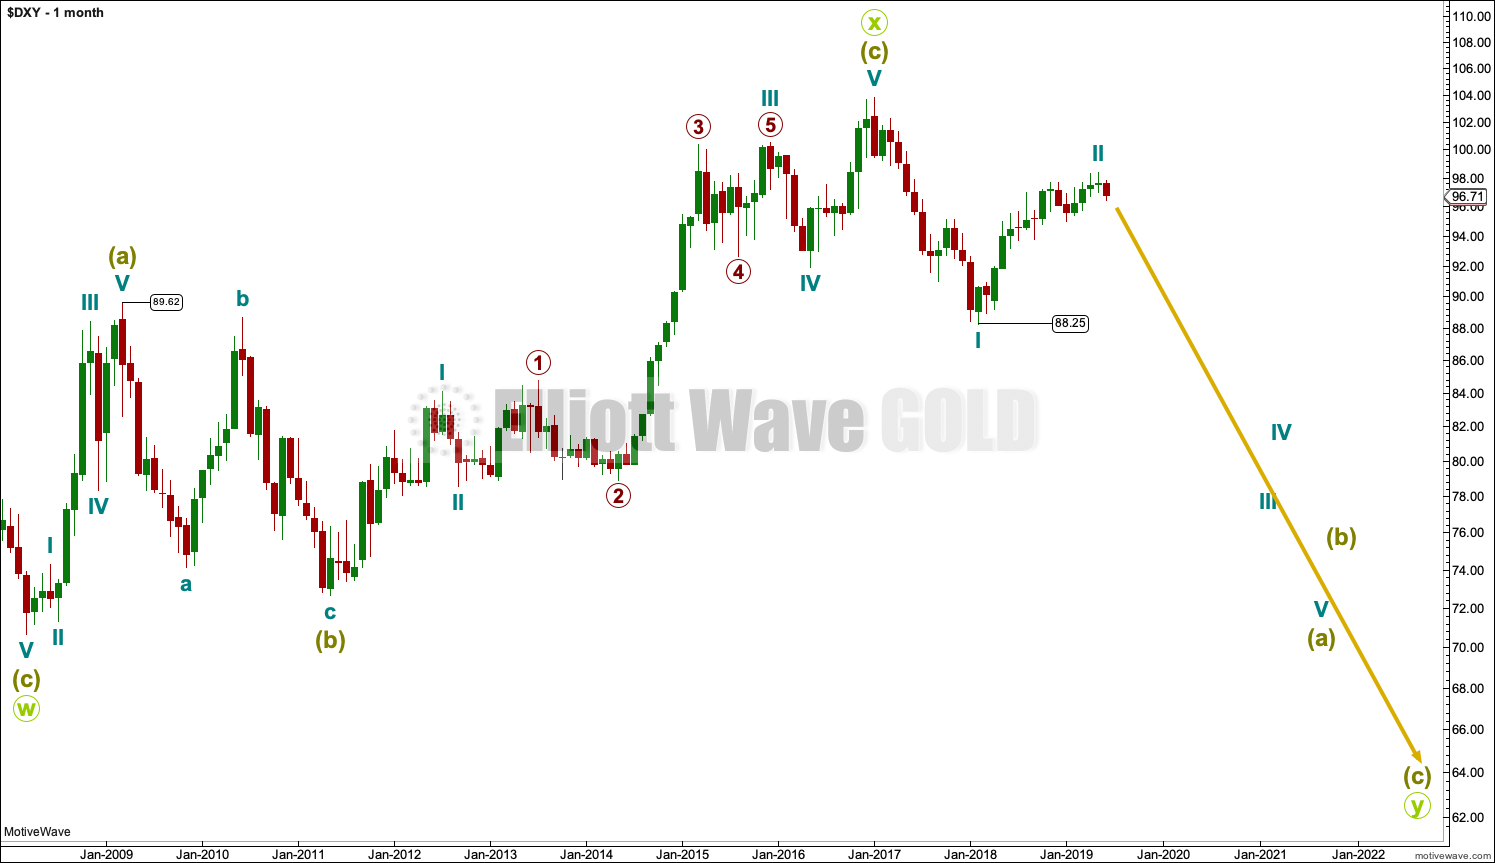
Downwards movement from the high in January 2017 cannot be a fourth wave correction within an ongoing impulse higher because a new low below 89.62 would be back in first wave price territory.
That indicates the last big wave up may be a completed three, and for that reason this is my slightly preferred wave count.
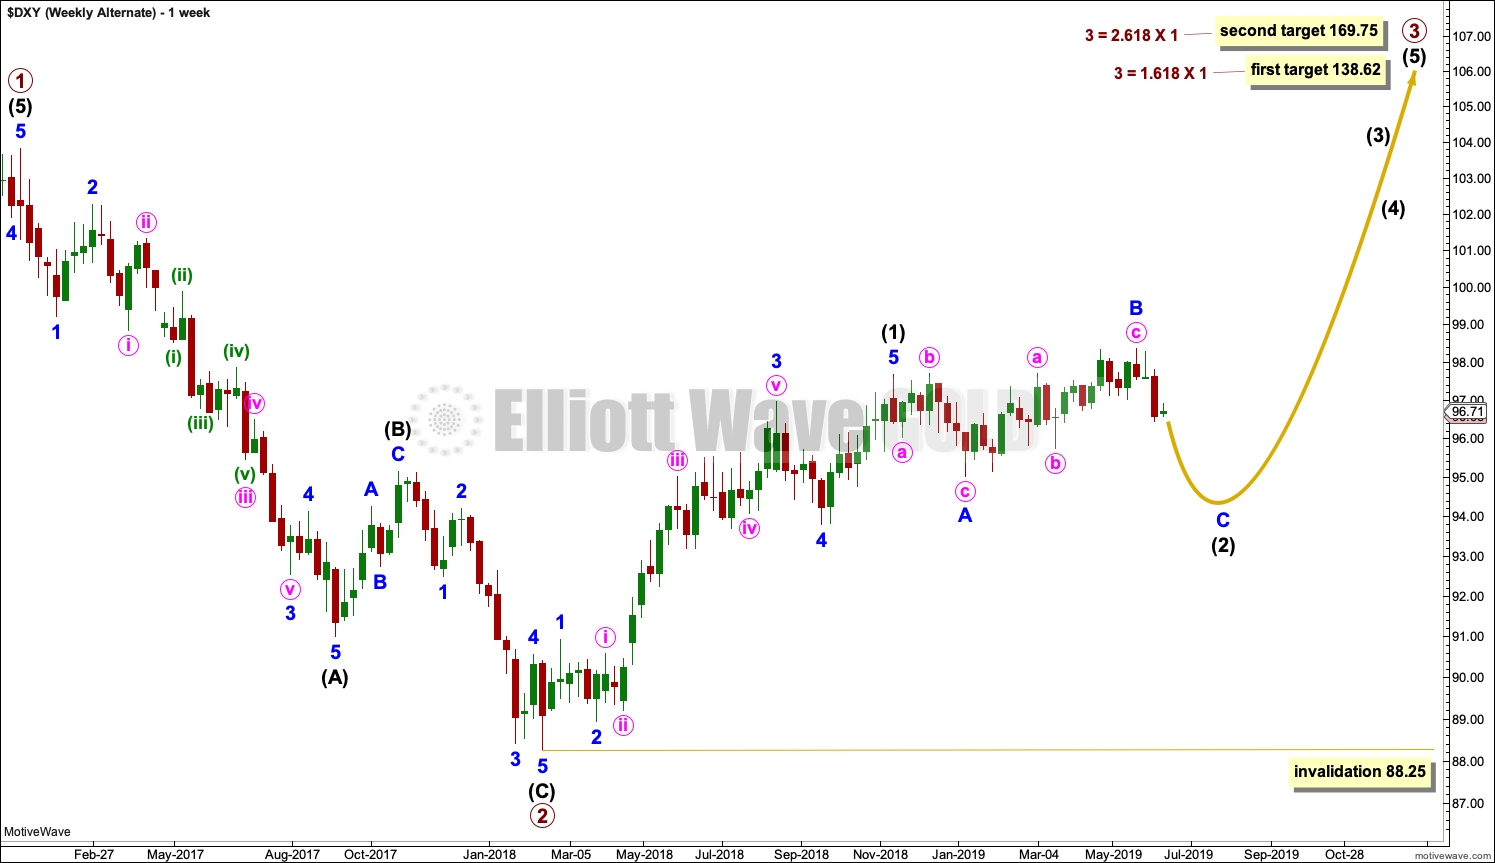
WEEKLY CHART
Click chart to enlarge.
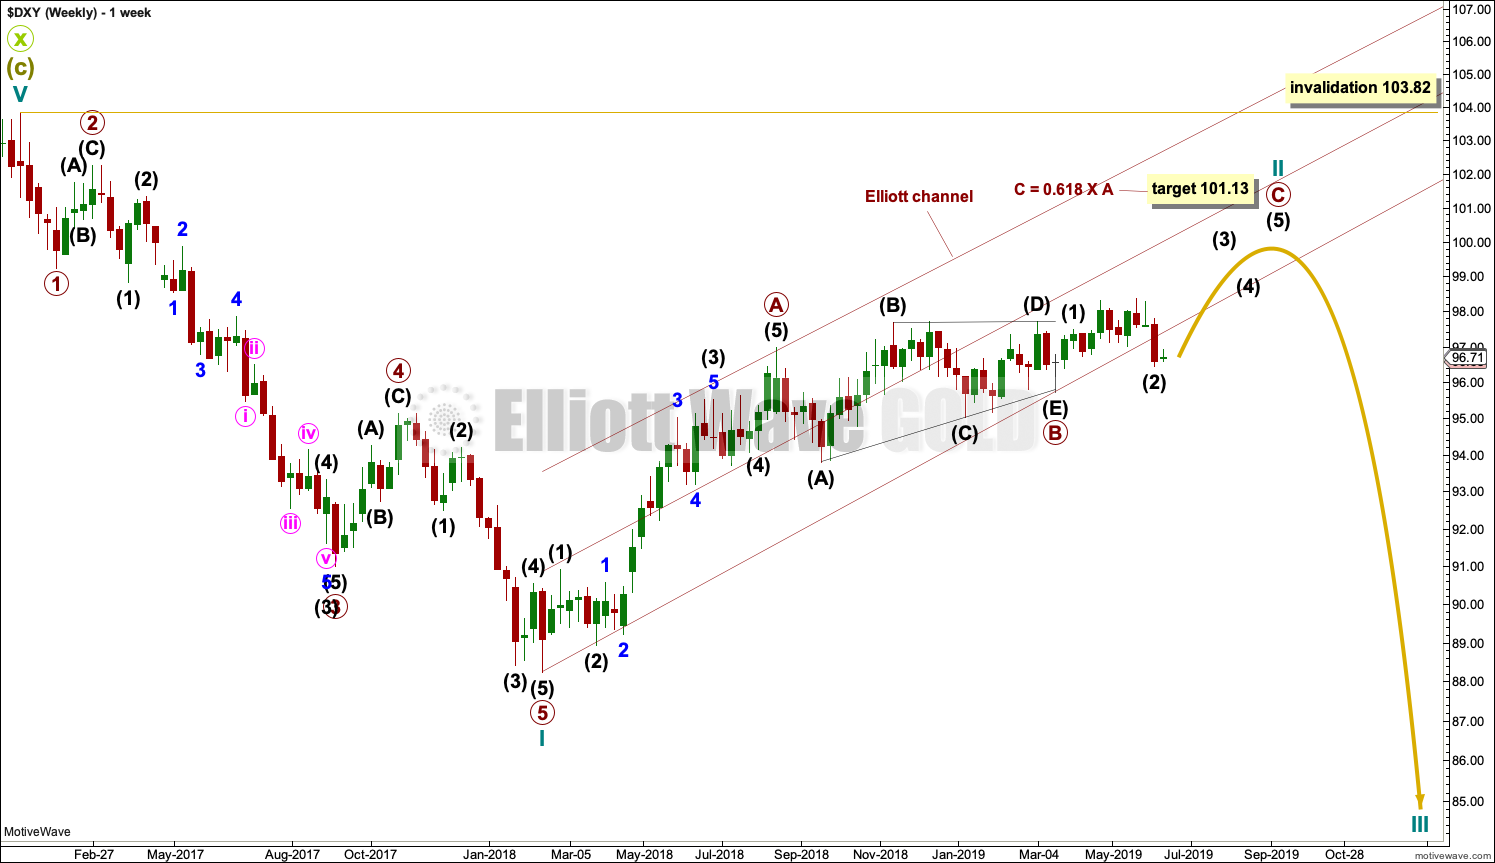
Cycle wave I downwards fits very well as a five wave impulse. This may be reasonably expected to be followed by a three wave structure upwards.
For the USD Index, historically the first second wave correction within a new trend is usually extremely deep, about 0.80 to 0.90 of the first wave it corrects. It would be typical here to see Cycle wave II reach to 0.80 or deeper of cycle wave I.
Cycle wave II may be unfolding as a zigzag, which is the most common type of corrective structure.
Primary wave A may be a completed five wave impulse.
Primary wave B may be a completed running barrier triangle.
Primary wave C must subdivide as a five wave structure, either an impulse or an ending diagonal. An impulse is much more common. It is not possible to see primary wave C complete at the last high, so overall some more upwards movement for this wave count is expected to complete the structure.
Cycle wave II may not move beyond the start of cycle wave I above 103.82.
Draw a channel about cycle wave II as shown. This is Elliott’s technique for a correction. Primary wave C may end either mid way within the channel or about the upper edge.
A target is calculated for primary wave C to end.
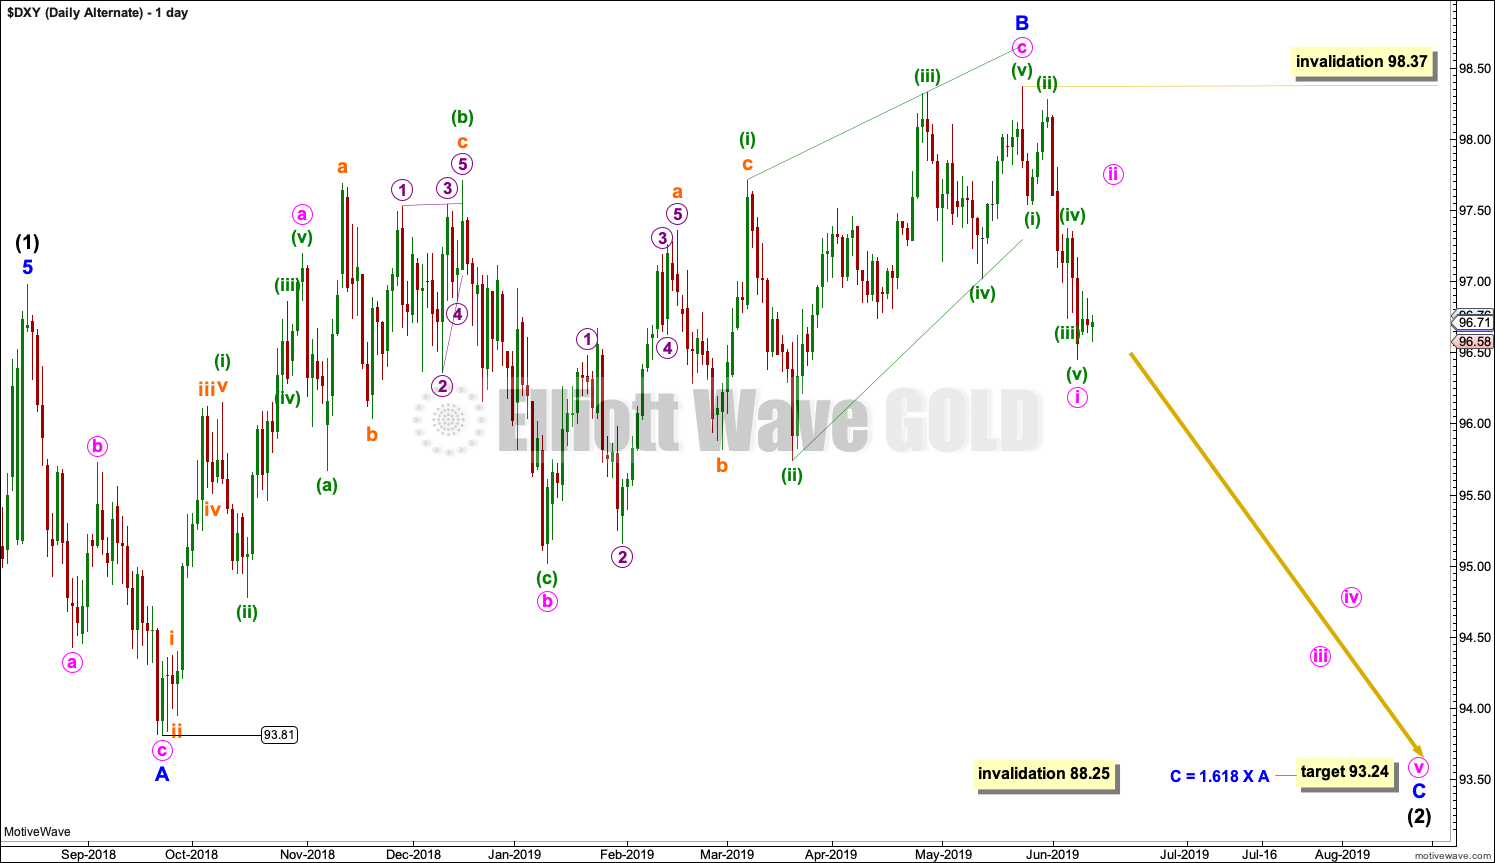
DAILY CHART
Click chart to enlarge.
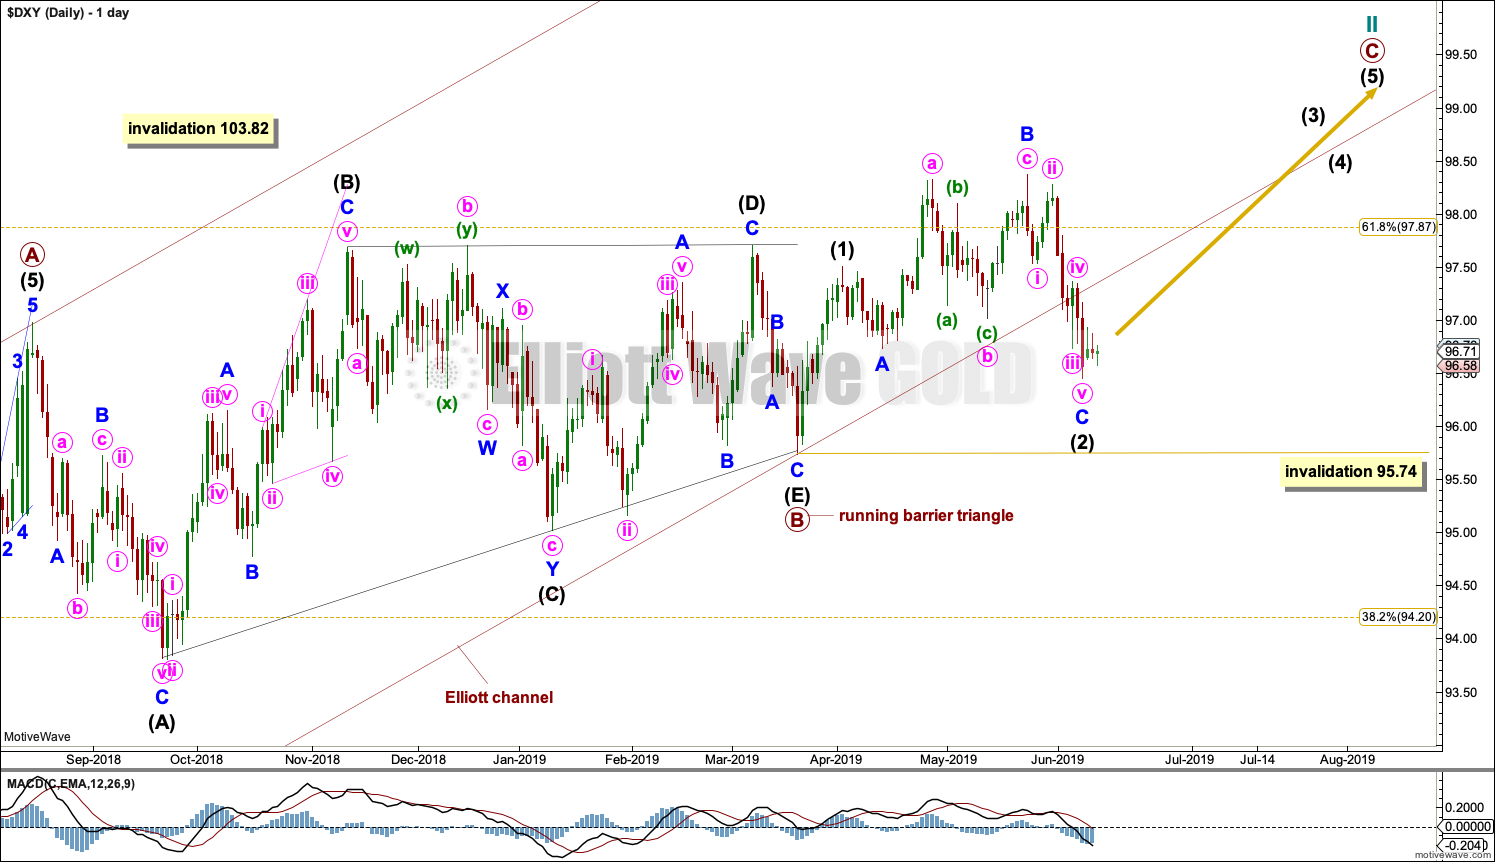
Primary wave C may be unfolding as an impulse. At this stage, I cannot see a complete structure over at the last high.
Within primary wave C, intermediate wave (2) may be an incomplete expanded flat correction. These are fairly common structures. Intermediate wave (2) may not move beyond the start of intermediate wave (1) below 95.74.
BULLISH ELLIOTT WAVE ANALYSIS
QUARTERLY CHART
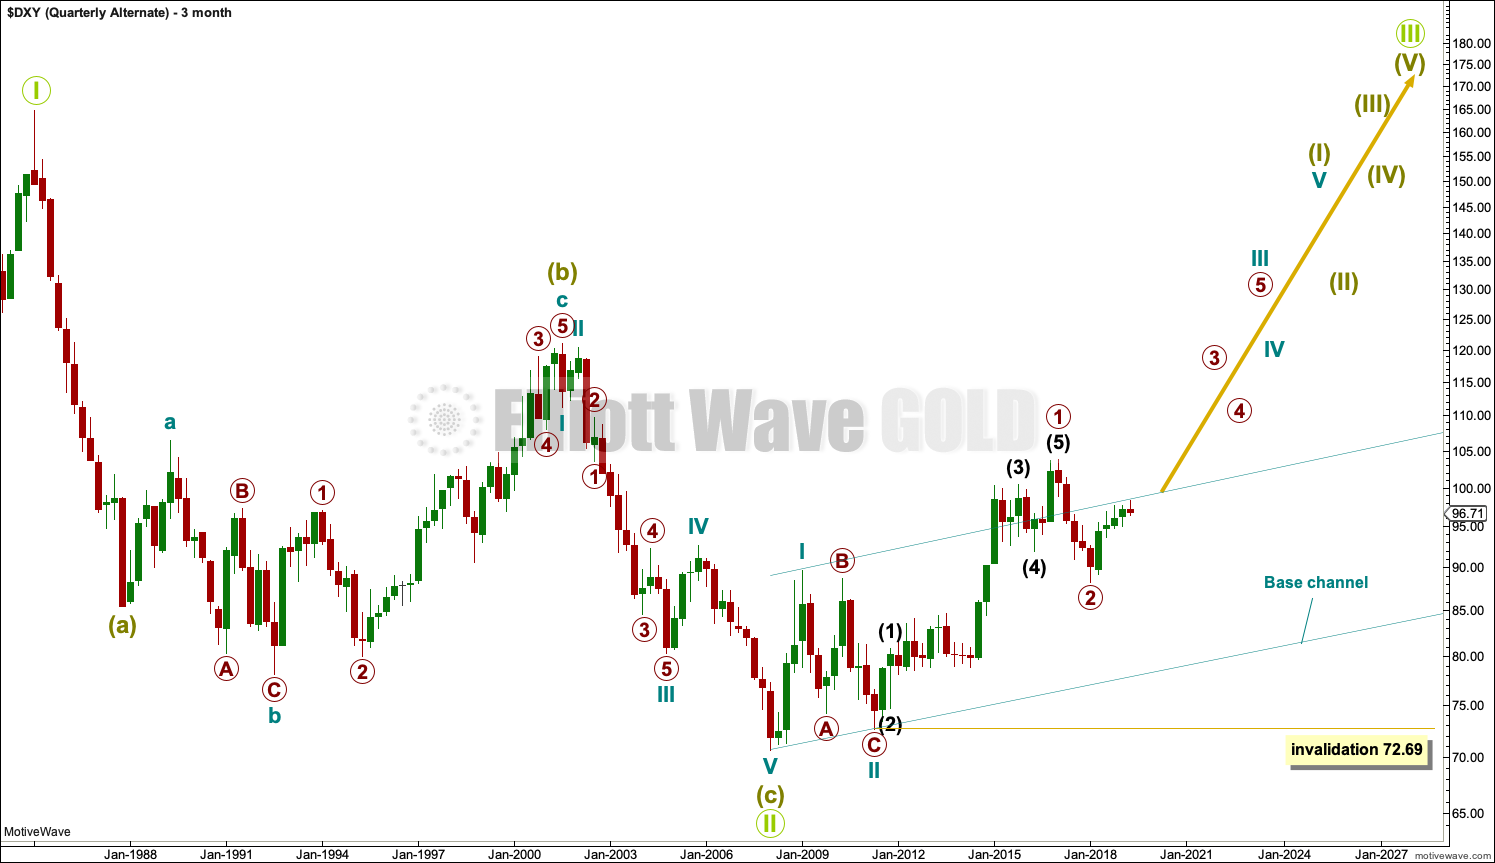
Click chart to enlarge.
A single zigzag down to the last major low may still be complete.
A new upwards trend may continue. So far there may be two overlapping first and second waves. Primary wave 2 may not move beyond the start of primary wave 1 below 72.69.
Primary wave 2 should find strong support at the lower edge of the teal base channel if it gets down that low.
MONTHLY CHART
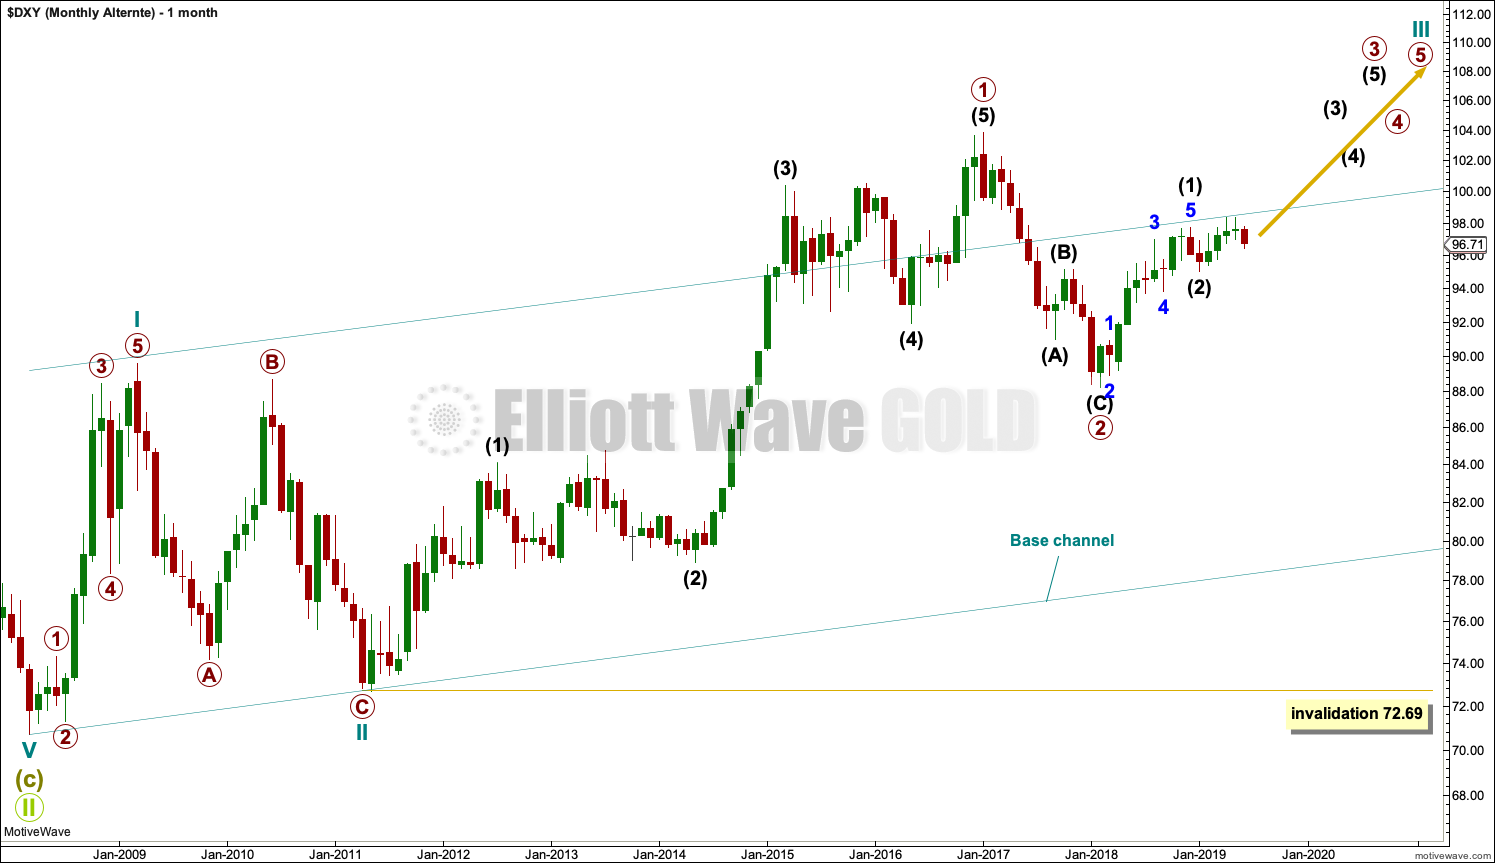
Click chart to enlarge.
Primary wave 2 may be a complete zigzag. However, this wave down can also be seen as a five and primary wave 2 may yet continue lower.
WEEKLY CHART
Click chart to enlarge.
This bullish wave count sees the last wave down as a completed zigzag. If this is correct, then within primary wave 3, intermediate wave (2) may not move beyond intermediate wave (1) below 88.25.
DAILY CHART
Click chart to enlarge.
Intermediate wave (2) may be an incomplete expanded flat. The first wave down within it is labelled minor wave A, which is a complete zigzag. Minor wave B may now be complete at 1.44 the length of minor wave A, which is a little beyond the most common range for B waves of flats of 1 to 1.38 times the length of their A waves.
Minor wave C may move below the end of minor wave A at 93.81 to avoid a truncation. A target is calculated for minor wave C to reach the most common Fibonacci ratio to minor wave A within an expanded flat correction.
TECHNICAL ANALYSIS
MONTHLY CHART
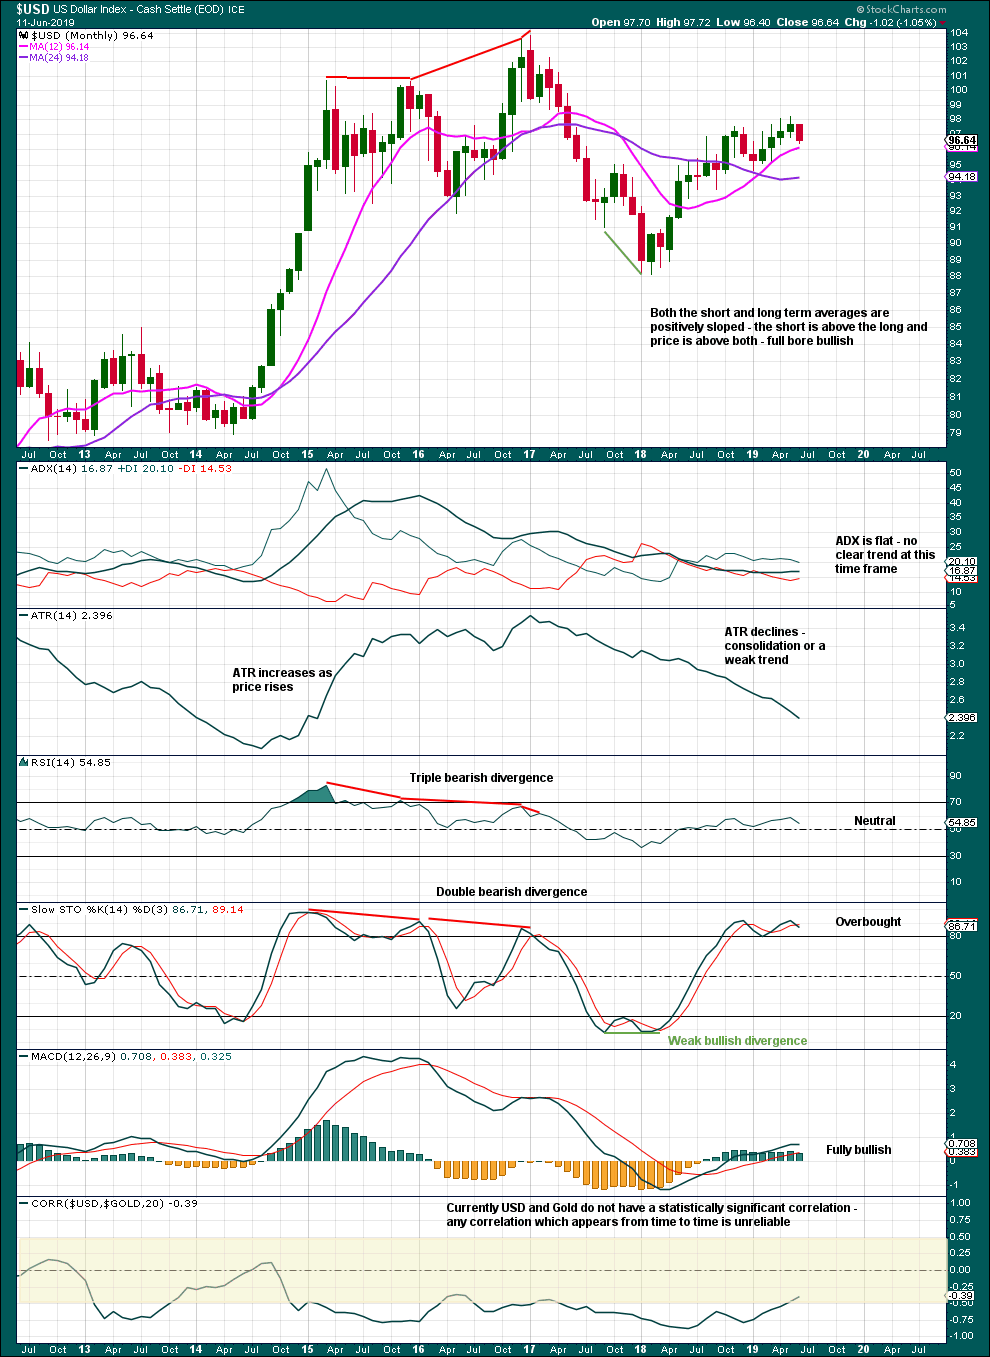
Click chart to enlarge. Chart courtesy of StockCharts.com.
The month of June is incomplete and so no conclusion may be drawn from this candlestick.
Declining ATR indicates some weakness in upwards movement.
DAILY CHART
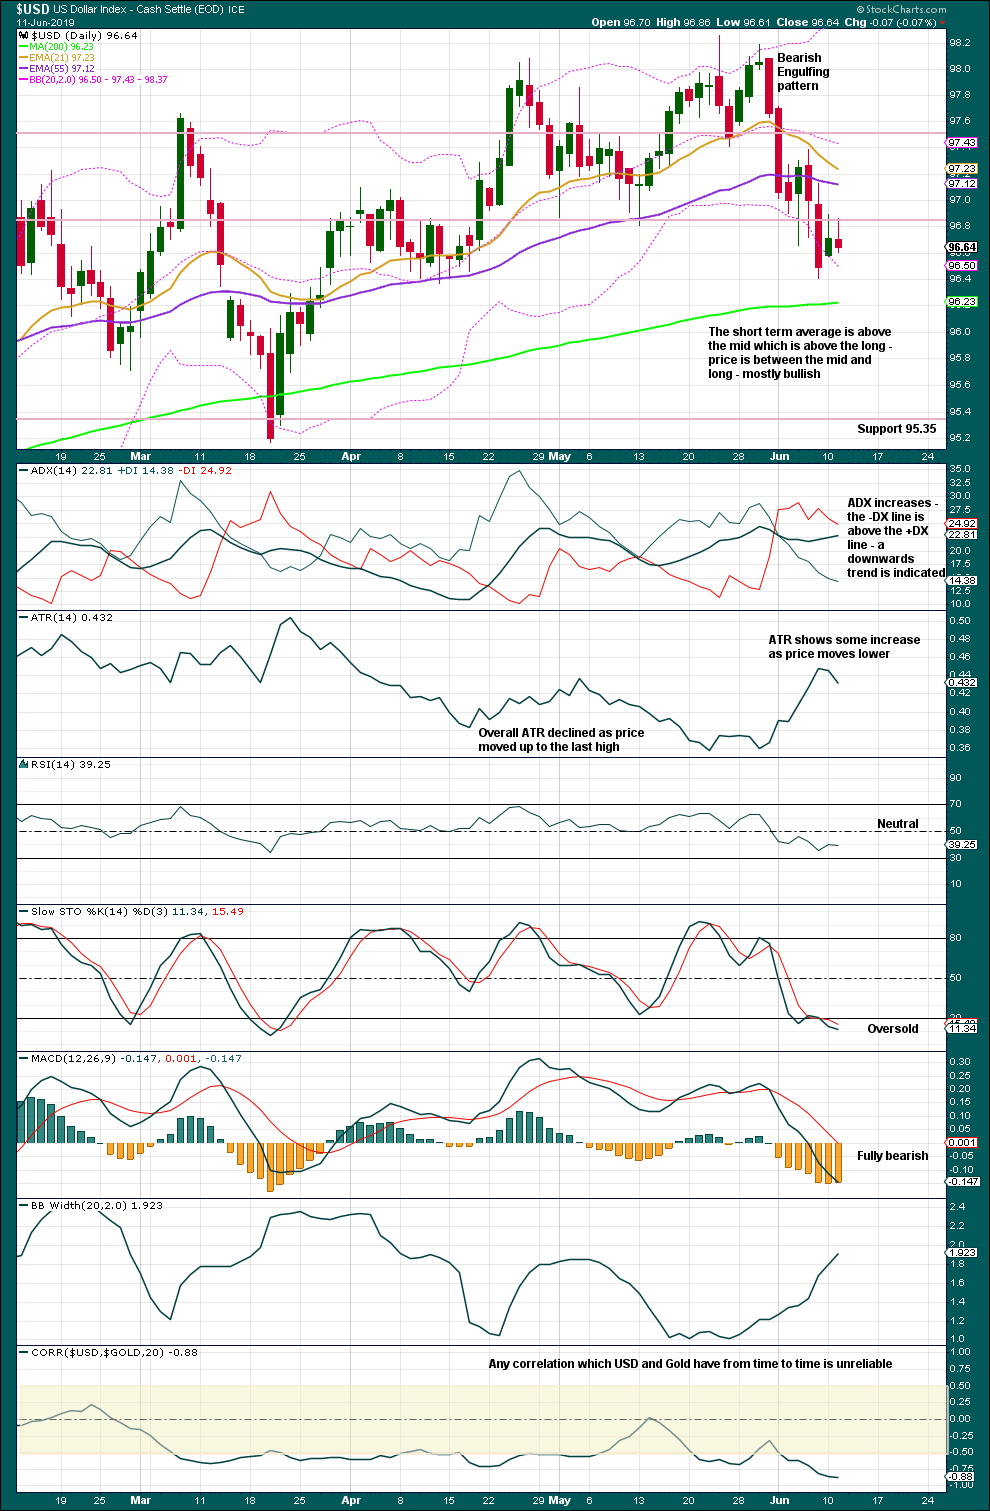
Click chart to enlarge. Chart courtesy of StockCharts.com.
The Bearish Engulfing candlestick of the 31st of May is now followed by some downwards movement. There is some strength in this downwards movement with increasing ATR. The safest approach may be to expect it to continue until there is evidence of a reversal. That evidence may come with a bullish candlestick reversal pattern or a new swing high above 97.39.
Published @ 8:45 p.m. EST.
—
Careful risk management protects your trading account(s).
Follow my two Golden Rules:
1. Always trade with stops.
2. Risk only 1-5% of equity on any one trade.
—
New updates to this analysis are in bold.
This analysis proved rather difficult, and it had me stumped for a day or so. Which is one reason why it took longer than I hoped. Sometimes I find if I sleep on the problem it gets clearer. Yeah, I’m such a geek I actually sometimes dream Elliott wave.
For the bearish count: on the daily chart, once I considered a triangle for primary wave B I then had the problem of primary wave C not fitting as a complete five at the last high. That was the bit that had me stumped. If it can’t be seen as a complete five, then obviously it’s incomplete. The solution was an expanded flat for intermediate (2). Now the upwards movement from 12th April to 23rd May may be seen as a B wave, and it’s labelled minor wave B. This fits.
For the bullish count I did this second. And so it flowed much easier.
Thank you Lara. Funny that you dream Elliott waves – in color?? 🙂 I follow your advise of reviewing the summary of Rules and Guidelines as I fall asleep, no dreams yet !!
I never would have thought of a running barrier triangle, nifty. I was thinking of wxy without much success, as it never seemed to end and I kept enlarging the ‘y’ leg. Then I went with an ending diagonal without much success and finally gave up! Learnt something new.
Sincerely appreciate all your help, geek !!
Dave