
A small range inside day leaves all three Elliott wave counts valid.
Summary: A strong downwards day for Friday with a strong push from volume suggests the back test may be incomplete (or the bearish Elliott wave count may be correct). Look out now for another test of support to relieve extreme conditions. Support is about 1,360 to 1,385.
If price breaks back below support with some strength this week, that would favour the bearish Elliott wave count. The target would then be at 1,345 for the short term.
The bullish wave count has a long-term target at 1,693 for cycle wave III to end.
A new low by any amount at any time frame now below 1,346.45 would invalidate the bullish wave count and give confidence to the bearish wave count.
Grand SuperCycle analysis is here.
Last monthly charts are here.
Overall, the bearish wave counts still have a higher probability based upon Elliott wave structures. However, it would be best to leave price to invalidate either the bullish or bearish scenario before having confidence in which is correct.
BEARISH ELLIOTT WAVE COUNTS
FIRST WEEKLY CHART
Click chart to enlarge.
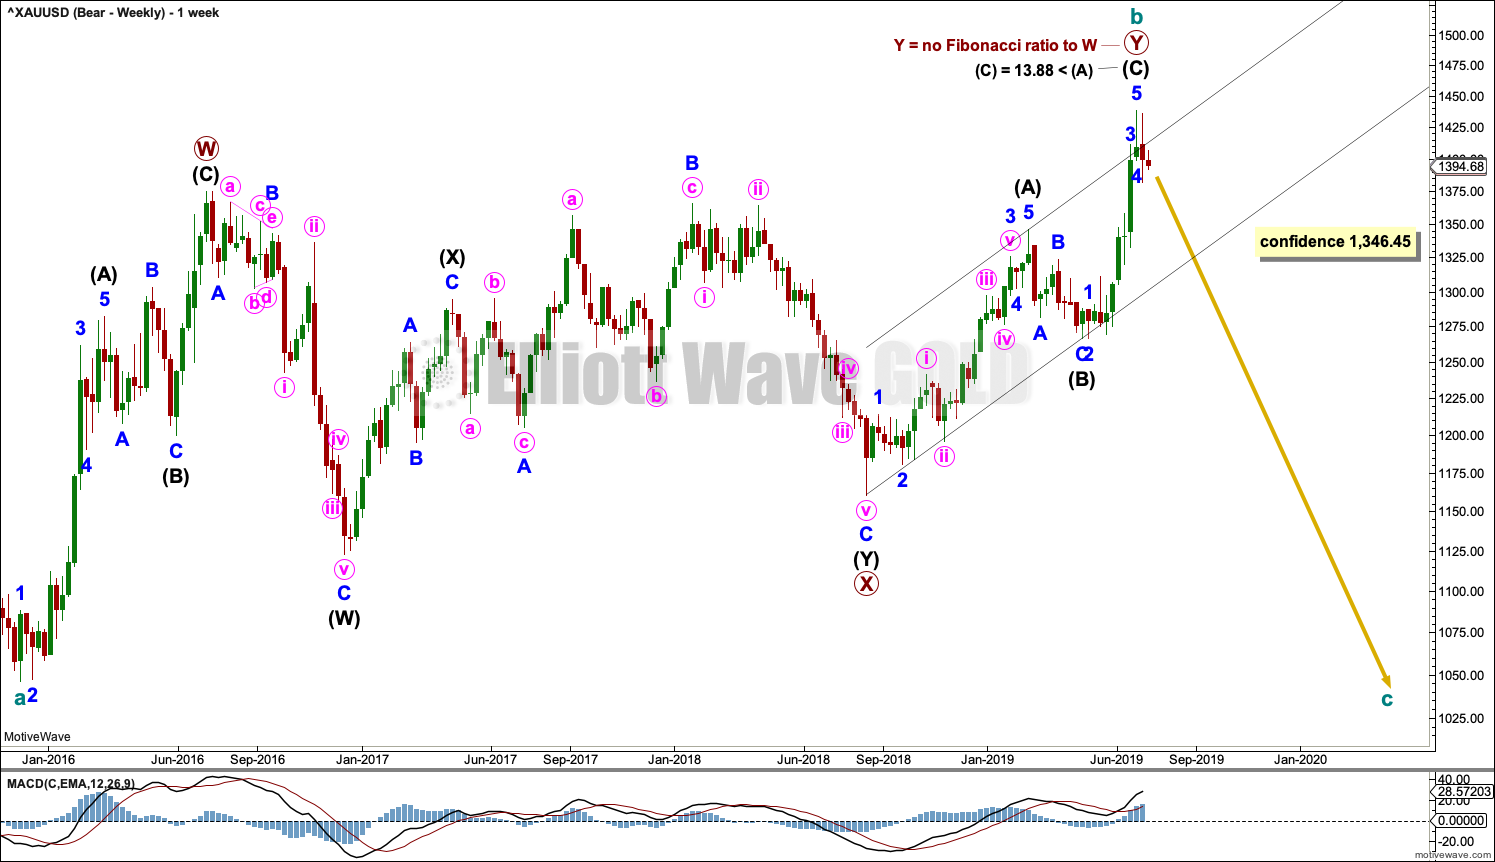
It remains possible that the bear market for Gold may yet continue when cycle wave b is complete, and it is possible that cycle wave b may be complete at the high. Cycle wave b may be a double zigzag.
Double zigzags are common structures, but within them their X waves are almost always single zigzags that are relatively brief and shallow. However, X waves may be any corrective structure, including a multiple.
The maximum number of corrective structures in a multiple is three. This count of three refers to W, Y and Z. To label any one of W, Y or Z as multiples violates this Elliott wave rule. However, X waves may be labelled as multiples and here the rule is met. X waves do occasionally subdivide as multiples.
This wave count sees primary wave X as a complete double combination: zigzag – X – expanded flat.
Primary wave Y may be a complete zigzag. The purpose of a second zigzag in a double zigzag is to deepen the correction when the first zigzag does not move price far enough. This purpose has been achieved.
A new low now by any amount at any time frame below 1,346.45 would invalidate the bullish wave count below and provide some confidence in this wave count.
DAILY CHART
Click chart to enlarge.
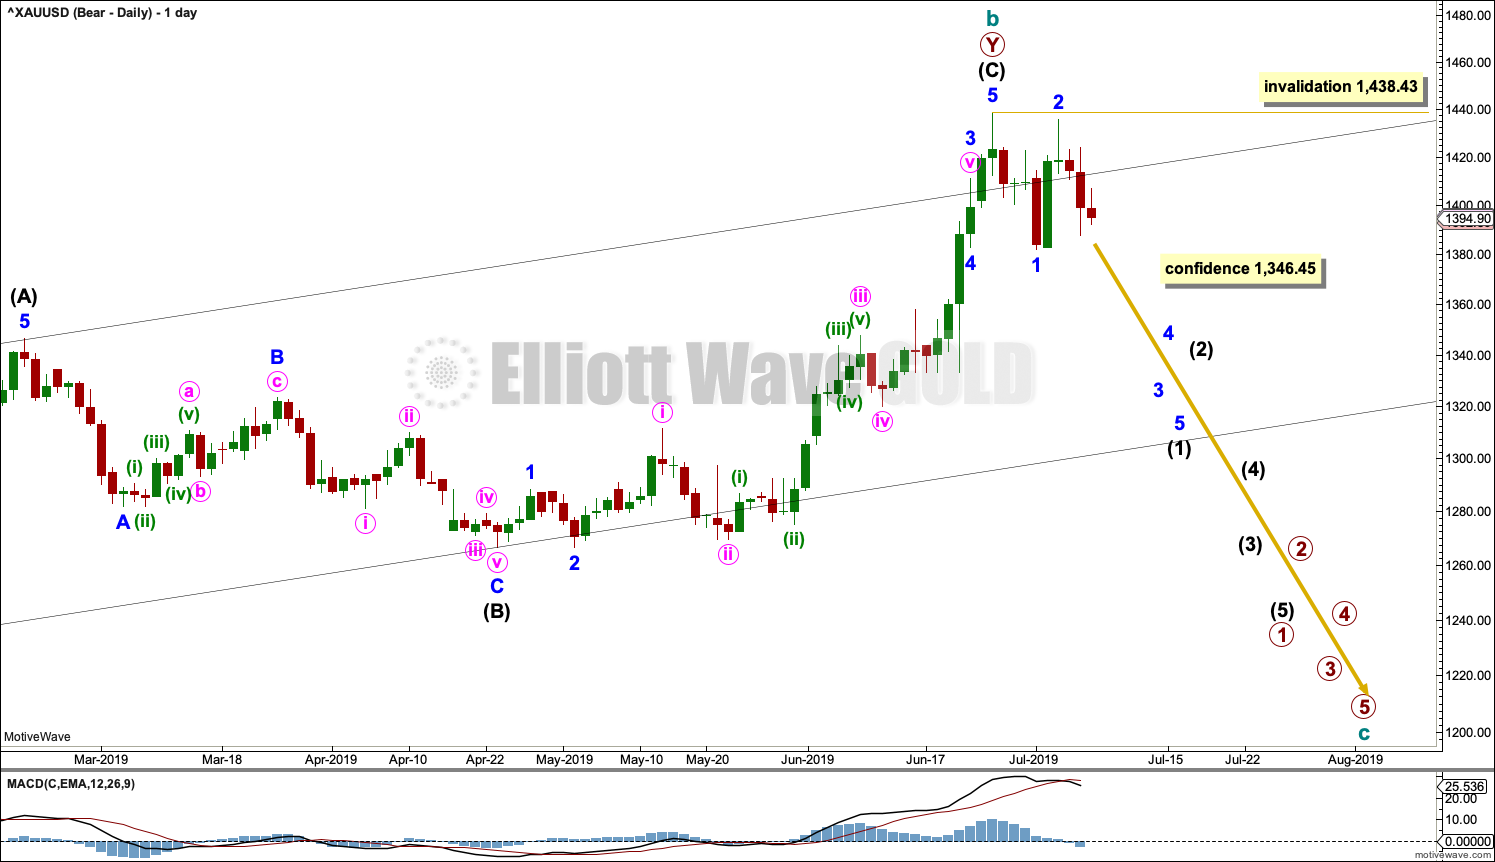
This chart focusses on the impulse of intermediate wave (C).
Intermediate wave (C) may be a complete impulse; the structure may now be complete at all time frames. There is a bearish candlestick reversal pattern on StockCharts data.
This wave count now requires a new low below 1,346.45 for confidence.
HOURLY CHART
Click chart to enlarge.
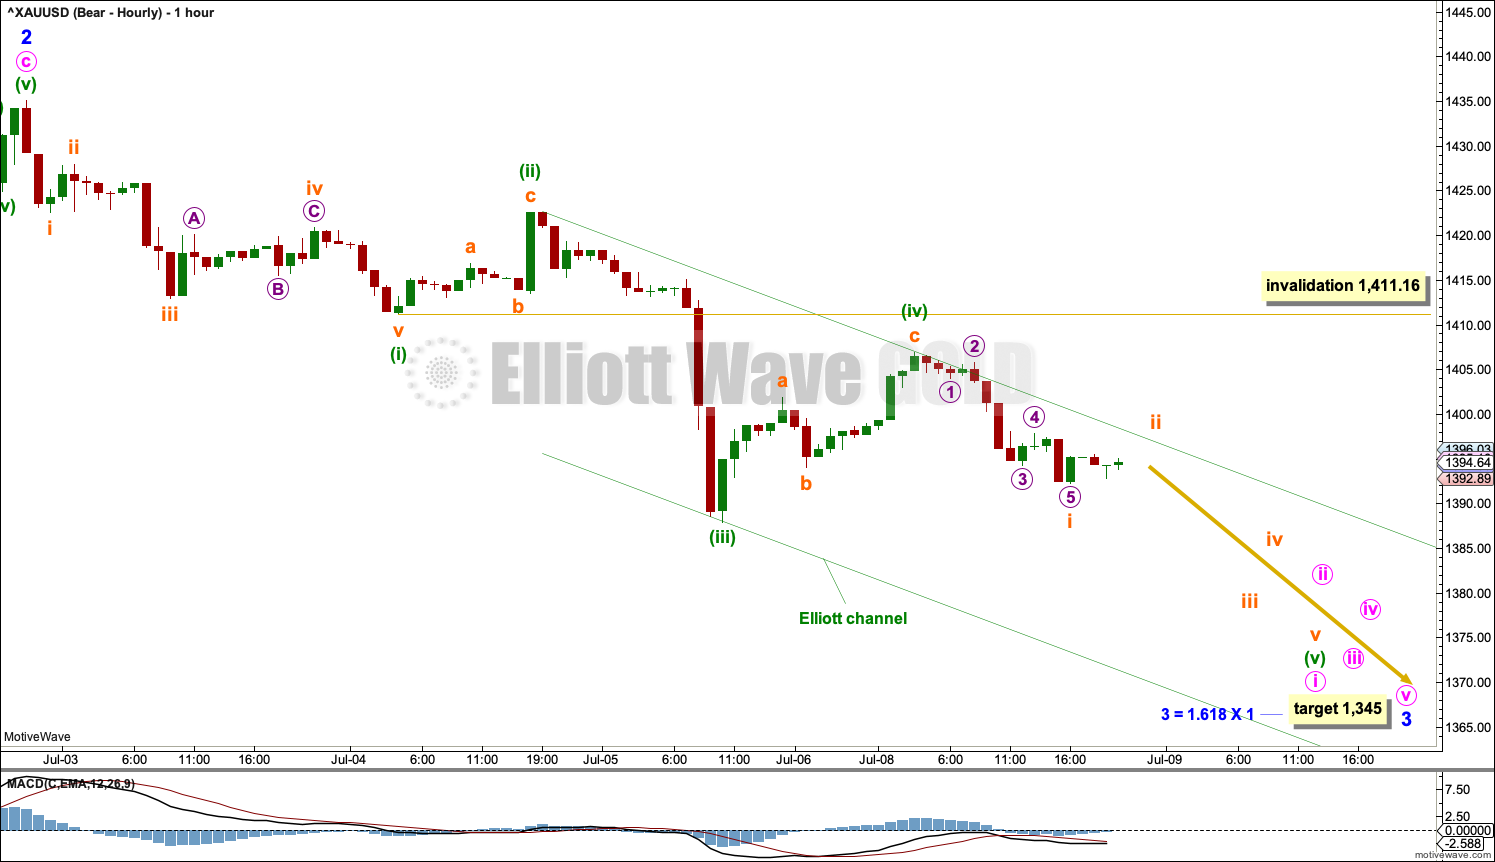
Minor wave 3 may only subdivide as an impulse. A target is calculated for the end of minor wave 3, which expects it to exhibit the most common Fibonacci ratio to minor wave 1.
Within minor wave 3, minute wave i may be incomplete. When minute wave i may be a complete impulse, then a bounce for minute wave ii may be expected to begin. Minute wave ii may not move beyond the start of minute wave i above 1,435.12.
Within minute wave i, the correction of minuette wave (iv) may not move into minuette wave (i) price territory above 1,411.16.
SECOND DAILY CHART
Click chart to enlarge.
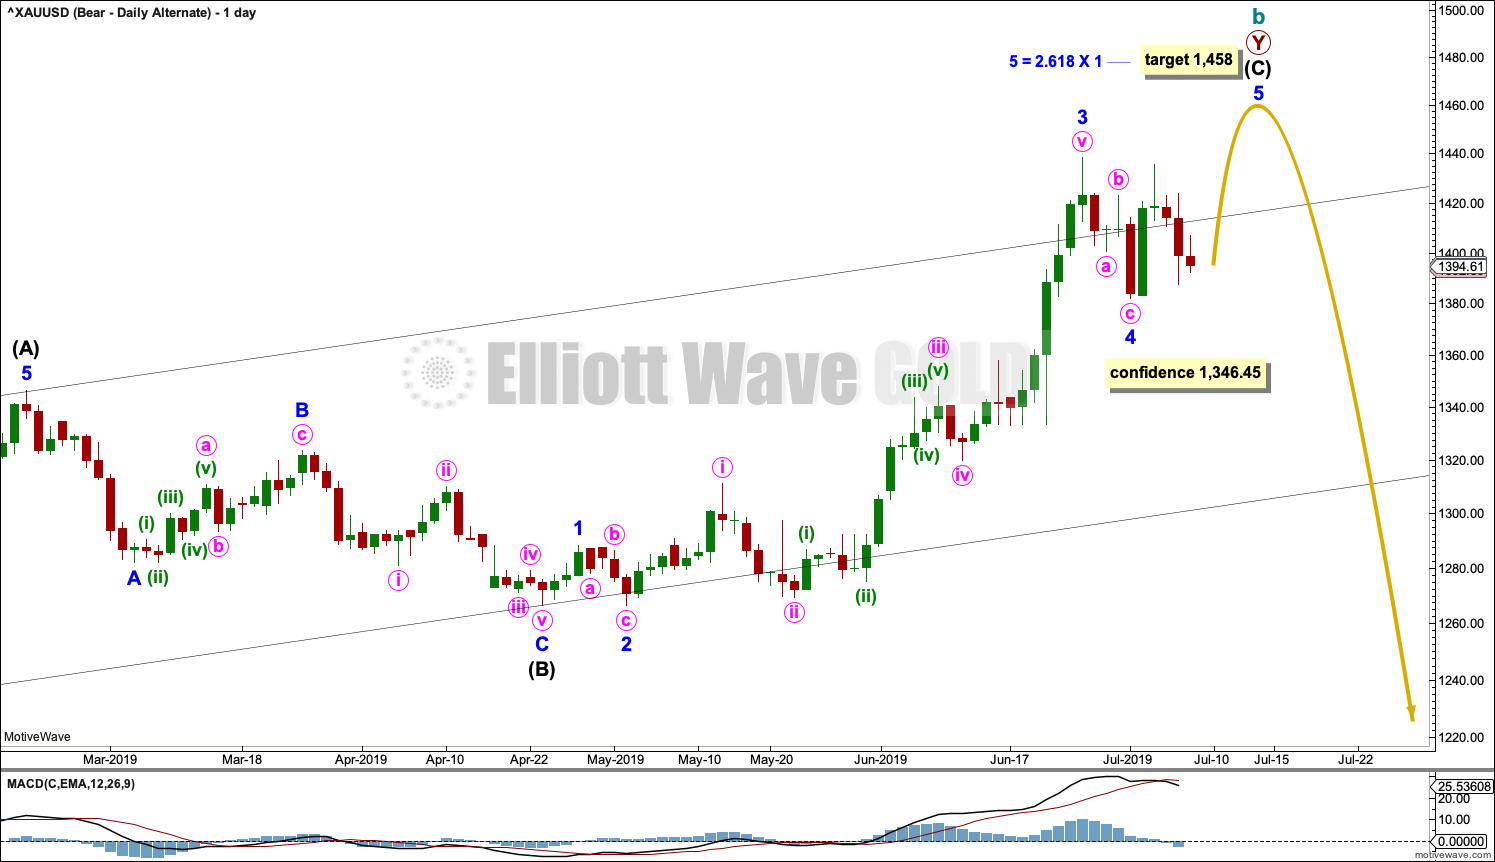
It is also possible that intermediate wave (C) may be an incomplete impulse and the last several sessions may be another correction within an ongoing upwards trend.
A target is calculated for minor wave 5 to end. About this target intermediate wave (C) would also be closer to equality in length with intermediate wave (A).
SECOND HOURLY CHART
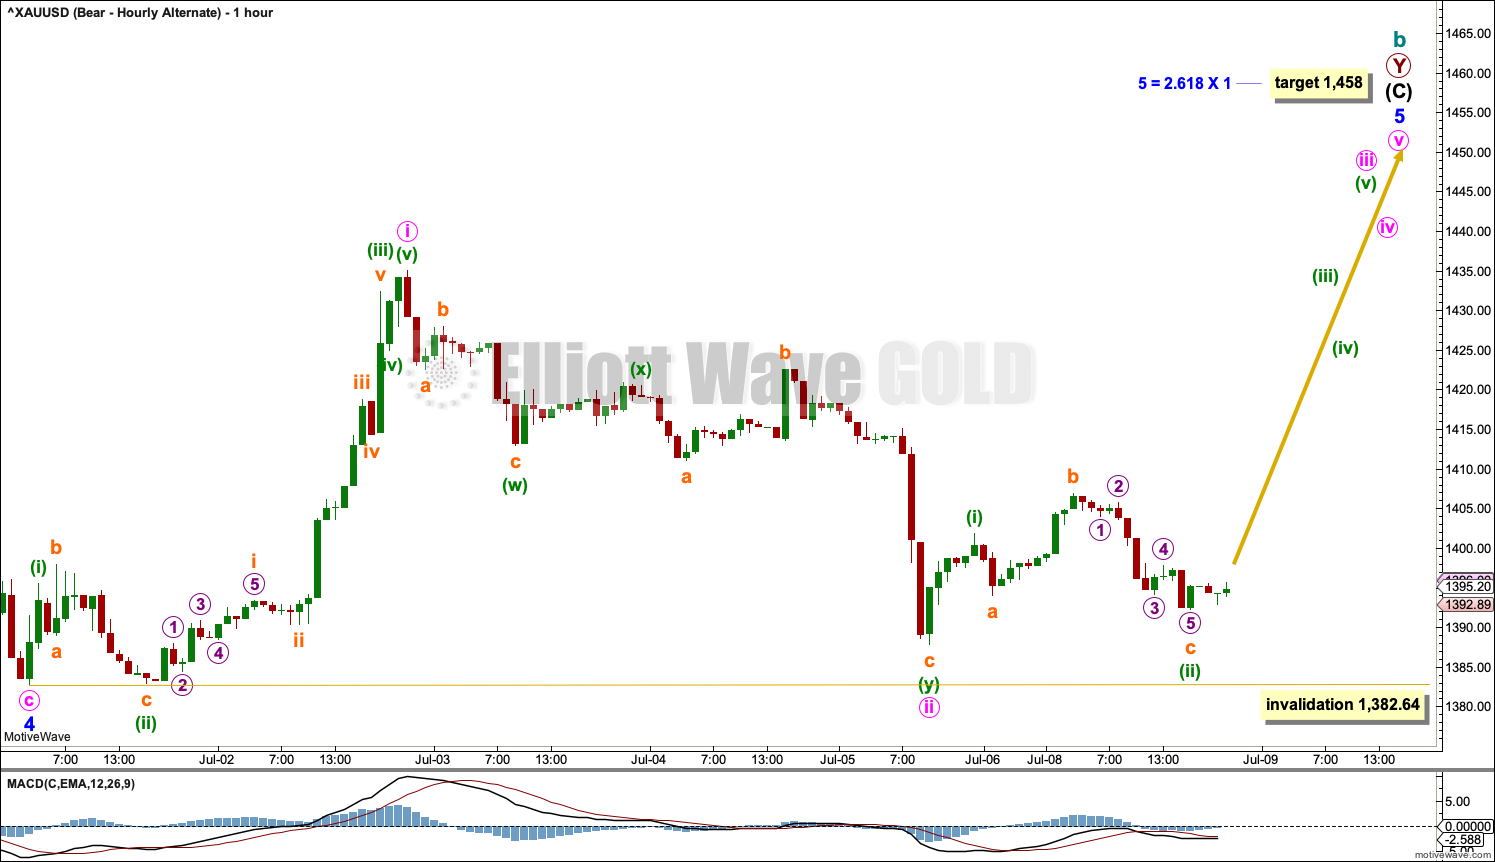
Click chart to enlarge.
If intermediate wave (C) is an incomplete five wave impulse, then within it minor wave 4 may be over at the last swing low. Minor wave 5 would now need to complete as a five wave structure higher up to the target.
This wave count is the same for the short term as the bullish hourly chart, with the exception of the target here being much lower.
BULLISH ELLIOTT WAVE COUNT
WEEKLY CHART
Click chart to enlarge.
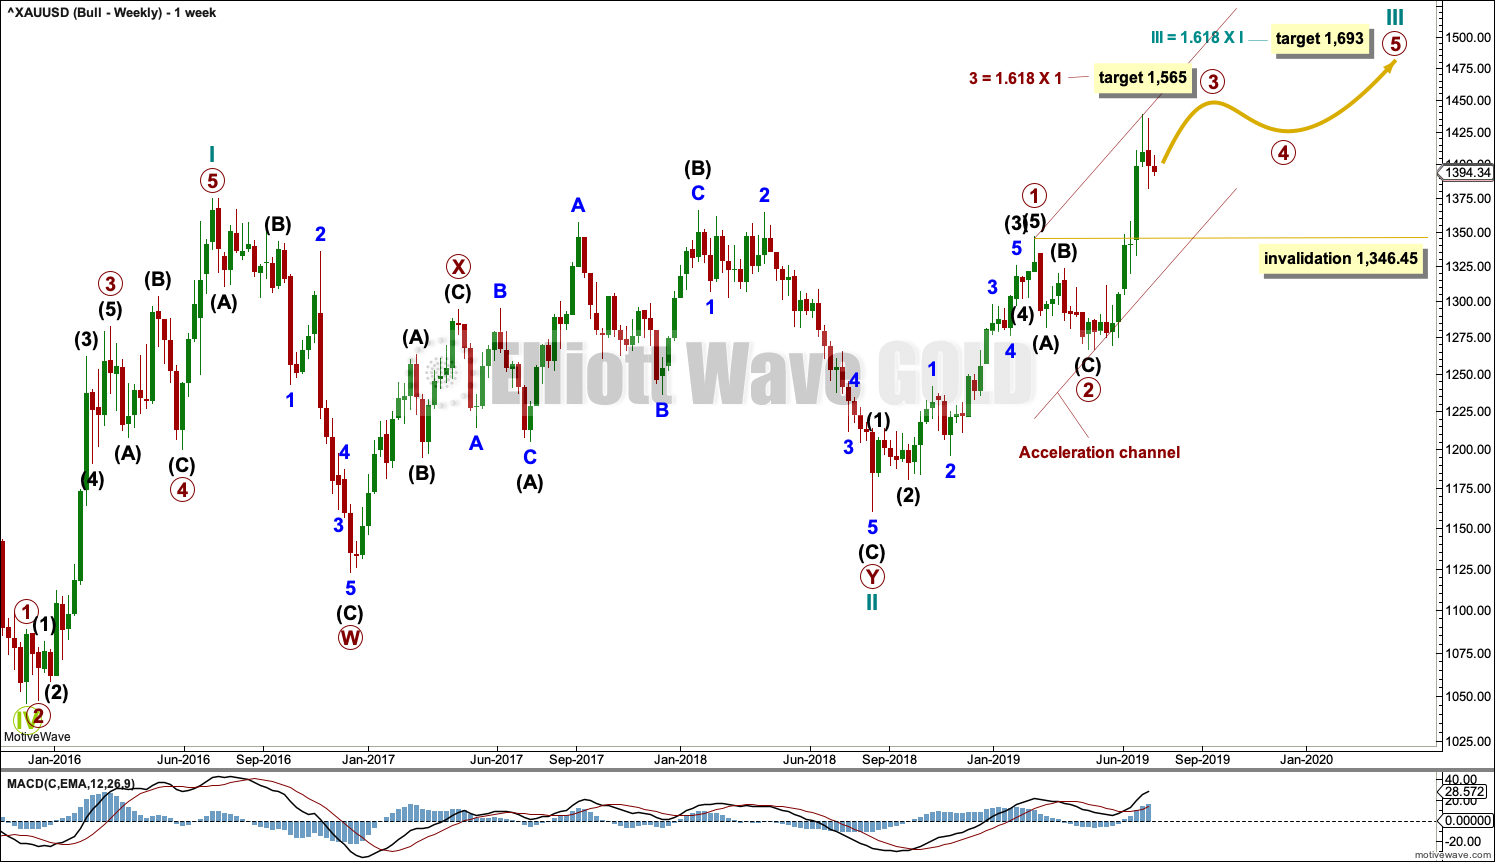
This wave count sees the the bear market complete at the last major low for Gold in November 2015.
If Gold is in a new bull market, then it should begin with a five wave structure upwards on the weekly chart. However, the biggest problem with this wave count is the structure labelled cycle wave I because this wave count must see it as a five wave structure, but it looks more like a three wave structure.
Commodities often exhibit swift strong fifth waves that force the fourth wave corrections coming just prior and just after to be more brief and shallow than their counterpart second waves. It is unusual for a commodity to exhibit a quick second wave and a more time consuming fourth wave, and this is how cycle wave I is labelled. This wave count still suffers from this very substantial problem, and for this reason two bearish wave counts are still considered above as they have a better fit in terms of Elliott wave structure.
Cycle wave II subdivides well as a double combination: zigzag – X – expanded flat.
Cycle wave III may have begun. Within cycle wave III, primary waves 1 and 2 may now be complete. If it continues lower as a double zigzag, then primary wave 2 may not move beyond the start of primary wave 1 below 1,160.75.
Cycle wave III so far for this wave count would have been underway now for 45 weeks. It may be beginning to exhibit some support from volume and increasing ATR. If this increase continues, then this wave count would have some support from technical analysis.
Draw an acceleration channel about primary waves 1 and 2: draw the first trend line from the end of primary wave 1 to the last high, then place a parallel copy on the end of primary wave 2. Keep redrawing the channel as price continues higher. When primary wave 3 is complete, then this channel would be drawn using Elliott’s first technique about the impulse. The lower edge may provide support.
Primary wave 4 may not move into primary wave 1 price territory below 1,346.45.
DAILY CHART
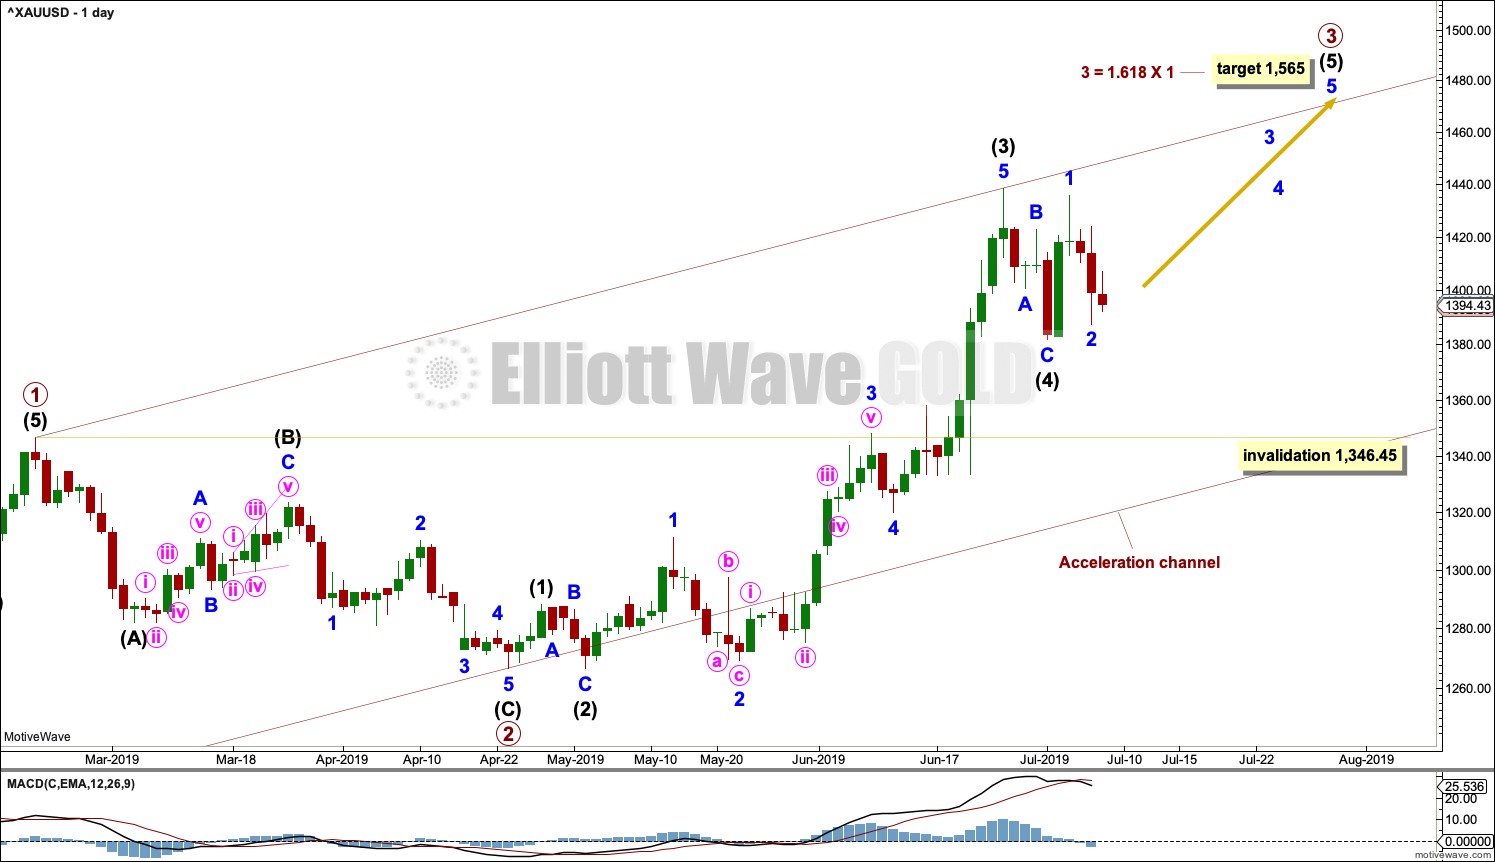
Click chart to enlarge.
This daily chart focusses on the impulse of primary wave 3.
Primary wave 3 may only subdivide as an impulse. Primary wave 3 has now moved above the end of primary wave 1, meeting a core Elliott wave rule.
When it arrives, primary wave 4 may not move into primary wave 1 price territory below 1,346.45.
Intermediate wave (5) may exhibit further strength. The target for primary wave 3 is calculated using the most common Fibonacci ratio to primary wave 1.
The structure of primary wave 3 as an incomplete impulse for this wave count is seen in exactly the same way as the incomplete impulse for intermediate wave (C) in the second bearish daily chart.
Look out now for the possibility of another blow off top as intermediate wave (5) to end primary wave 3 comes to an end.
HOURLY CHART
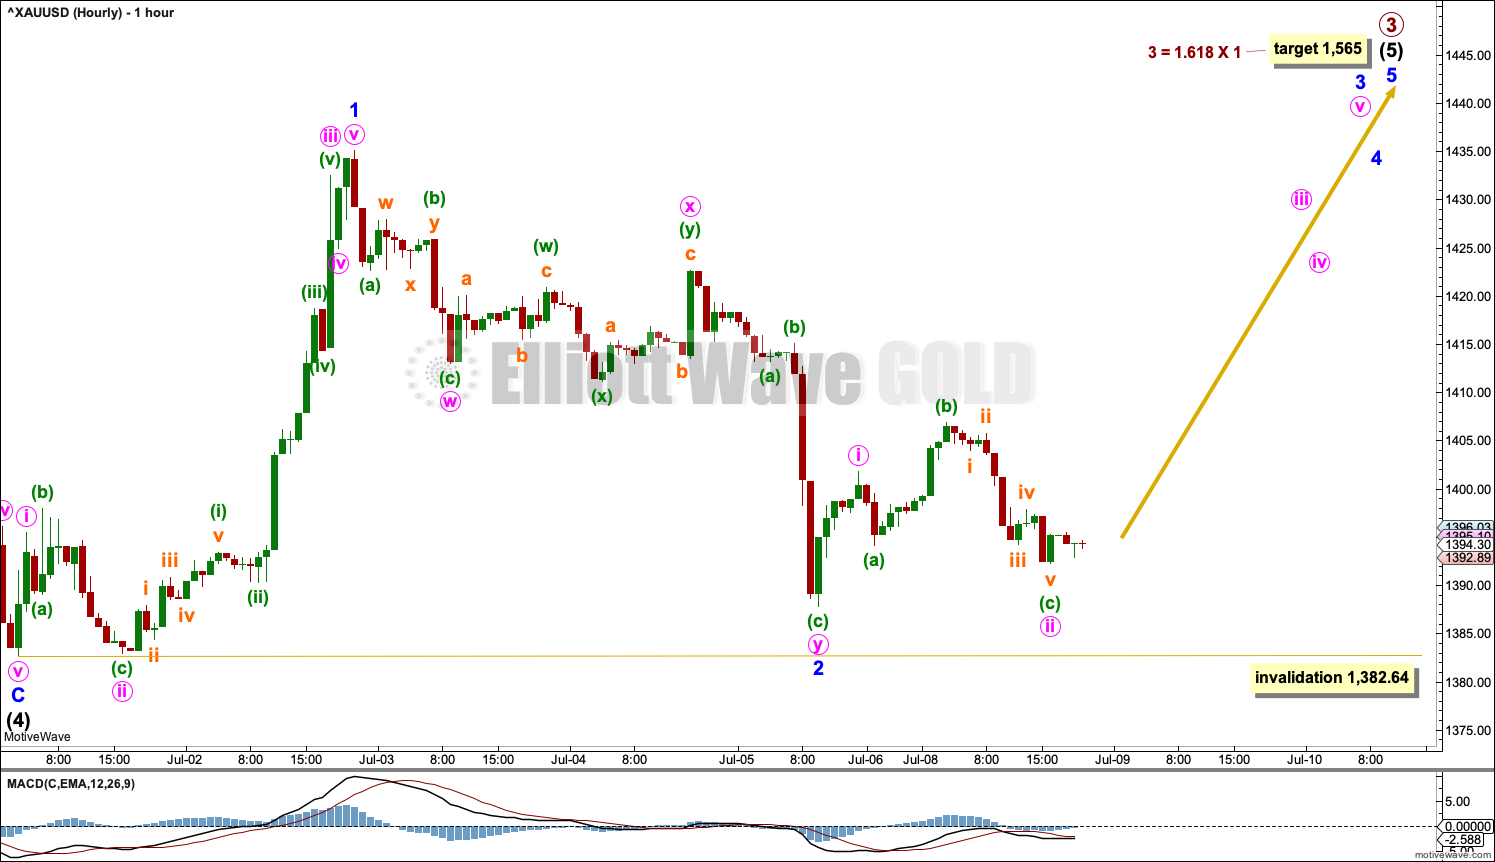
Click chart to enlarge.
Intermediate wave (4) may now be complete and intermediate wave (5) may have begun.
Intermediate wave (5) may subdivide as either an impulse or an ending diagonal. Fifth waves to end third wave impulses one degree higher almost always subdivide as impulses, so that will be the expected Elliott wave structure for intermediate wave (5).
Within intermediate wave (5), the first five up for minor wave 1 may be complete. The first three down to follow may also be complete, labelled minor wave 2. Minor wave 2 subdivides as a double zigzag.
If it continues any lower, then minor wave 2 may not move beyond the start of minor wave 1 below 1,382.64.
TECHNICAL ANALYSIS
MONTHLY CHART
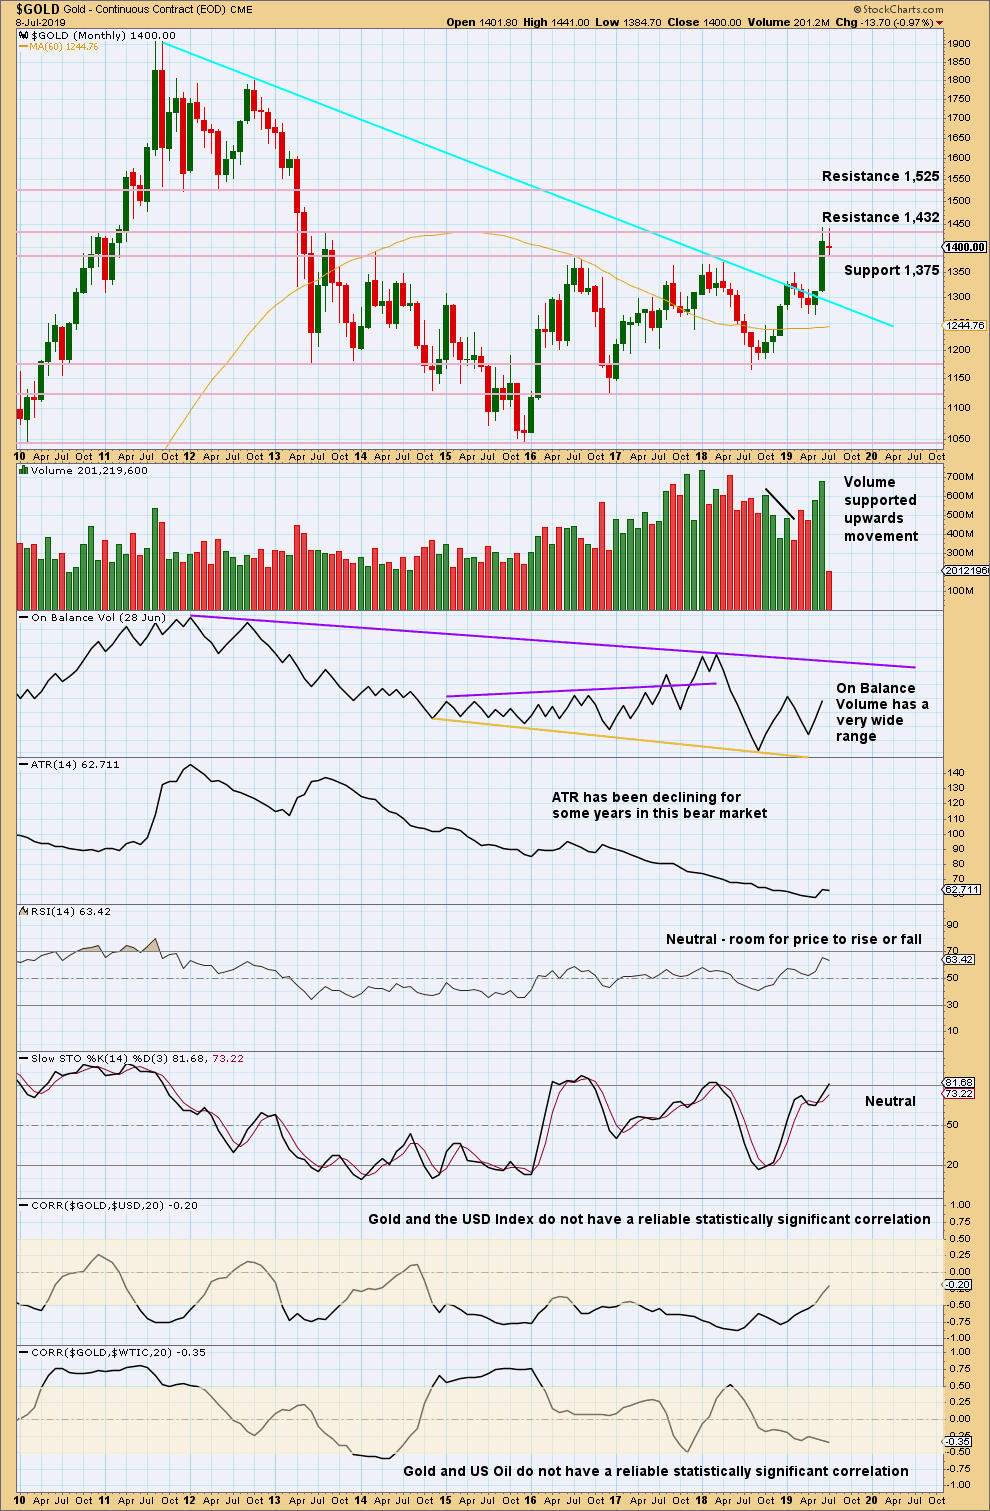
Click chart to enlarge. Chart courtesy of StockCharts.com.
Gold has effected an upwards breakout above multi-year resistance and above the cyan bear market trend line. Look for next resistance identified on the chart.
WEEKLY CHART
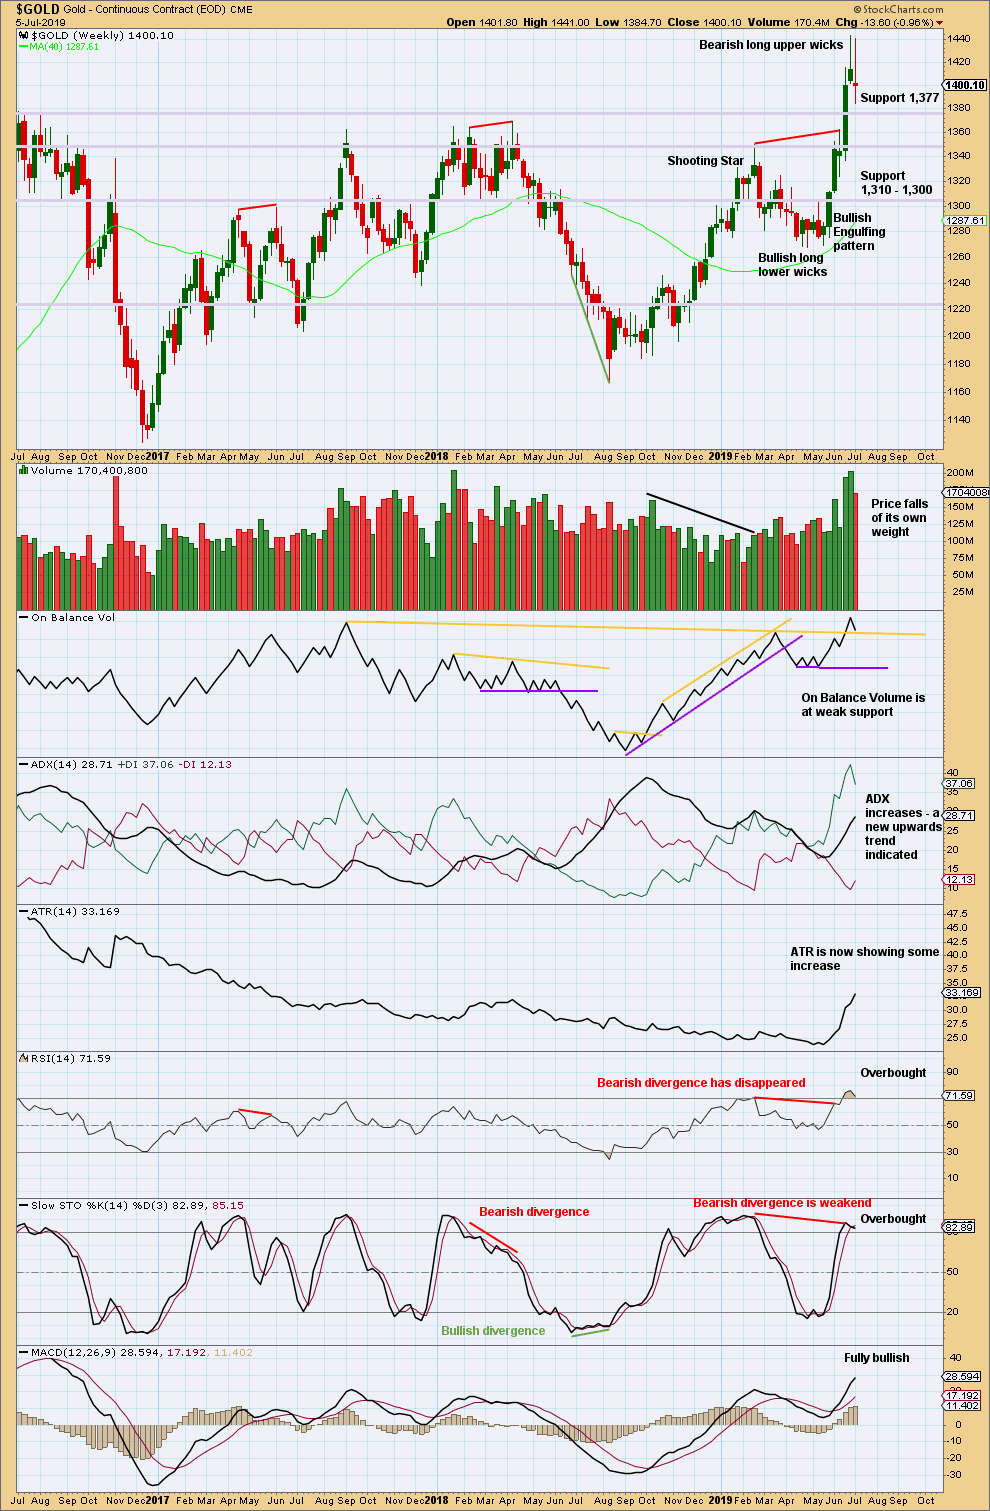
Click chart to enlarge. Chart courtesy of StockCharts.com.
Gold has broken out of a multi-year consolidation, which saw resistance about 1,375. The breakout has support from volume, so confidence may be had in it.
Price now has some strength with rising ATR. Conditions remain overbought. The pullback so far has not relieved extreme conditions and has lasted only one week. It may continue a little longer.
Look now for strong support about 1,375.
DAILY CHART
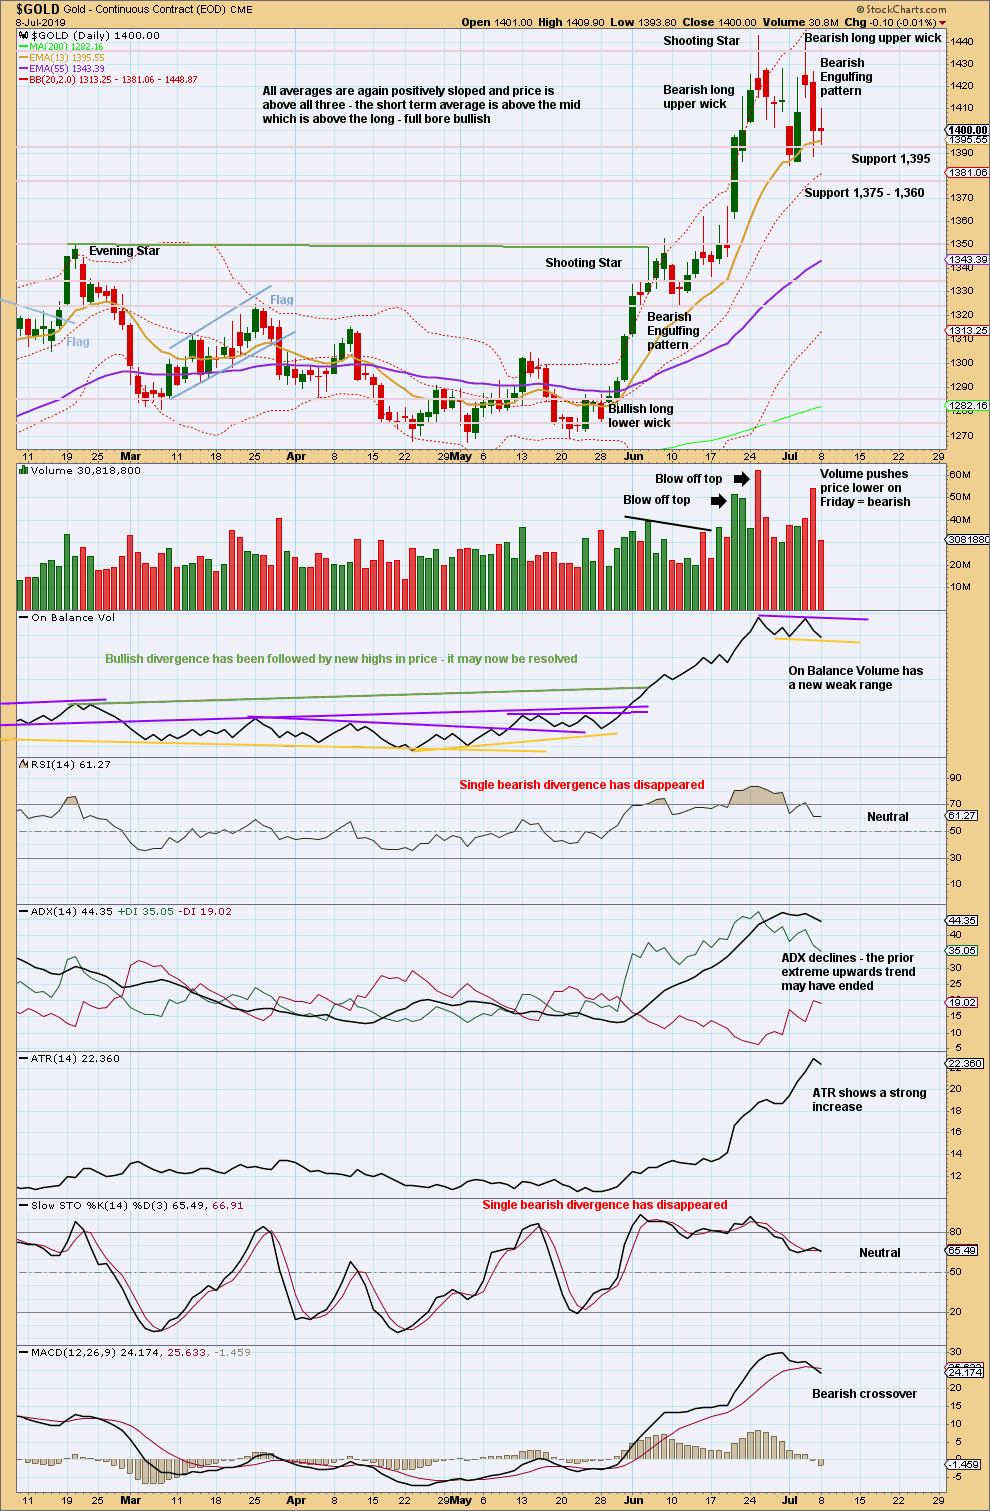
Click chart to enlarge. Chart courtesy of StockCharts.com.
It is common to see price curve down and back test support at prior resistance after a breakout. After strong downwards movement on Friday, it now looks like the back test may continue. A small range Doji for Monday’s session does not change this view.
Overall, this chart is bullish and supports the bullish Elliott wave count.
GDX WEEKLY CHART
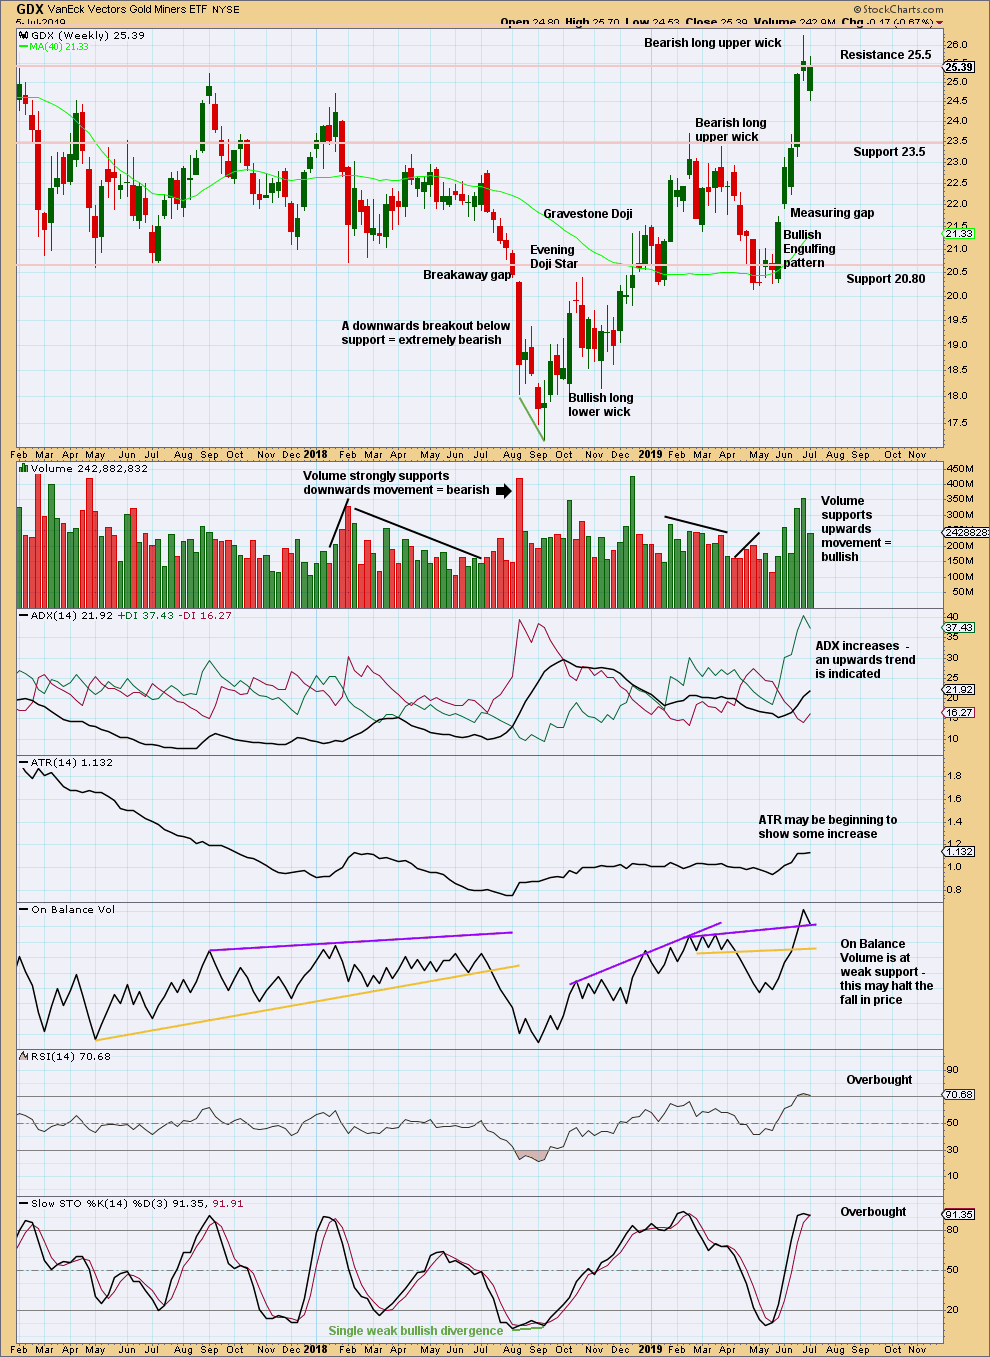
Click chart to enlarge. Chart courtesy of StockCharts.com.
The upwards trend continues, but conditions are now overbought. This can continue for a while during a strong trend. At this stage, there are no signs of a reversal.
GDX DAILY CHART
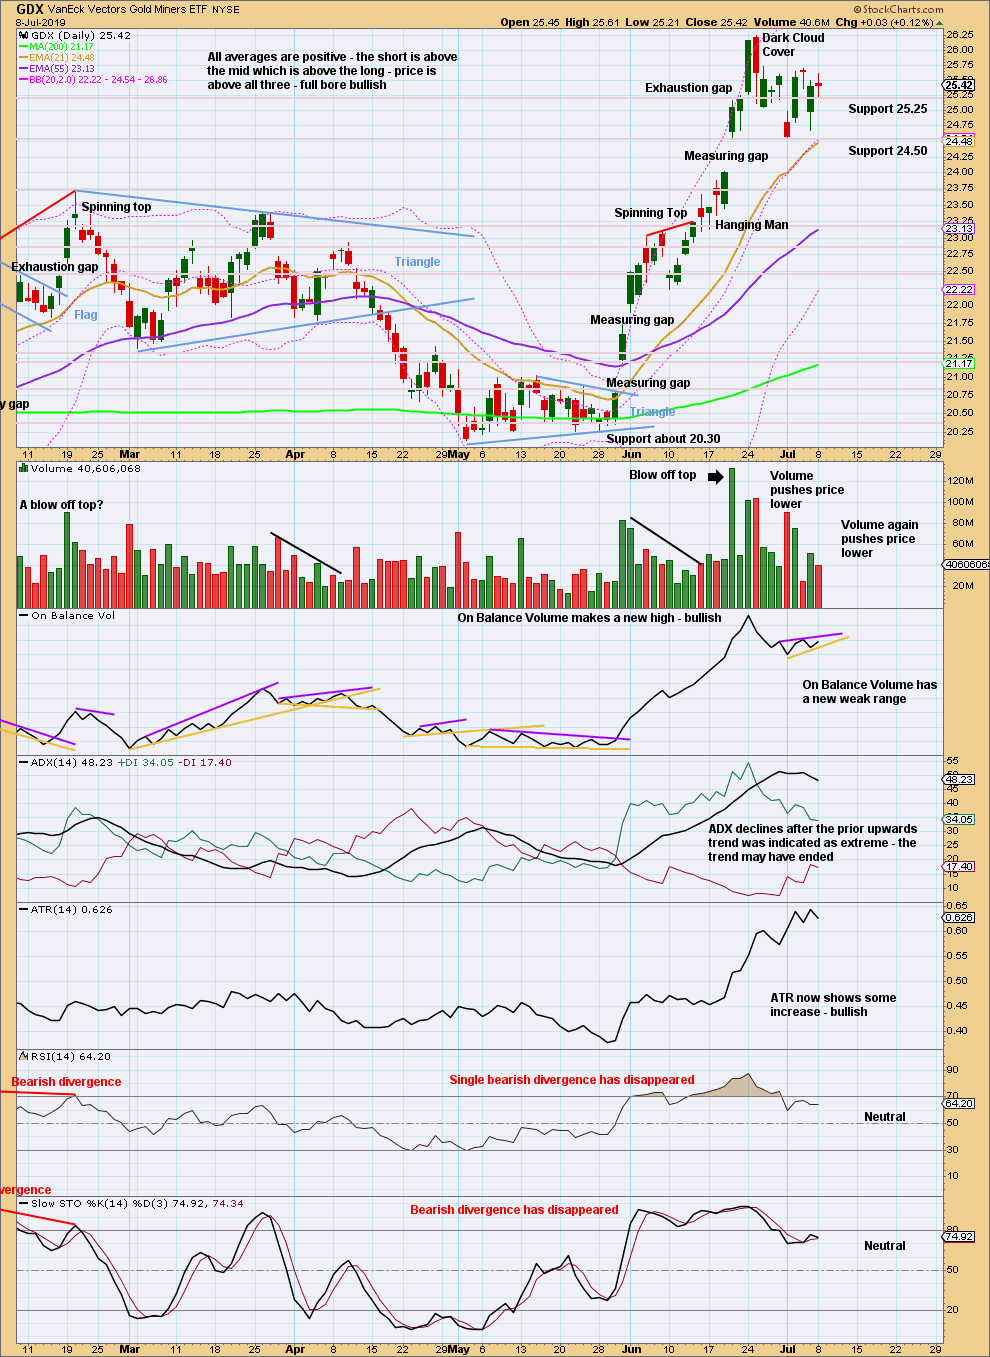
Click chart to enlarge. Chart courtesy of StockCharts.com.
The measuring gap remains open as long as price remains above 24.03. Closure of this gap would be a significant bearish signal.
For the short term, volume suggests more downwards movement.
Published @ 09:31 p.m. EST.
—
Careful risk management protects your trading account(s).
Follow my two Golden Rules:
1. Always trade with stops.
2. Risk only 1-5% of equity on any one trade.
—
New updates to this analysis are in bold.
Bear hourly chart updated:
Minute i may now be a complete five down. Minute ii may now unfold as a three up.
hi, can you please look at the posibilty that minor wave 4 to unfold as a triangle; ty
It’s intermediate wave 4. I asked that same question about a week ago and she said that is one of about 23 possibilities. It look like a reasonable possibility based on how Intermediate 4 is developing (with the bullish wc).
It would look like this.
There would be no effective difference to expected direction nor invalidation points to the hourly chart published for the bull wave count.
I’ll keep watching both as they unfold, but I don’t want to be publishing too many charts so I’ll have to pick which one to publish….
This is the updated hourly chart for the bull count published in the analysis above.
It expects an upwards breakout may come sooner than the triangle count, but for this count the waves of minute i and ii could look pretty much the same as minor D and E for the triangle count.
A series of overlapping first and second waves can look very much the same as a triangle.
Thank you!