
Downwards movement was expected to end within a very few hours after last analysis was published and thereafter to be followed by an upwards breakout. Today price has closed above the upper edge of the pennant pattern, but a lack of support from volume so far is suspicious.
Summary: An upwards breakout may be underway. If the next session has support from volume and continues higher, then confidence may be had in it.
There are two Elliott wave scenarios in this analysis (published below in this order):
1. The bear market continues: the breakout above multi year resistance was false but incomplete. One final high to 1,452 or 1,489 may unfold before a multi year trend change and a new downwards wave to new lows.
2. A bull market is underway: the back test of support was a fourth wave correction, now complete. The target for the mid term is 1,565. It is this scenario which currently has the most support from classic technical analysis, but it still has the biggest problem in terms of Elliott wave structure.
A classic analysis target from the pennant pattern is at 1,537.
Grand SuperCycle analysis is here.
Last monthly charts are here.
Overall, the bearish wave counts still have a higher probability based upon Elliott wave structures. However, it would be best to leave price to invalidate either the bullish or bearish scenario before having confidence in which is correct.
BEARISH ELLIOTT WAVE COUNTS
FIRST WEEKLY CHART
Click chart to enlarge.
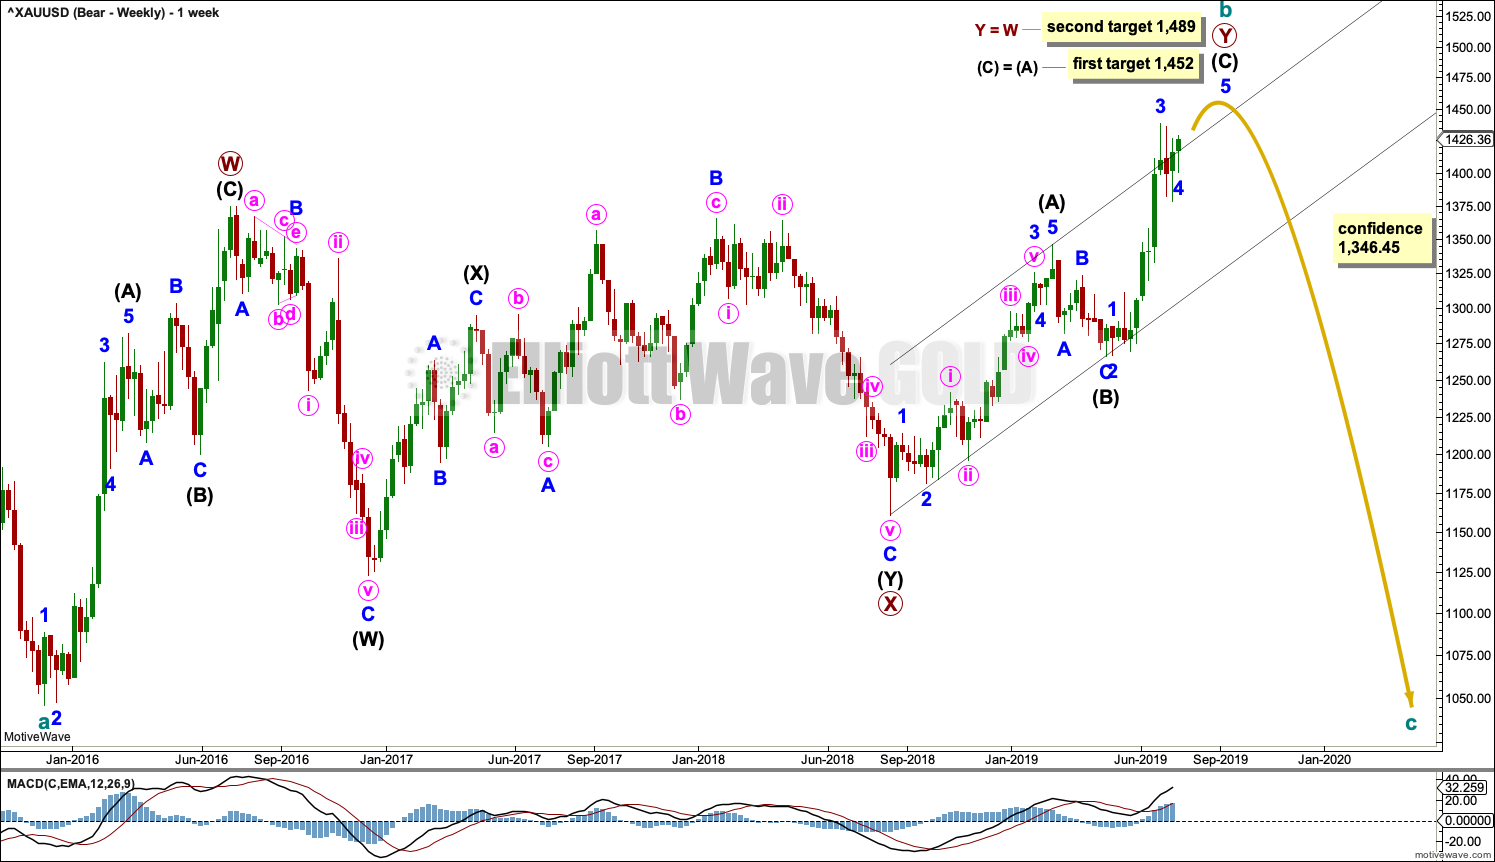
It remains possible that the bear market for Gold may yet continue. It is possible that cycle wave b may be nearing completion. Cycle wave b may be a double zigzag.
Double zigzags are common structures, but within them their X waves are almost always single zigzags that are relatively brief and shallow. However, this wave count sees primary wave X as a complete double combination: zigzag – X – expanded flat.
An X wave may occasionally subdivide as a multiple. In a multiple the maximum number of corrective structures is three: W, Y and Z. To label any one of W, Y or Z as a multiple would violate the Elliott wave rule. Here, the rule is met.
Primary wave Y may be an incomplete zigzag. The purpose of a second zigzag in a double zigzag is to deepen the correction when the first zigzag does not move price far enough. This purpose has been achieved.
A new low now by any amount at any time frame below 1,346.45 would invalidate the bullish wave count below and provide some confidence in this wave count.
DAILY CHART
Click chart to enlarge.
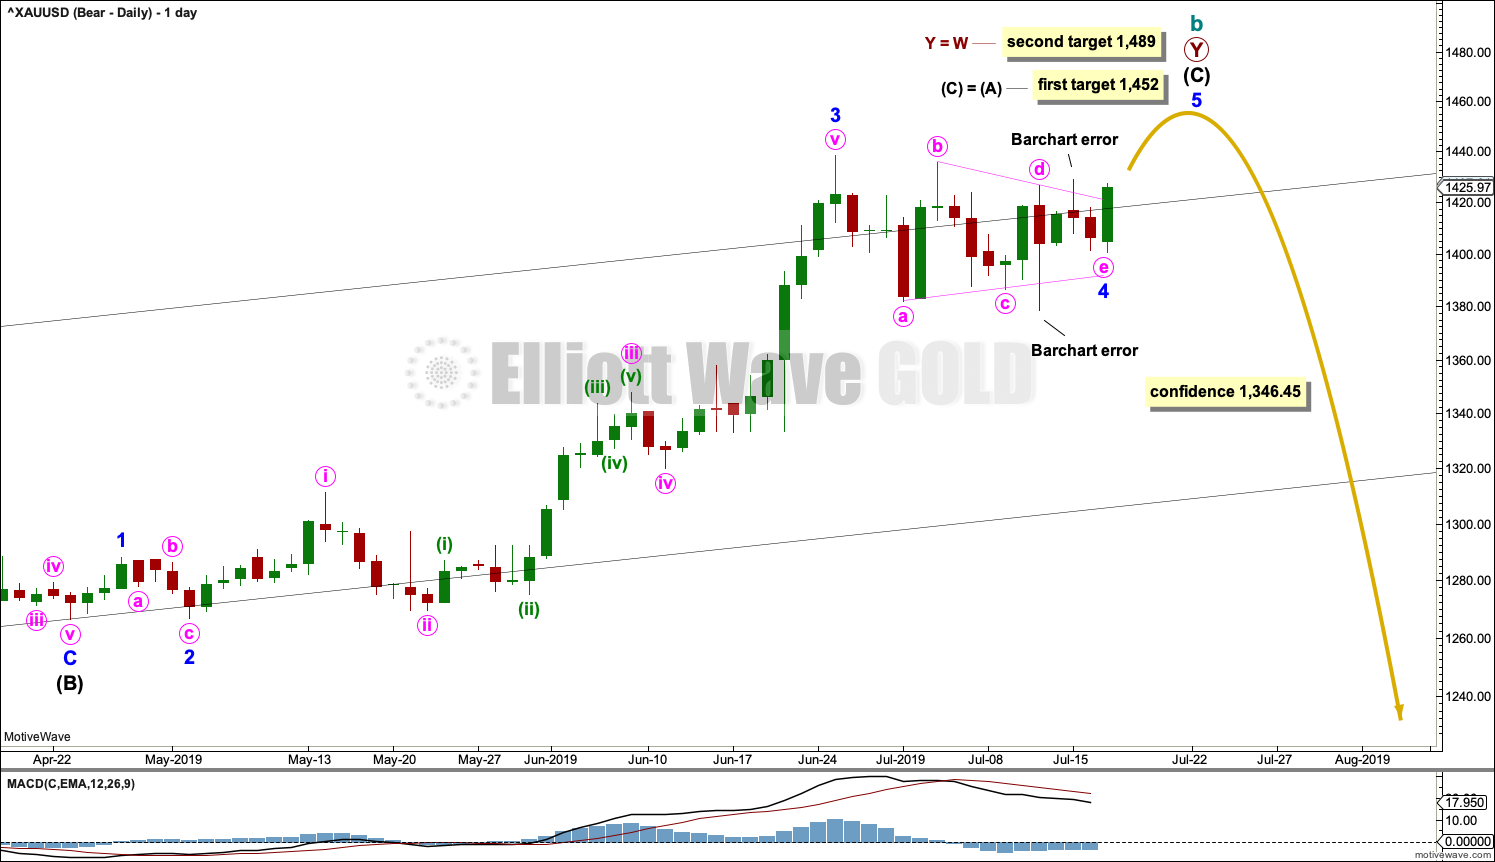
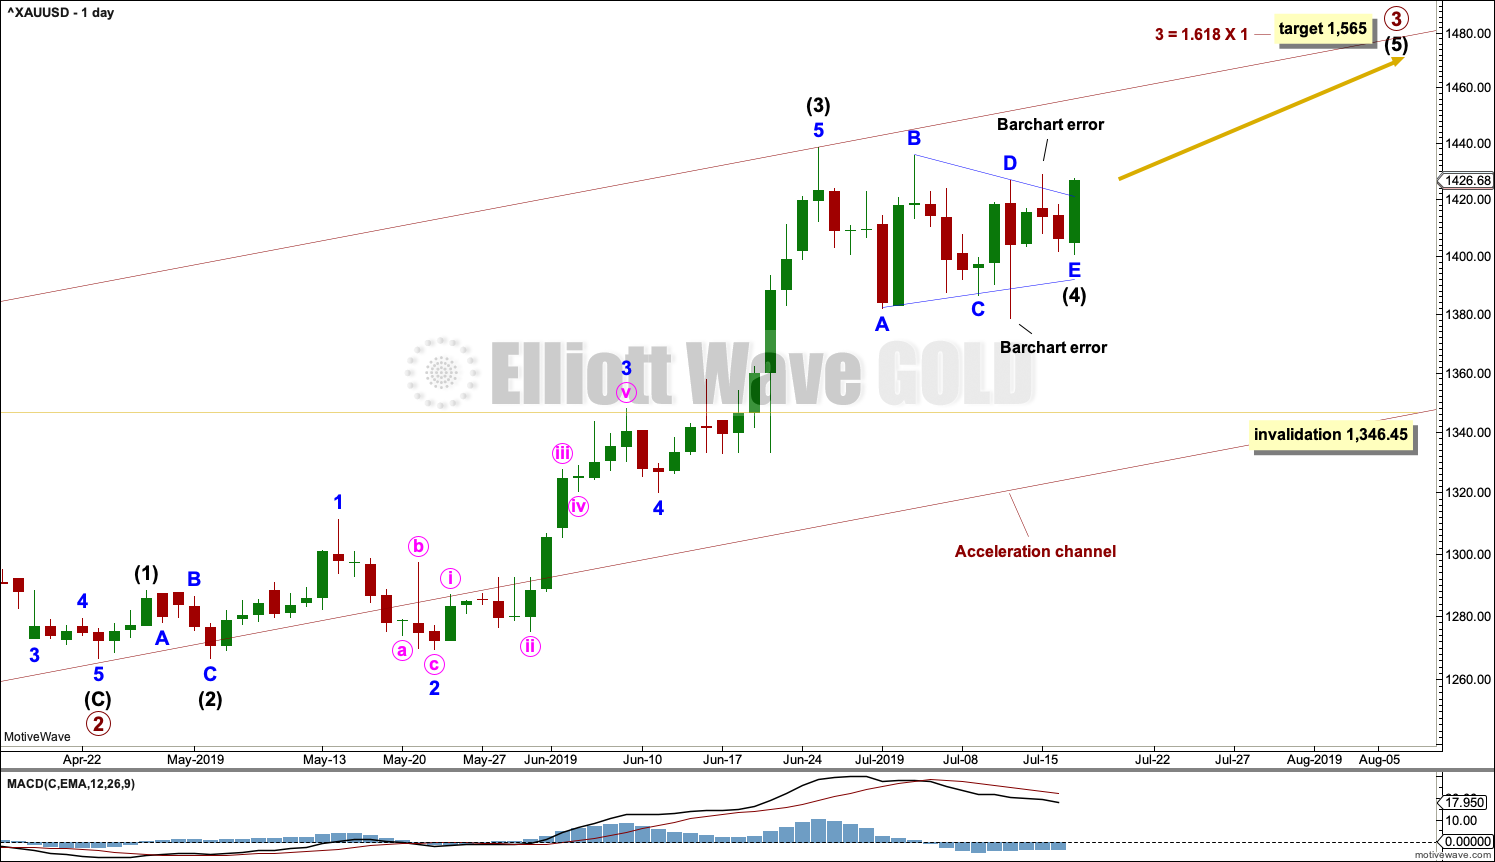
This chart focusses on the impulse of intermediate wave (C).
Intermediate wave (C) may be an incomplete impulse. The last several sessions may be a triangle for minor wave 4.
The target for intermediate wave (C) is calculated for it to reach equality in length with intermediate wave (A).
A second higher target is calculated at primary degree for primary wave Y to reach equality in length with primary wave W. If price reaches the first target and either the structure of minor wave 5 is incomplete or price keeps rising, then the second target may be used.
After cycle wave b may be complete, this wave count would require a new low below 1,346.45 for confidence.
Note: The price spike down to 1,378 on the daily chart for the 11th of July is highly suspicious because it is not visible on time frames below daily. Now the high on the daily chart for the 15th of July at 1,429 is not visible on the hourly chart, so it is also suspicious. Barchart is aware of the discrepancy; they are working on fixing the problem. Because neither of these price points are visible on time frames below daily, they cannot be incorporated into the analysis because there is no structure at lower time frames to analyse for them. They are ignored.
HOURLY CHART
Click chart to enlarge.
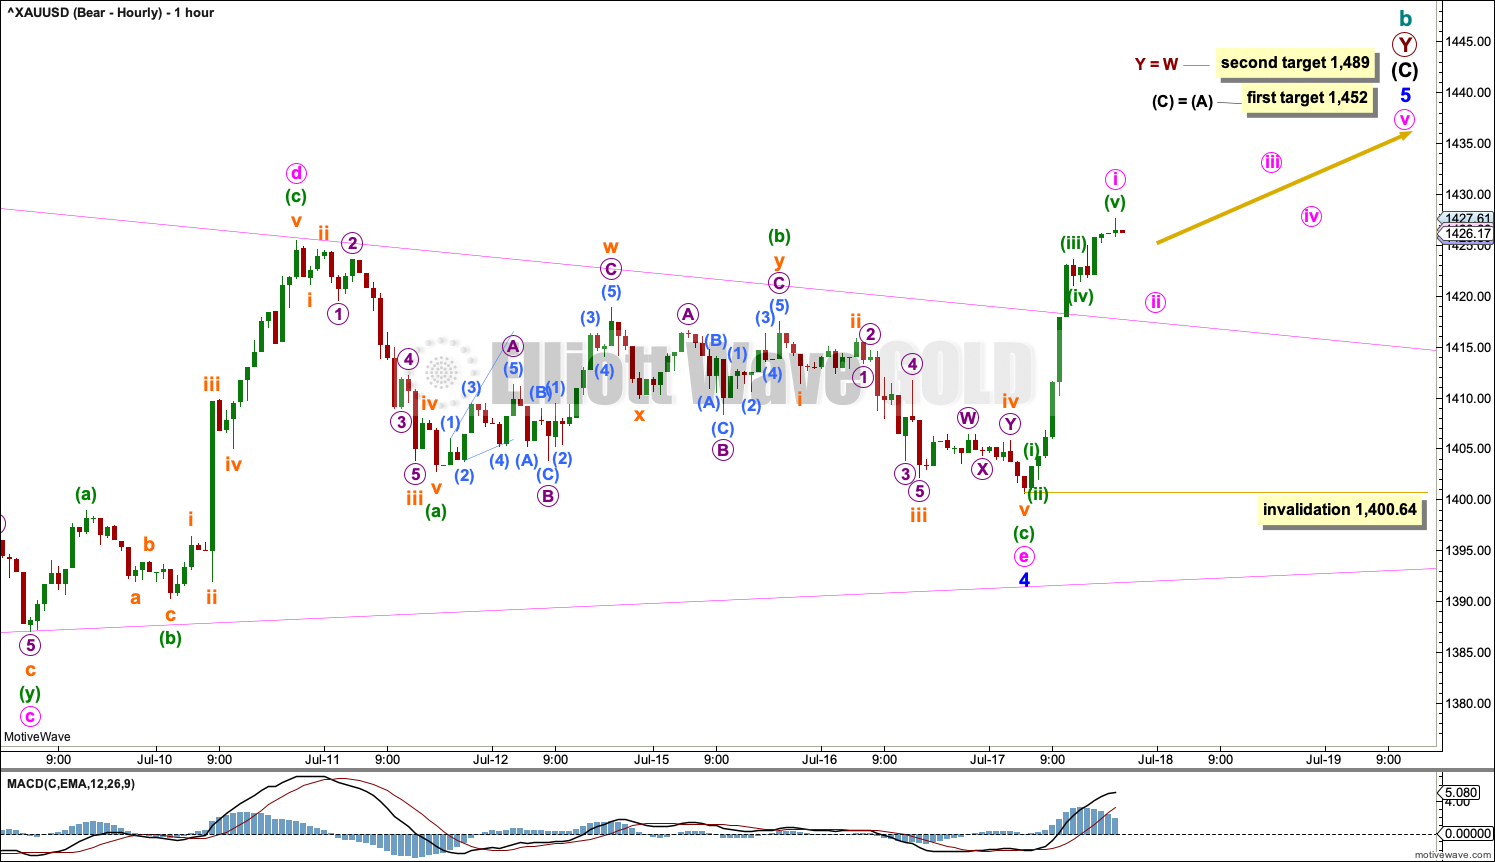
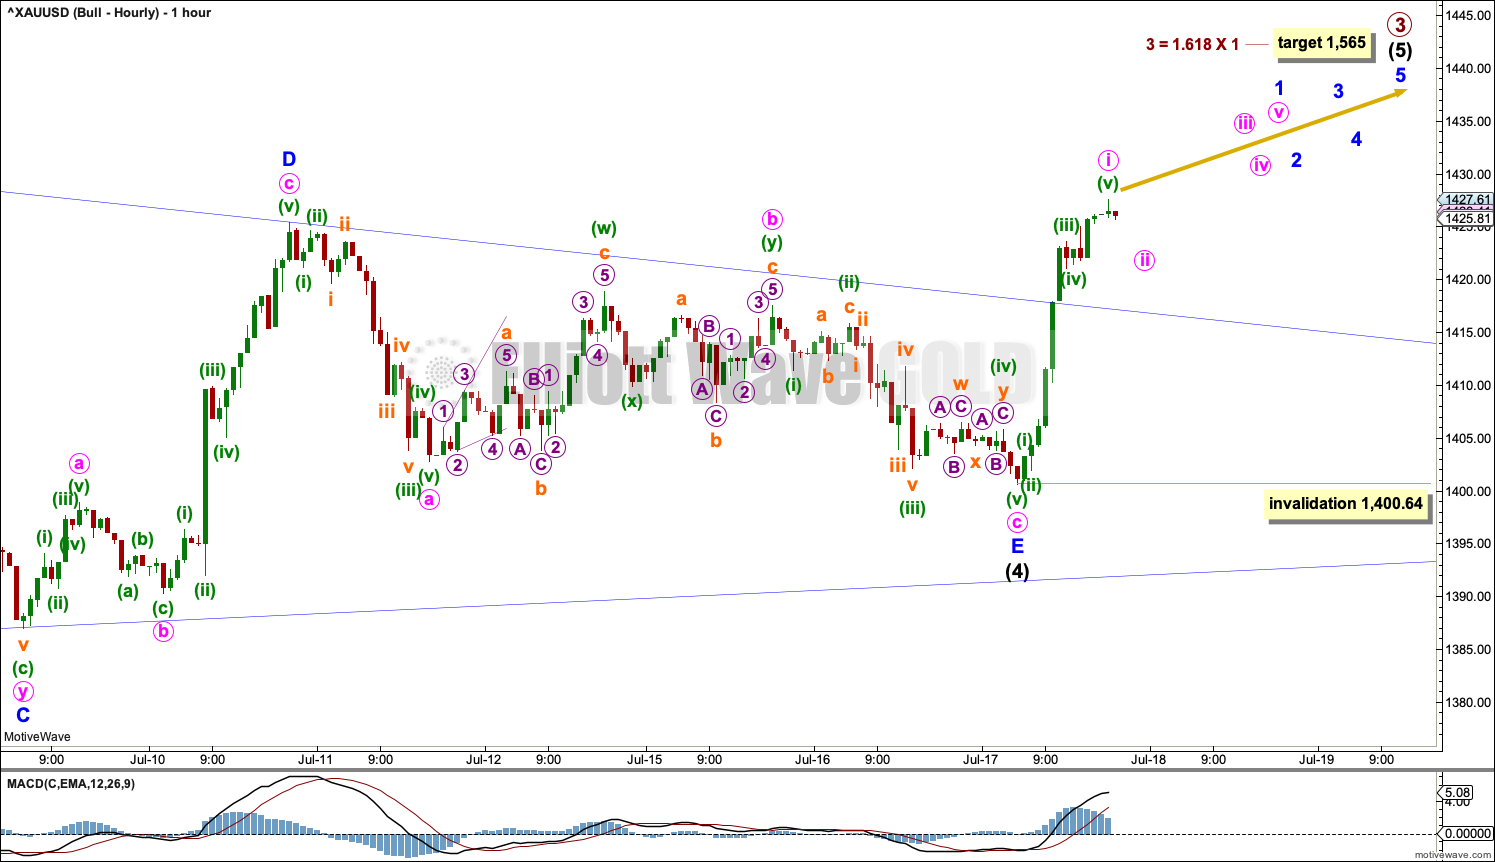
The triangle of minor wave 4 now looks complete at all time frames. The upwards movement at the end of this last session has closed well above the upper triangle trend line. This looks like an upwards breakout.
Minor wave 5 must subdivide as a five wave motive structure, most likely an impulse. Within minor wave 5, minute wave ii may not move beyond the start of minute wave i below 1,400.64.
Gold has a tendency to exhibit surprisingly short fifth waves. This bearish wave count expects minor wave 5 may be relatively short and brief if the first target only is met. This would follow a common behaviour for this market.
BULLISH ELLIOTT WAVE COUNT
WEEKLY CHART
Click chart to enlarge.
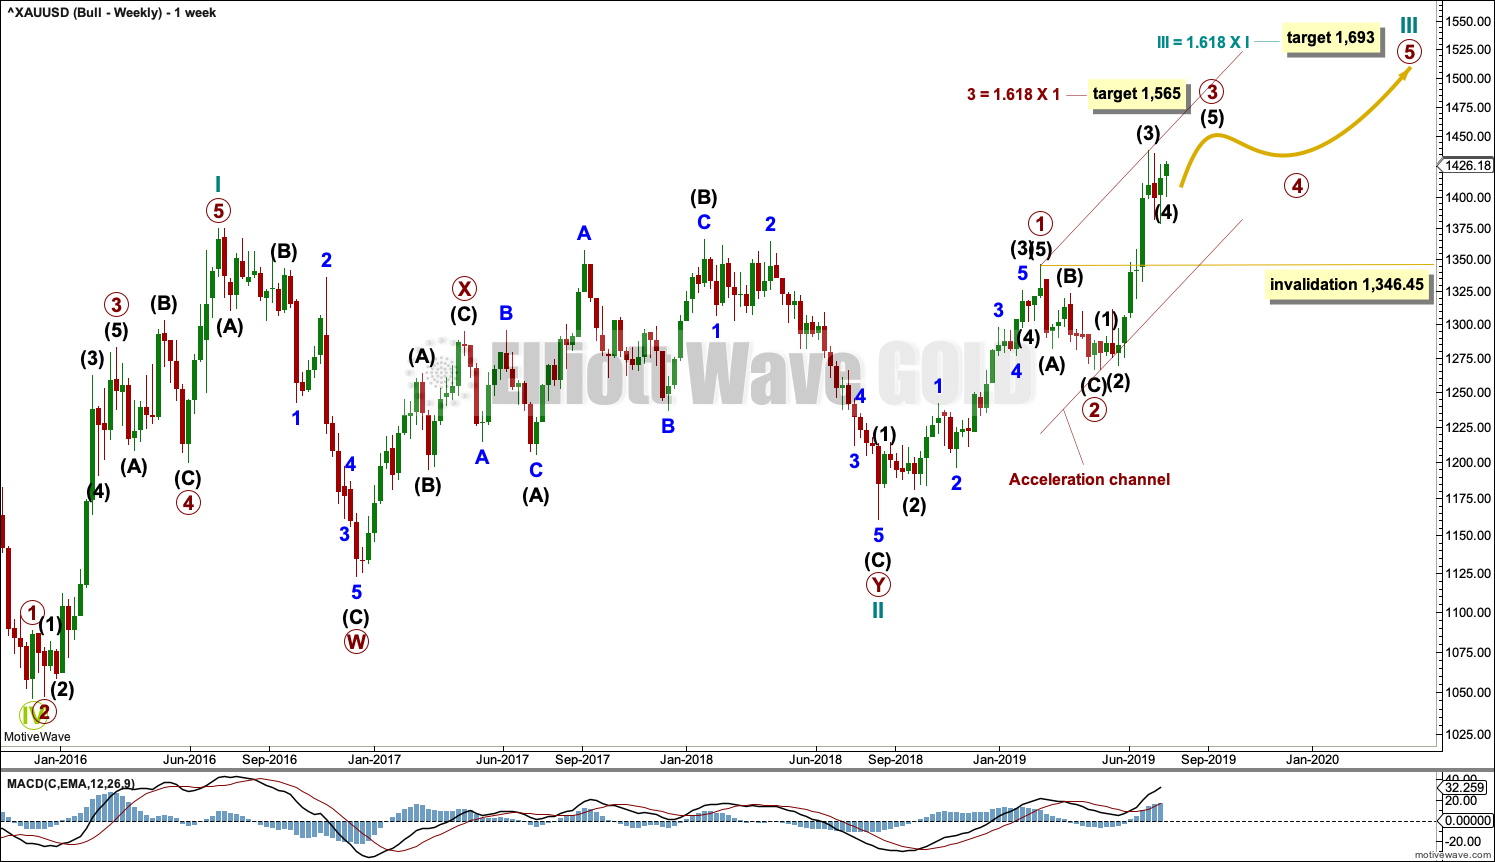
This wave count sees the the bear market complete at the last major low for Gold in November 2015.
If Gold is in a new bull market, then it should begin with a five wave structure upwards on the weekly chart. However, the biggest problem with this wave count is the structure labelled cycle wave I because this wave count must see it as a five wave structure, but it looks more like a three wave structure.
Commodities often exhibit swift strong fifth waves that force the fourth wave corrections coming just prior and just after to be more brief and shallow than their counterpart second waves. It is unusual for a commodity to exhibit a quick second wave and a more time consuming fourth wave, and this is how cycle wave I is labelled. This wave count still suffers from this very substantial problem, and for this reason a bearish wave count is still considered above as it has a better fit in terms of Elliott wave structure.
Cycle wave II subdivides well as a double combination: zigzag – X – expanded flat.
Cycle wave III may have begun. Within cycle wave III, primary waves 1 and 2 may now be complete. If it continues lower as a double zigzag, then primary wave 2 may not move beyond the start of primary wave 1 below 1,160.75.
Cycle wave III so far for this wave count would have been underway now for 47 weeks. It may be beginning to exhibit some support from volume and increasing ATR. If this increase continues, then this wave count would have some support from technical analysis.
Draw an acceleration channel about primary waves 1 and 2: draw the first trend line from the end of primary wave 1 to the last high, then place a parallel copy on the end of primary wave 2. Keep redrawing the channel as price continues higher. When primary wave 3 is complete, then this channel would be drawn using Elliott’s first technique about the impulse. The lower edge may provide support.
Primary wave 4 may not move into primary wave 1 price territory below 1,346.45. Because the data used for this analysis is cash market data no overlap between primary waves 4 and 1 should be allowed. The invalidation point is absolute.
The bullish and bearish wave counts will diverge when the next wave upwards, which for this bullish wave count is labelled intermediate wave (5), is complete. At that stage, this bullish wave count will expect only a consolidation or pullback for primary wave 4, but the bearish wave count will expect a trend change. The price point 1,346.45 clearly differentiates the two ideas.
DAILY CHART
Click chart to enlarge.
This daily chart focusses on the impulse of primary wave 3.
Primary wave 3 may only subdivide as an impulse. Primary wave 3 has now moved above the end of primary wave 1, meeting a core Elliott wave rule.
When it arrives, primary wave 4 may not move into primary wave 1 price territory below 1,346.45.
Intermediate wave (5) may exhibit further strength. The target for primary wave 3 is calculated using the most common Fibonacci ratio to primary wave 1.
The structure of primary wave 3 as an incomplete impulse for this wave count is seen in exactly the same way as the incomplete impulse for intermediate wave (C) in the bearish daily chart. Both wave counts view a fourth wave triangle now complete. This bullish wave count sees the triangle as intermediate wave (4).
Look out now for the possibility of another blow off top as intermediate wave (5) to end primary wave 3 comes to an end.
HOURLY CHART
Click chart to enlarge.
The triangle of intermediate wave (4) now looks complete at all time frames. The upwards movement at the end of this last session has closed well above the upper triangle trend line. This looks like an upwards breakout.
Intermediate wave (5) must subdivide as a five wave motive structure, most likely an impulse. Within intermediate wave (5), minute wave ii may not move beyond the start of minute wave i below 1,400.64.
TECHNICAL ANALYSIS
MONTHLY CHART
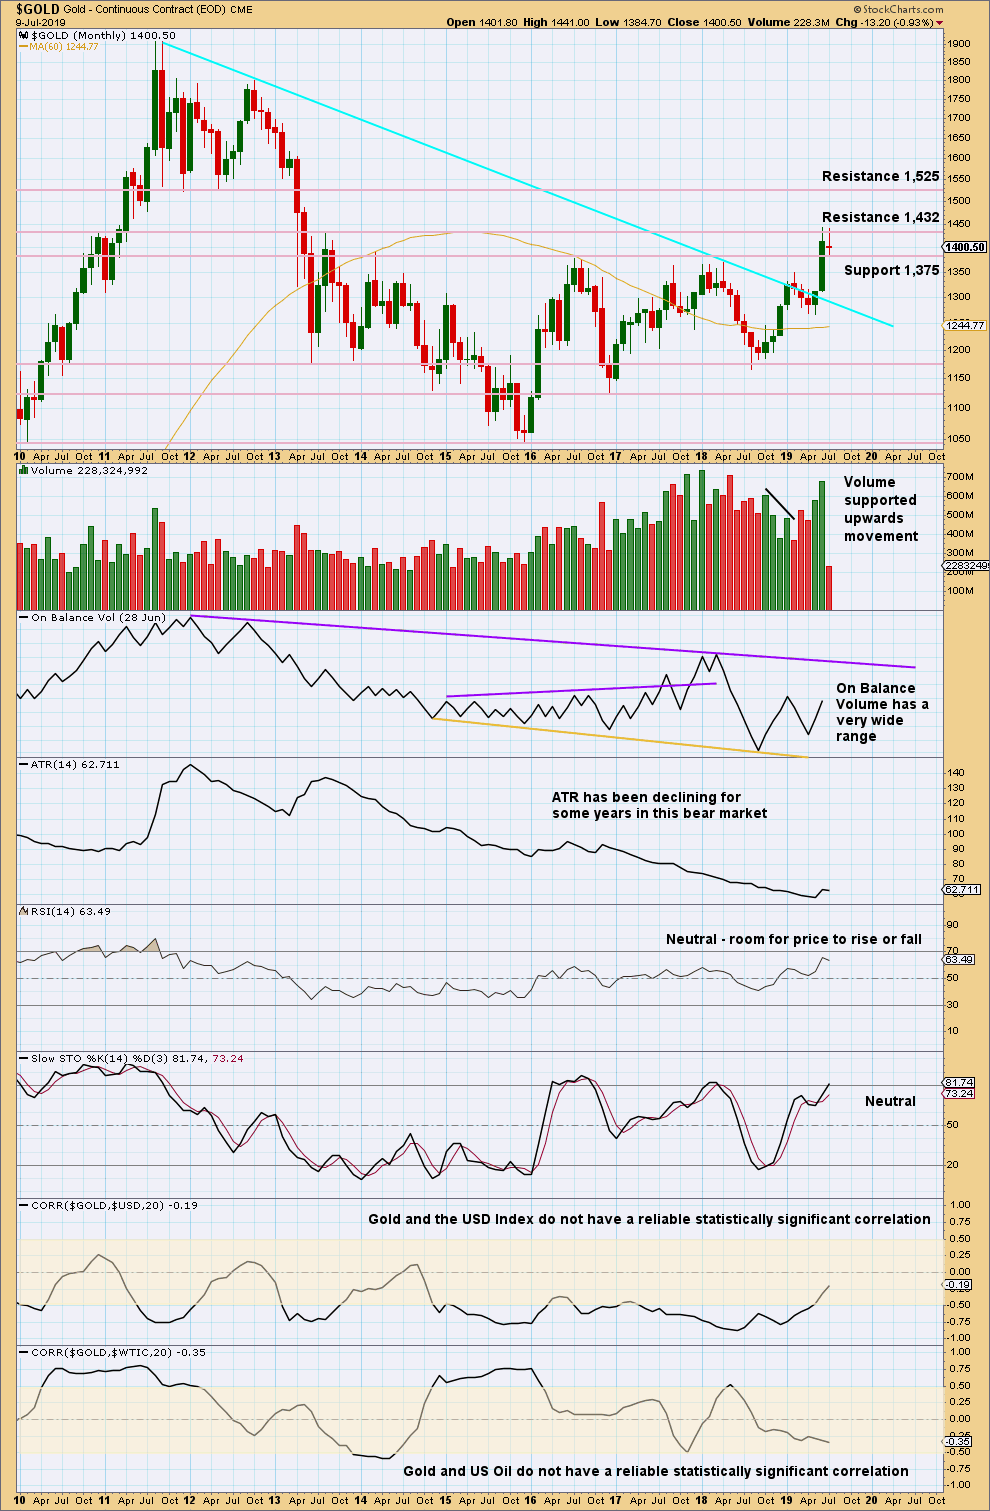
Click chart to enlarge. Chart courtesy of StockCharts.com.
Gold has effected an upwards breakout above multi-year resistance and above the cyan bear market trend line. Look for next resistance identified on the chart.
WEEKLY CHART
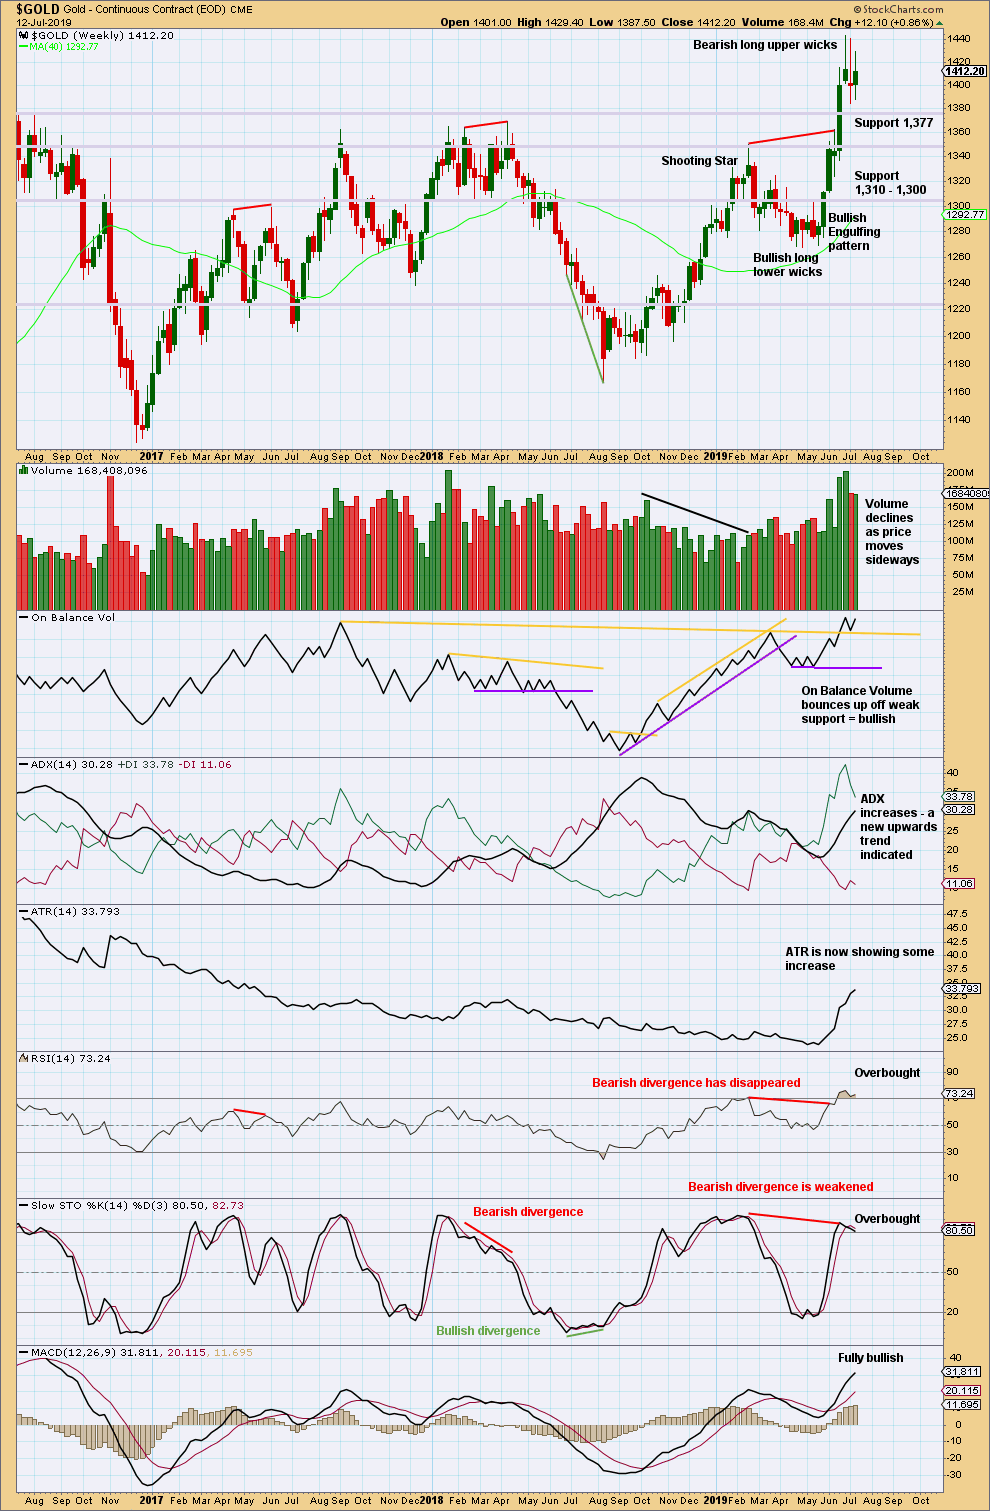
Click chart to enlarge. Chart courtesy of StockCharts.com.
Gold has broken out of a multi-year consolidation, which saw resistance about 1,375. The breakout has support from volume, so confidence may be had in it.
Price now has some strength with rising ATR. Conditions remain overbought. The pullback so far has not relieved extreme conditions and has lasted only two weeks.
Support about 1,375 continues to hold.
When Gold has a strong trend, conditions may reach extreme and may remain there for some time while the trend continues and price moves a substantial distance.
DAILY CHART
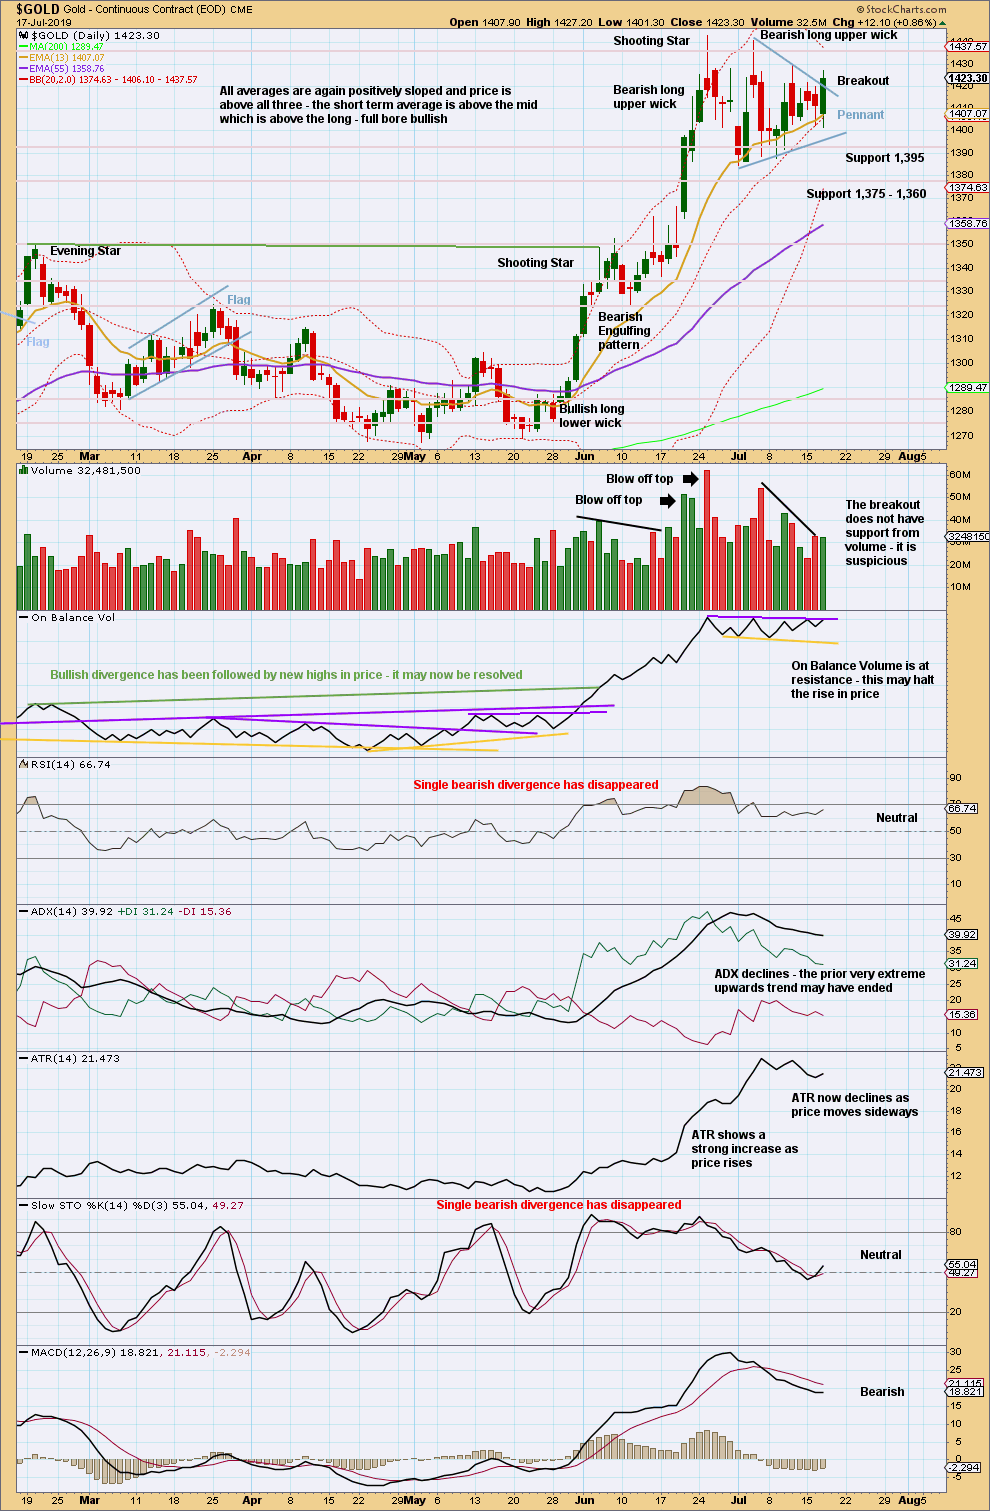
Click chart to enlarge. Chart courtesy of StockCharts.com.
A pennant pattern may be complete, lasting 14 sessions. The close above the upper edge of the pennant trend line today may be an upwards breakout. However, upwards breakouts require support from volume for confidence and this one lacks that. This breakout is so far suspicious.
If another daily candlestick closes green with support from volume, then confidence may be had in the upwards breakout. That is not the case today with the data in hand.
It is possible that the consolidation of the last 15 sessions may continue sideways and lower to test support more strongly about 1,375 before price moves up and away.
GDX WEEKLY CHART
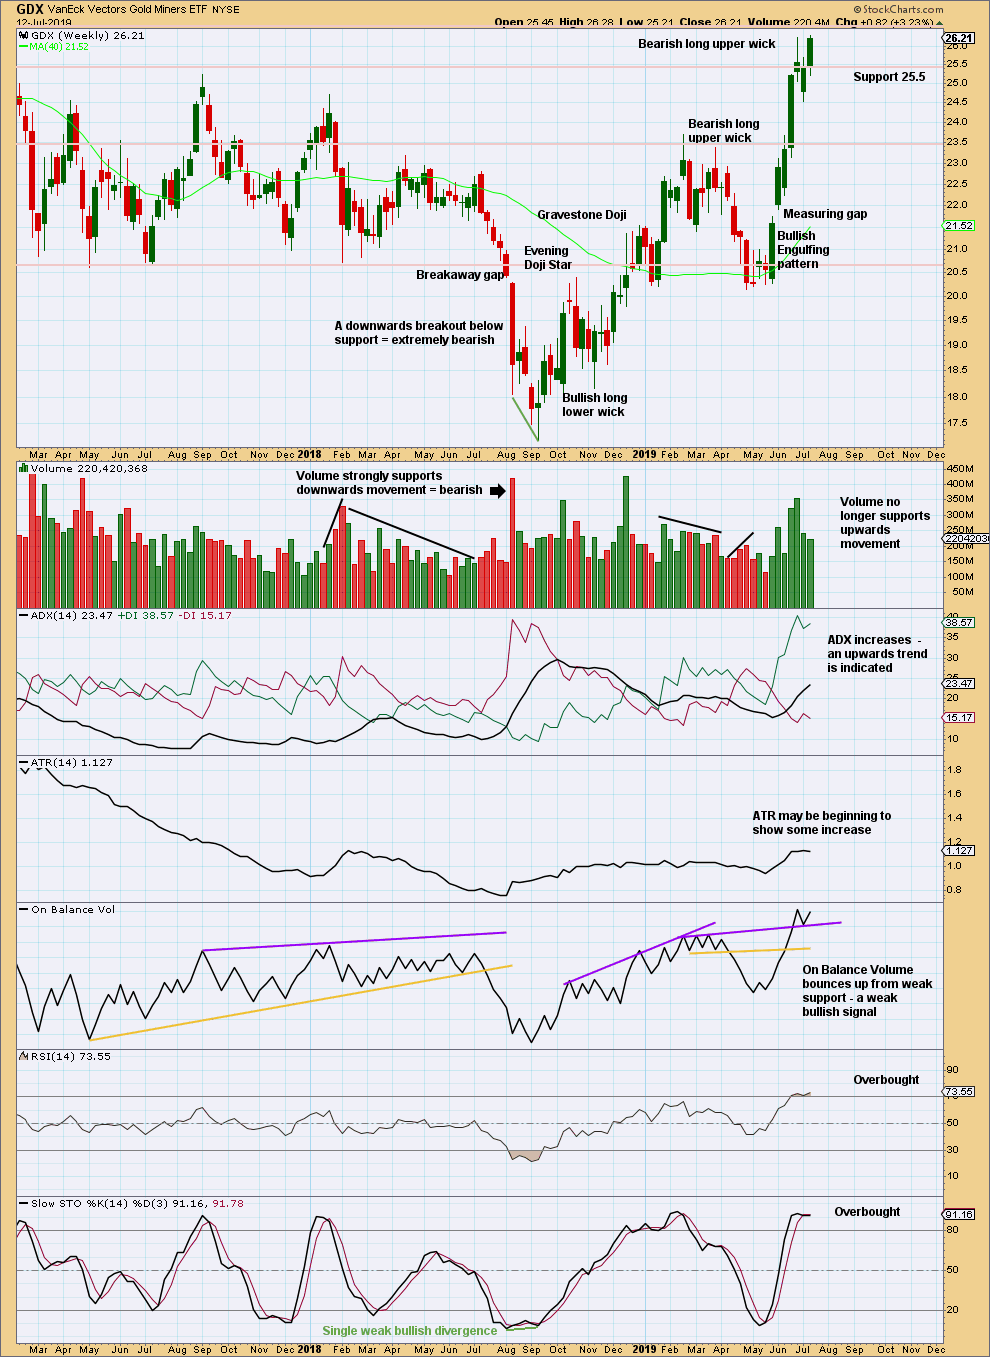
Click chart to enlarge. Chart courtesy of StockCharts.com.
The upwards trend continues, but conditions are now overbought. This can continue for a while during a strong trend. At this stage, there are no signs of a reversal.
Last week price has closed near the high. This is bullish, suggesting more upwards movement this week.
Weak volume is a slight concern.
GDX DAILY CHART
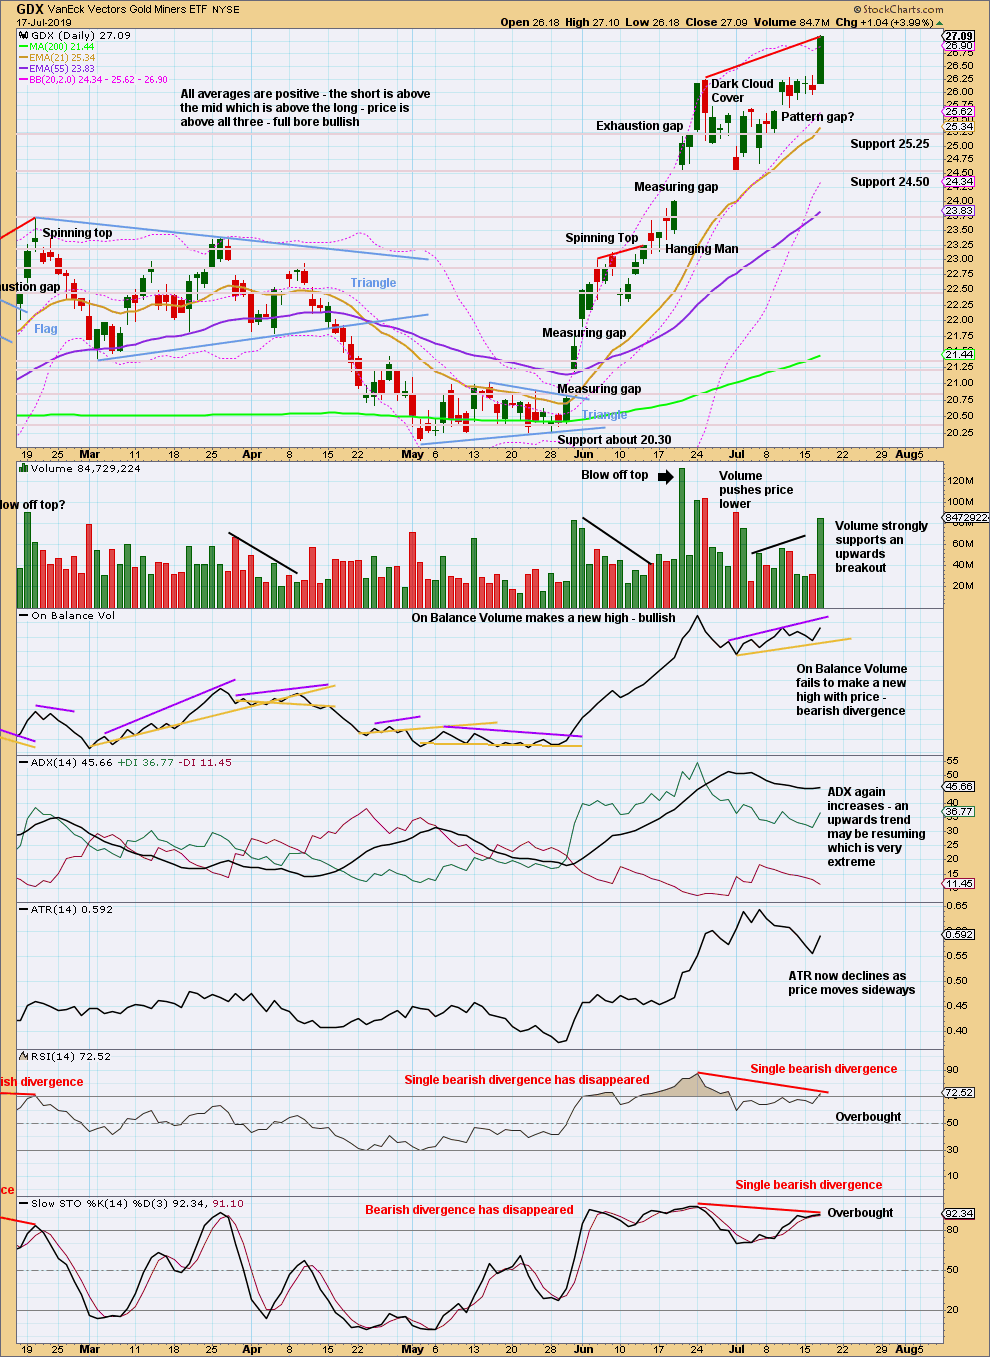
Click chart to enlarge. Chart courtesy of StockCharts.com.
Today completes an upwards breakout from a small consolidation. This is not suspicious for GDX because it has support from volume.
However, upwards movement here may be relatively short lived: ADX indicates a very extreme trend and there is some weakness with bearish divergence between price and RSI. At this time, GDX looks vulnerable to a larger consolidation or a trend change developing.
A short-term target taken from the width of the last consolidation may be about 28.02.
Published @ 07:57 p.m. EST.
—
Careful risk management protects your trading account(s).
Follow my two Golden Rules:
1. Always trade with stops.
2. Risk only 1-5% of equity on any one trade.
—
New updates to this analysis are in bold.
My eye was fixed yesterday most efficiently with a laser, and now I have as close to guaranteed continued use of it as I’m ever going to get. So that’s good. All recovered and ready to look at lots of charts for you today.
Thank you everybody for your well wishes and your patience.
Pleased to hear that Lara, nothing more important than our health.
Updated hourly chart:
The last hourly chart was invalidated, this downwards move can’t be a fourth wave correction within an ongoing impulse higher, so the last wave up must be over.
It will fit as a complete impulse with disproportionate second and fourth wave corrections, giving it a three wave look. This is typical behaviour for commodities, so this is okay for Gold.
Downwards movement fits as a nearly complete double zigzag. It may end closer to the 0.618 Fibonacci ratio.
What is the most feasible wave count after today’s low?
A good question, chart above answers it.
Updated TA chart:
Some confidence may be had in this breakout as it now has support from volume and a bullish signal from On Balance Volume
Bear charts updated:
Weekly:
No change. The first target is now extremely close, the structure may not be able to complete at this point, the second target may now be more likely for this count.
Daily bear chart updated:
No change. The first target is almost met.
Be aware though that while it is clear we have an upwards breakout, the fact that it was from a triangle does offer slight support to this wave count. Gold often exhibits surprisingly short and brief fifth waves out of its triangles, this count would expect that tendency.
While it’s clear Gold is within a bullish trend and the breakout from multi year consolidation is highly significant, be aware this also is a viable count.
Hourly chart:
Same as the bullish hourly chart in that a fourth wave triangle completed, now a fifth wave unfolding higher.
Invalidation point is the same for both charts today.
crazy how the move up stopped exactly at 1452, makes you wonder.. but it’s hard to count an complet impulse to this point
It’s easy to count a complete impulse if you allow for a long lasting wave 2 and a quick shallow wave 4.
It took me a while to get used to this tendency for this market (and Oil), but once I wrapped my head around it, lots of movement fell into place better.
Pretty much all the TA text books talk about the tendency of commodities to exhibit blow off tops and capitulation spikes. This translates into Elliott wave as strong fifth waves.
While this tendency is especially prevalent for fifth waves to end third wave impulses one degree higher (so prevalent in fact that it should be the expected norm) it can happen to fifth waves in any position one degree higher; i.e. fifth waves to end a first wave impulse, or an A wave impulse.
wave C has only these two options? can it be 1.23 x A or 1.618 x A?
Wave C can be any length it likes. Most commonly equality with A, but it can exhibit any Fibonacci ratio to A, or none at all.
Also, 1.23 is not a Fibonacci ratio.
Fibonacci Ratios are ratios are the result converged upon as you move up the Fibonacci sequence, derived by dividing one Fibonacci number by another a set number of Fibonacci numbers before or after. If that’s confusing, take a look at this for a clearer explanation of the correct mathematical definition and process to obtain Fibonacci Ratios.
Bull count charts updated:
Weekly:
The breakout looks strong, this looks like a continuation of an upwards trend.
Daily chart:
A close to a new high above intermediate (3) now is significant. Targets remain the same.
Hourly chart updated:
The triangle is complete, this is an upwards breakout. Expect more upwards movement.
Minute iv may not move into minute i price territory.
I’ve just sent an email to everyone letting you know that I will most likely not be able to do your analysis today. I have to visit a hospital for an eye examination, and the procedure may leave me unable to see for a few hours.
If I am unable to see, I’ll not be able to complete your analysis.
I’ll be updating all charts here in comments right before I go into hospital, I’ll make a comment with each.
Normal analysis resumes tomorrow.
Thank you all very much for your understanding and patience.
Best of luck in Hospital Lara.
thank you very much Keith. I’m sure it’ll be all AOK
It’s a beautiful thing!
At this stage the breakout is strong and if volume supports it we can today have a fair amount of confidence in it.
For the very short term the invalidation point may be moved up.
I doubt the bullish scenario due to all the reasons Lara pointed out.
I am trading y=w, which should be met at the blue one.
Breakout is now looking suspect.
Wave 4 may be morphing into something else other than triangle.
I’ve heavily reduced my gold/silver futures positions. The traders seem to be in control of gold, and silver needs a rest. Since I’m still firmly bullish, I’ll be buying any price declines or slowly reload if price stays sticky for the next week.
Corey
why do you say suspect? looks like it goes for the 61.8 retracement typical for wave 2
I would have preferred a nice strong continuation day after the break of the triangle. However since I’m leaning in the bullish camp I’ll reload if we go above yesterday’s high and I’m also buying on these dips … just not 100% loaded yet due to the uncertainty.
I’m so cautious right now. Sentiment is extremely bullish, gold and silver both just hit Lara’s targets for the bear counts to kick back in, real rates can only go higher from here (maybe), dollar is strongest game in town, oil might be in major bear market…lot’s of risk.
The way I’ve decided to play this is to buy about half my normal Futures position on this test down of the breakout of the last high. Many times gold will break a previous barrier and then go back the other direction to test the breakout spot which I think it might be doing right now. This sets up a series of embedded 1-2 waves… If gold unleashes higher, this could be a massive 5th wave. Lots of risk though.