
Upwards movement was expected to continue for the week for Silver, but that is not what happened. A strong downwards day on Friday suggests a new alternate wave count, although price remains above invalidation points.
Summary: A new low below 14.288 would indicate a third wave down should be underway. The mid-term target would then be at 10.05.
If the bounce continues above 16.195, then the target for it to end is at 16.600.
If price makes a new high by any amount at any time frame above 17.680, then only the very bullish Elliott wave count would remain.
Monthly charts were reviewed here.
ELLIOTT WAVE COUNTS
BEARISH WAVE COUNT
WEEKLY CHART
Click chart to enlarge.
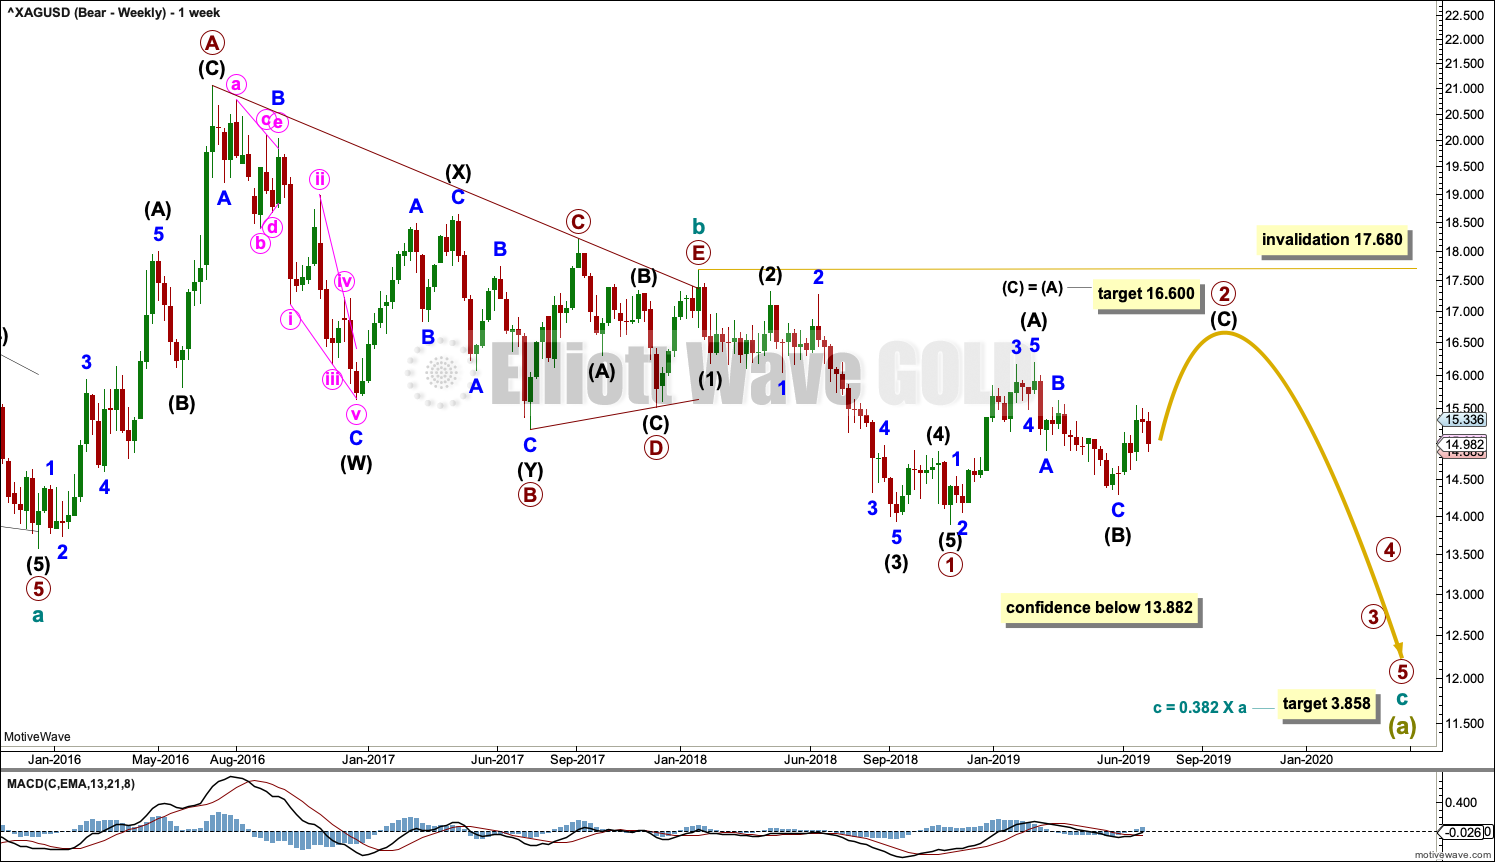
The basic Elliott wave structure is five steps forward followed by three steps back. At this time, it is expected that Silver is within a very large three steps back pattern that began at the all time high in April 2011.
Three steps back are almost always labelled in Elliott wave as A-B-C. This Elliott wave count expects that wave A is incomplete, and this is labelled Super Cycle wave (a).
The Elliott wave structure for Super Cycle wave (a) may be a zigzag. Zigzags subdivide 5-3-5. Within this zigzag, cycle waves a and b may be complete. Cycle wave c must subdivide as a five wave Elliott wave structure, most likely an impulse.
Within the impulse of cycle wave c, if primary wave 2 continues higher, it may not move beyond the start of primary wave 1 above 17.680.
A new alternate daily chart below looks at the possibility that primary wave 2 was over at 16.195 on the 20th of February.
Within the zigzag of Super Cycle wave (a), it would be extremely likely for cycle wave c to move below the end of cycle wave a at 13.569 to avoid a truncation. The target would see this achieved.
The daily chart below focusses on price movement from the end of primary wave 1.
DAILY CHART
Click chart to enlarge.
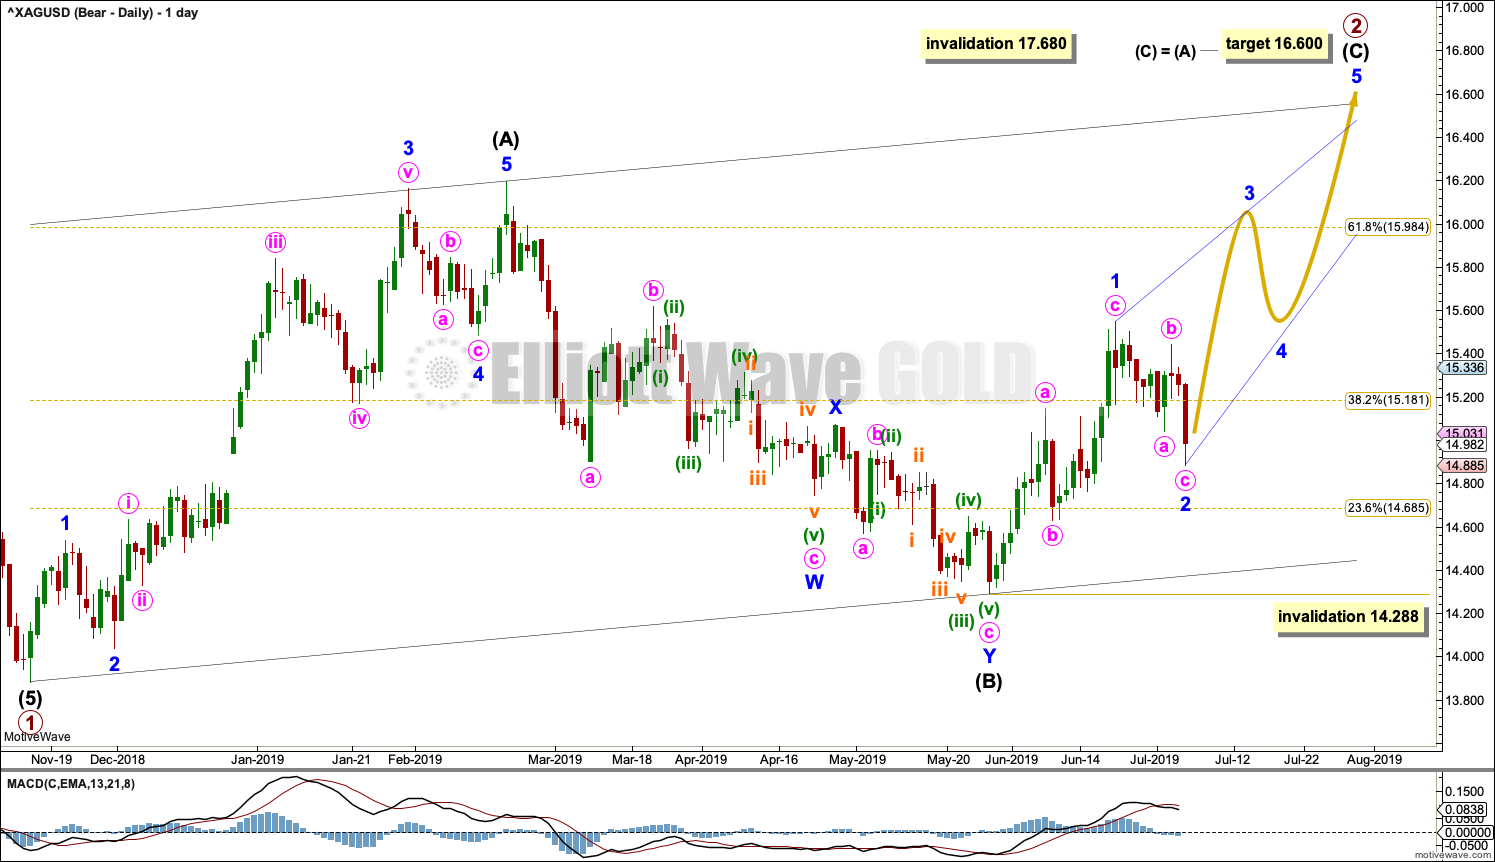
Primary wave 2 may be an incomplete zigzag.
Intermediate wave (C) would be very likely to make at least a slight new high above the end of intermediate wave (A) at 16.195 to avoid a truncation. The target expects to see the most common Fibonacci ratio between intermediate waves (A) and (C).
Intermediate wave (C) may only subdivide as a five wave structure, either an impulse or an ending diagonal. Overlapping at the end of this week suggests a diagonal should now be considered.
All sub-waves within ending diagonals must subdivide as zigzags and the fourth wave should overlap first wave territory. The most common type of diagonal is contracting where the third wave is shorter than the first, the fourth wave is shorter than the second, the fifth wave is shorter than the third, and the trend lines converge. An ending contracting diagonal is now considered.
Within the diagonal, minor wave 1 fits well as a zigzag and minor wave 2 may be complete or may move lower. The most common depth for second and fourth waves within diagonals is from 0.66 to 0.81 the prior wave giving a common range for minor wave 2 to end from 14.717 to 14.528. Minor wave 2 may not move beyond the start of minor wave 1 below 14.288.
Ending diagonals in C wave positions are not as common as impulses, so an alternate idea is considered below.
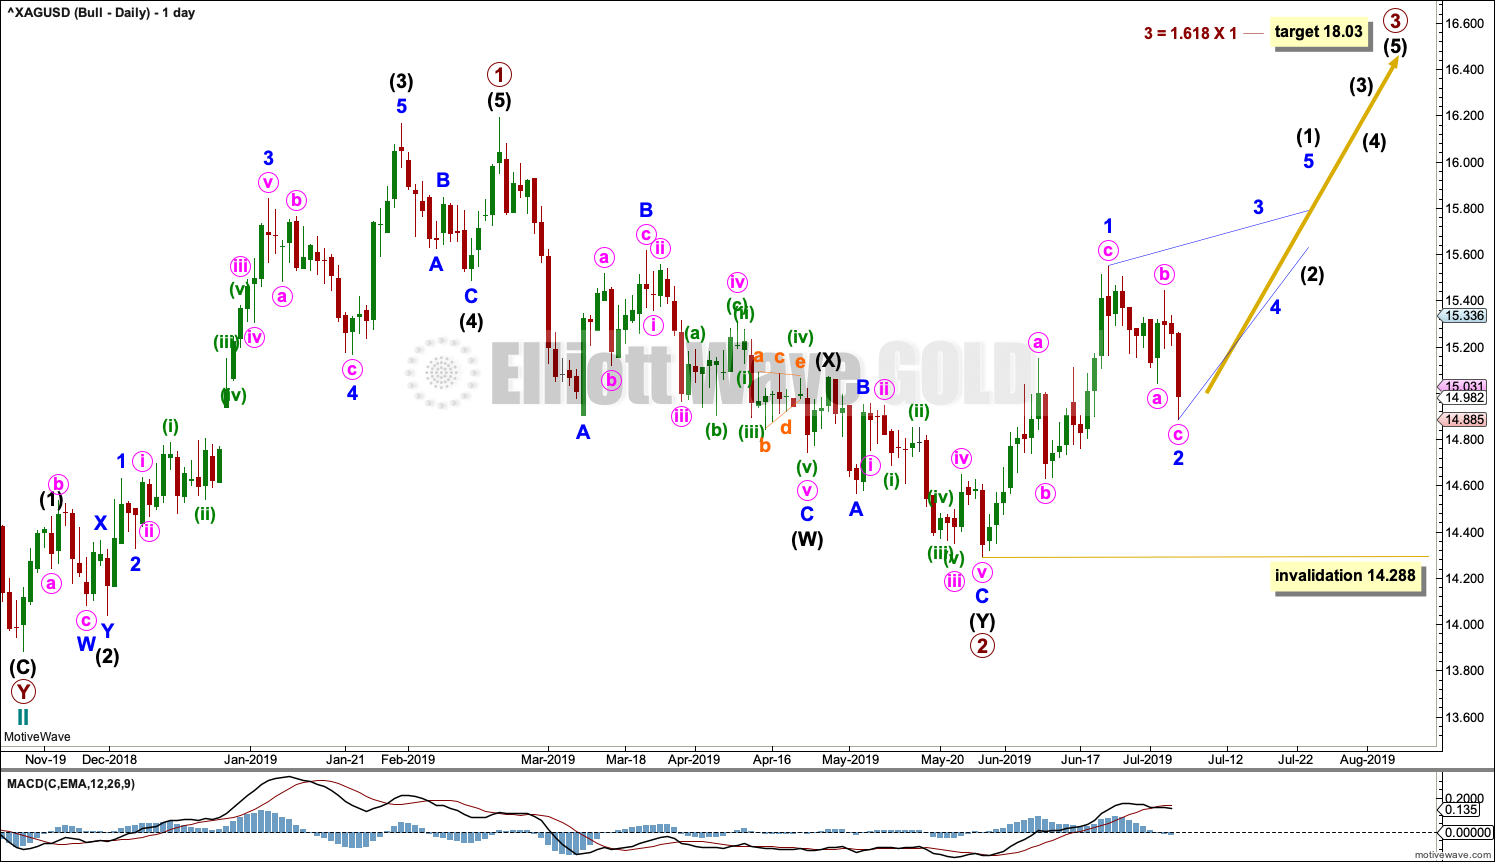
ALTERNATE DAILY CHART
Click chart to enlarge.
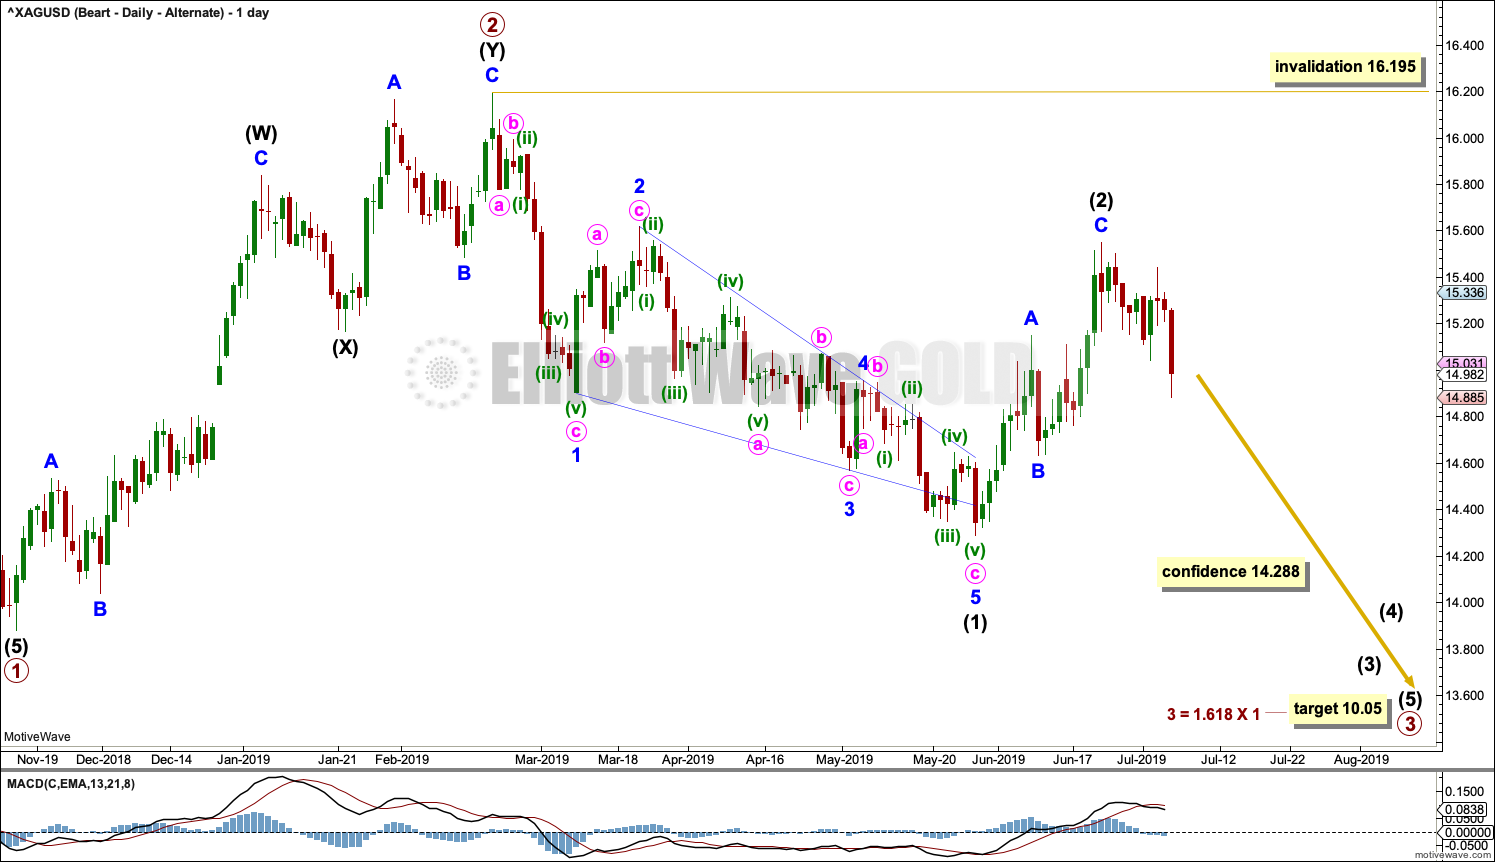
It is still possible that primary wave 2 was over on the 20th of February at 16.195. It will fit as a completed double zigzag.
Primary wave 3 may have begun there. A target for it to end is calculated using the most common Fibonacci ratio to primary wave 1.
Primary wave 3 may only subdivide as an impulse. Within the impulse, intermediate wave (1) may be complete as a leading contracting diagonal and intermediate wave (2) may also now be complete as a zigzag; although if it moves higher as a double zigzag, intermediate wave (2) may not move beyond the start of intermediate wave (1) above 16.195.
BULLISH WAVE COUNT
WEEKLY CHART
Click chart to enlarge.
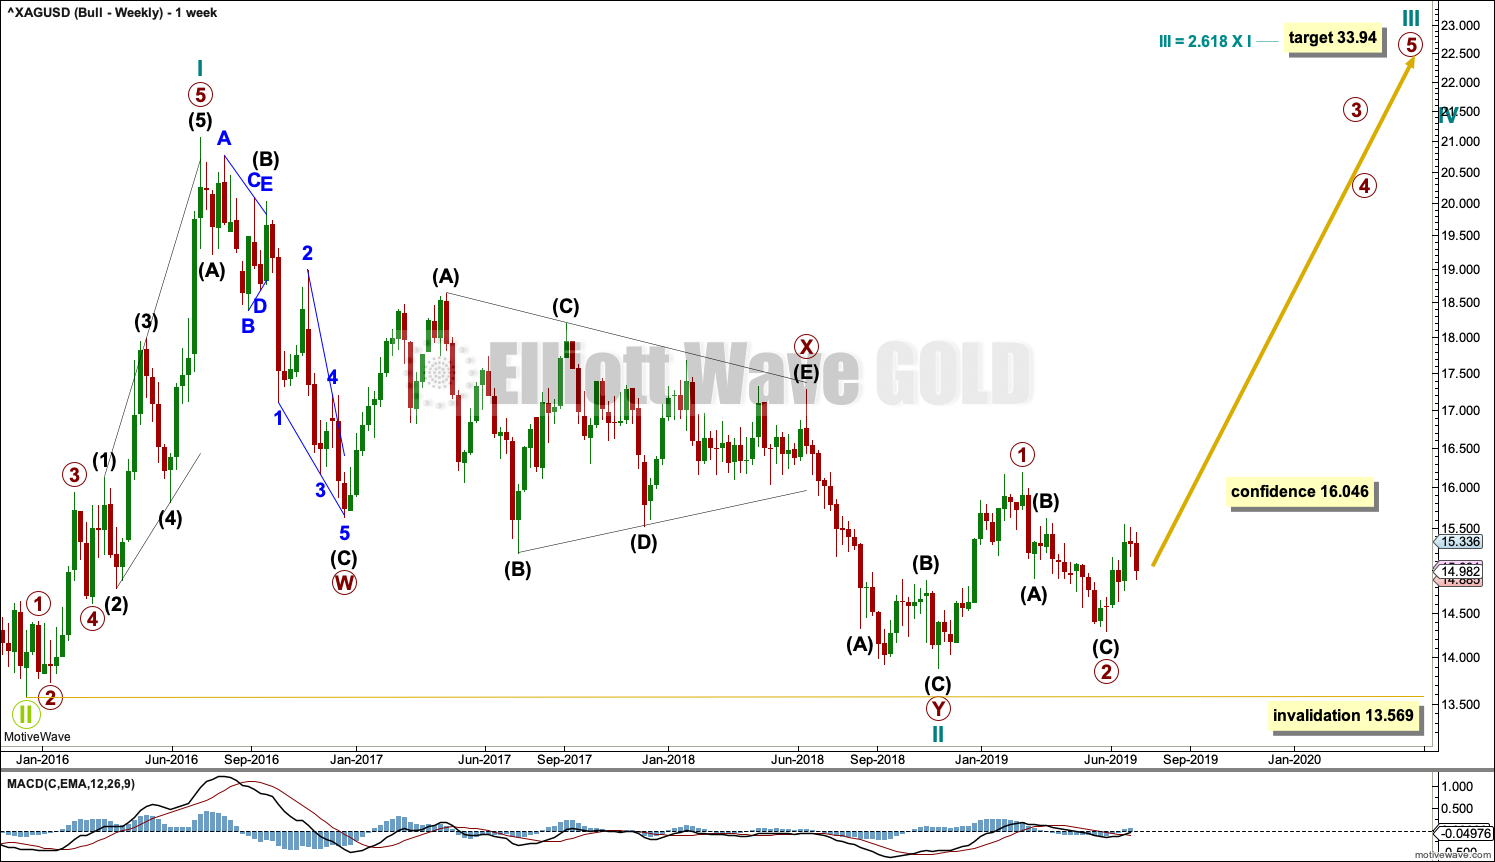
This alternate Elliott wave count sees the three steps back pattern as complete and a new bull market beginning for Silver at the low in December 2015.
A new bull market should begin with a five wave structure upwards. This is labelled cycle wave I.
Following five steps forward should be three steps back. This is labelled cycle wave II. The Elliott wave corrective structure of cycle wave II is labelled as a double zigzag, which is a fairly common structure.
If it continues any further, then cycle wave II may not move beyond the start of cycle wave I below 13.569.
DAILY CHART
Click chart to enlarge.
If cycle wave II is over, then the new trend up for cycle wave III should begin with a five wave structure. This is labelled primary wave 1. The structure may now be complete.
Five steps up should be followed by three steps back, labelled primary wave 2. Primary wave 2 may now be also complete as a double zigzag.
A target is calculated for primary wave 3 that expects to exhibit a common Fibonacci ratio to primary wave 1.
Primary wave 3 may only subdivide as an impulse. Within primary wave 3, intermediate wave (1) may subdivide either as an impulse or a leading diagonal. Overlapping now suggests a diagonal may be considered.
Within leading diagonals, sub-waves 1, 3 and 5 most commonly subdivide as zigzags but may also appear to be impulses. Wave 4 must overlap wave 1 price territory. So far minor wave 1 fits as a zigzag. Minor wave 2 may be a complete zigzag, or it may move lower. Minor wave 2 may not move beyond the start of minor wave 1 below 14.288.
TECHNICAL ANALYSIS
WEEKLY CHART
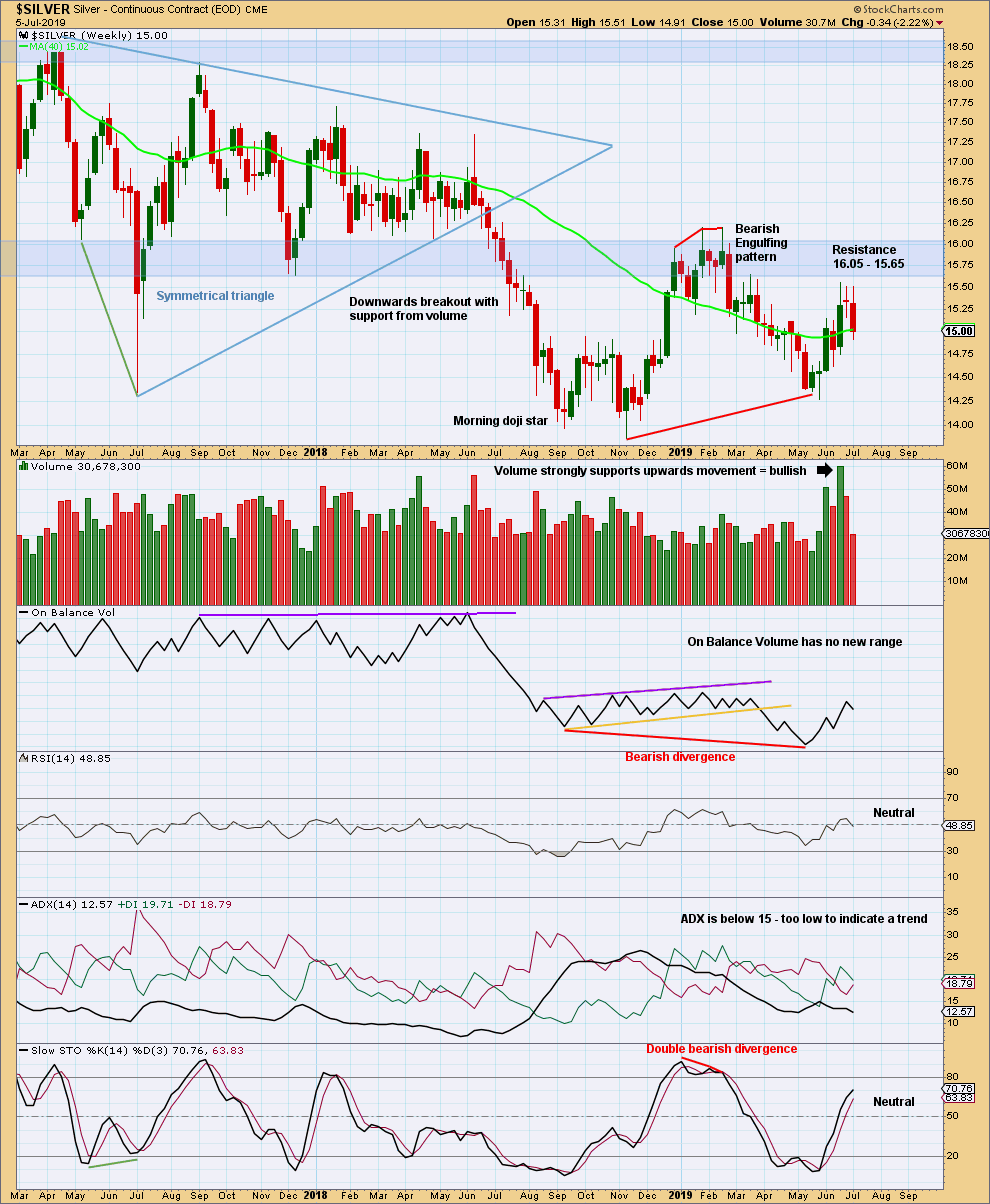
Click chart to enlarge. Chart courtesy of StockCharts.com.
Look for strong resistance in a zone about 15.65 to 16.05.
Resistance is holding at this stage. It looks like it may force a reaction down from here. This week price fell of its own weight.
DAILY CHART
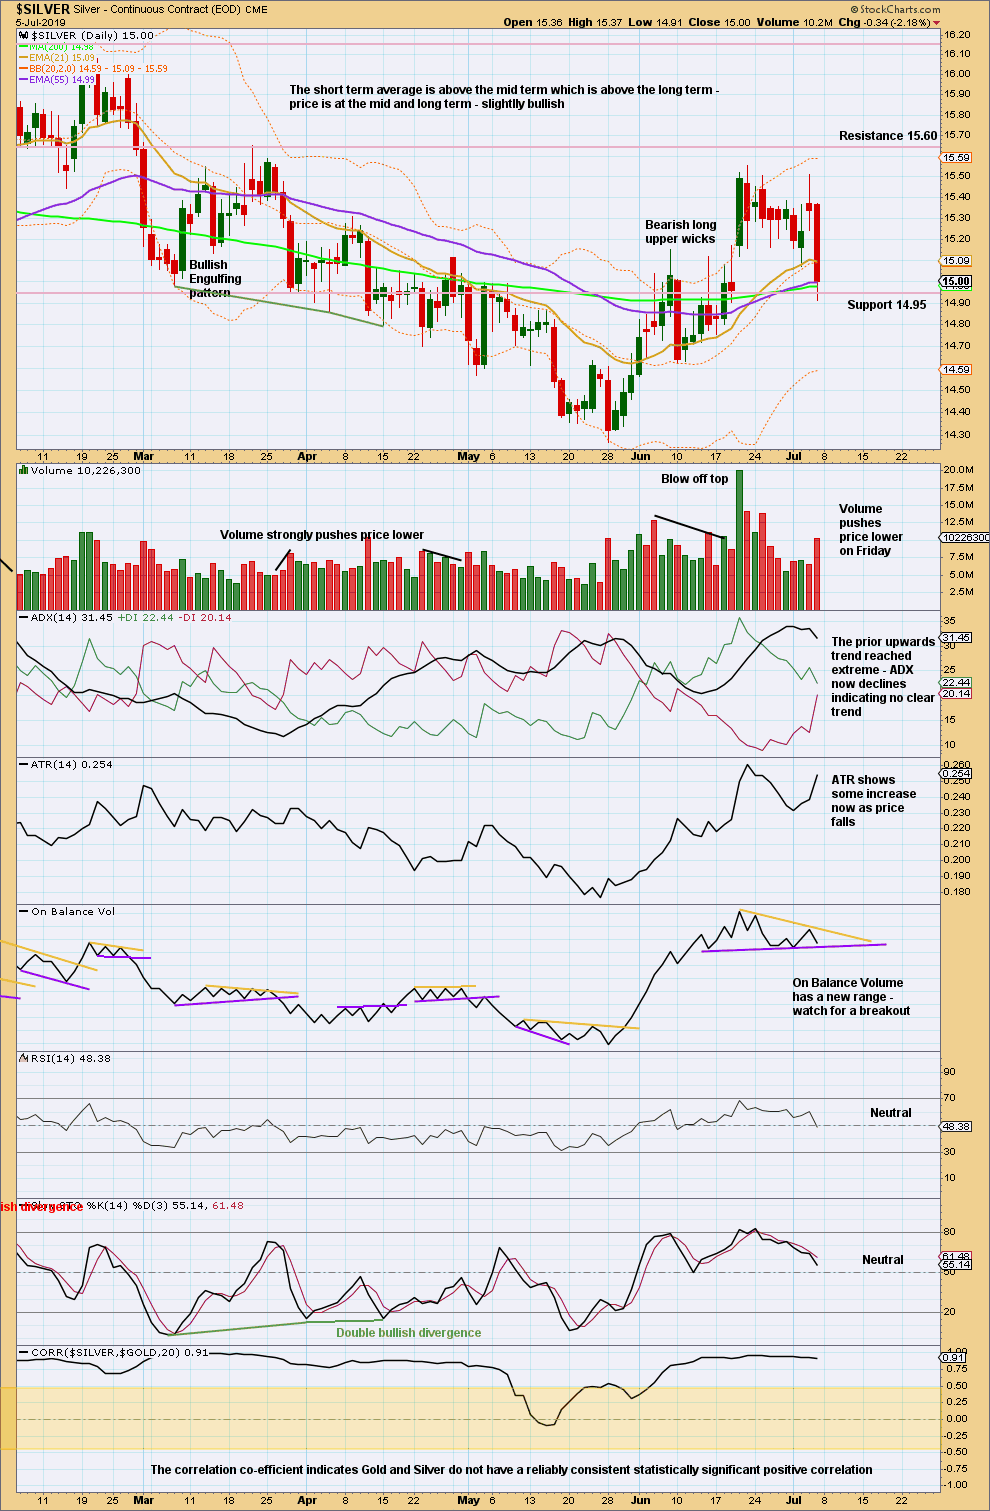
Click chart to enlarge. Chart courtesy of StockCharts.com.
The pennant shown in last week’s analysis has failed, so it is removed. Pennants are continuation patterns; there was no upwards breakout.
Price has turned around at resistance where ADX showed the upwards trend reached extreme. Volume is pushing price lower. It looks like more downwards movement may result, at least for the short term now.
Published @ 01:19 a.m. EST on July 6, 2019.
—
Careful risk management protects your trading account(s).
Follow my two Golden Rules:
1. Always trade with stops.
2. Risk only 1-5% of equity on any one trade.
—
New updates to this analysis are in bold.
I’m starting to believe in the bullish silver count. Gold and silver are so resilient on dips. I’ve rebought all my longs and then some. Still looking for 20 by end of year and 28ish by early spring.