
A small amount of upwards movement for the week fits both the main bearish Elliott wave count and the bullish Elliott wave count. At this stage, both wave counts expect the same structure is unfolding upwards.
Summary: A new low below 14.288 would indicate a third wave down should be underway. The mid-term target would then be at 10.05.
If the bounce continues above 16.195, then the target for it to end is at 16.600.
If price makes a new high by any amount at any time frame above 17.680, then only the very bullish Elliott wave count would remain.
Monthly charts were reviewed here.
ELLIOTT WAVE COUNTS
BEARISH WAVE COUNT
WEEKLY CHART
Click chart to enlarge.
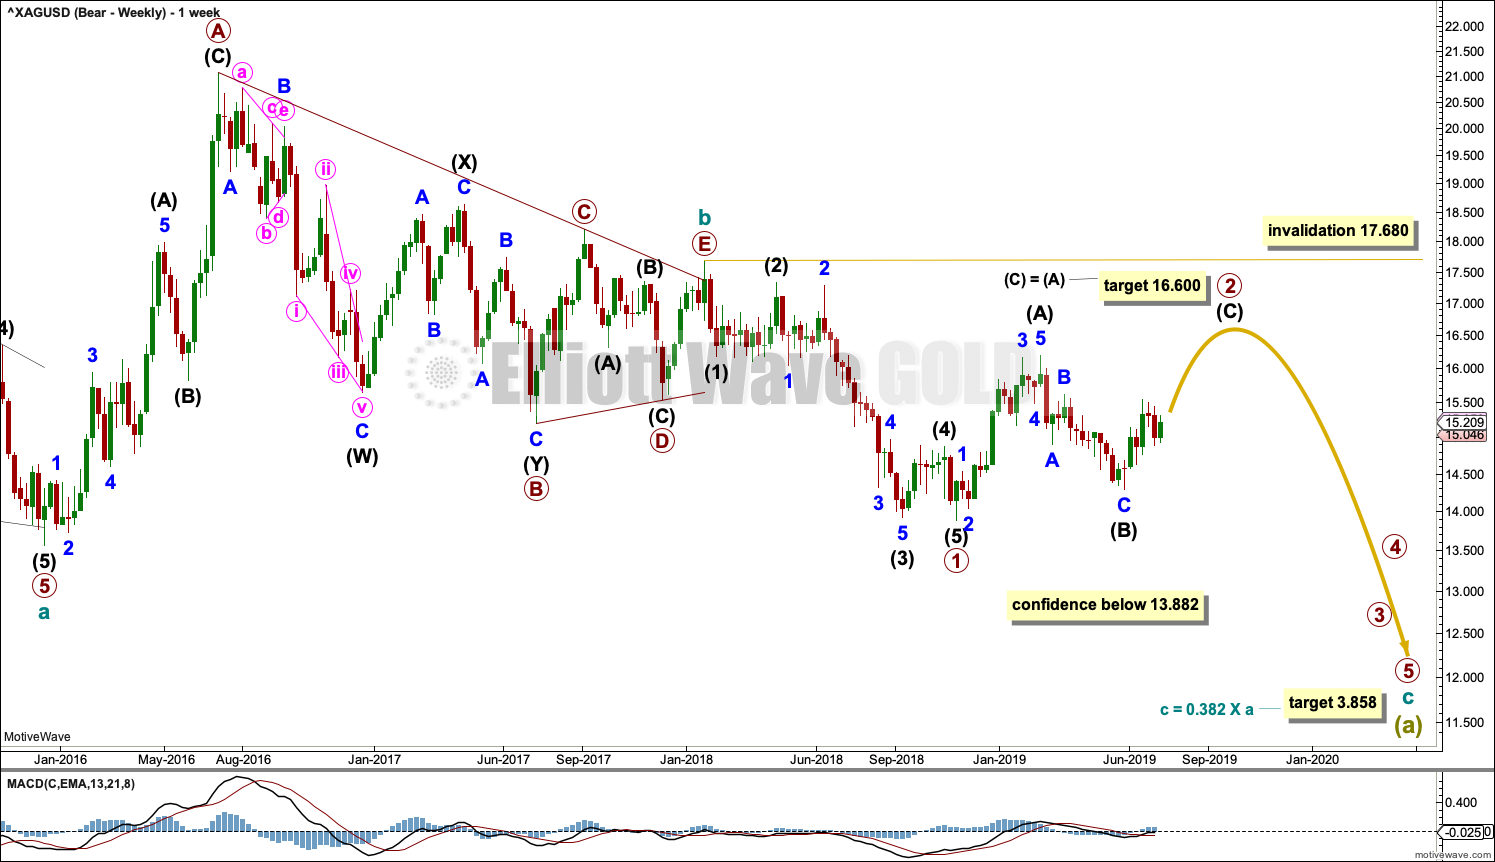
The basic Elliott wave structure is five steps forward followed by three steps back. At this time, it is expected that Silver is within a very large three steps back pattern that began at the all time high in April 2011.
Three steps back are almost always labelled in Elliott wave as A-B-C. This Elliott wave count expects that wave A is incomplete, and this is labelled Super Cycle wave (a).
The Elliott wave structure for Super Cycle wave (a) may be a zigzag. Zigzags subdivide 5-3-5. Within this zigzag, cycle waves a and b may be complete. Cycle wave c must subdivide as a five wave Elliott wave structure, most likely an impulse.
Within the impulse of cycle wave c, if primary wave 2 continues higher, it may not move beyond the start of primary wave 1 above 17.680.
An alternate daily chart below looks at the possibility that primary wave 2 was over at 16.195 on the 20th of February.
Within the zigzag of Super Cycle wave (a), it would be extremely likely for cycle wave c to move below the end of cycle wave a at 13.569 to avoid a truncation. The target would see this achieved.
The daily chart below focusses on price movement from the end of primary wave 1.
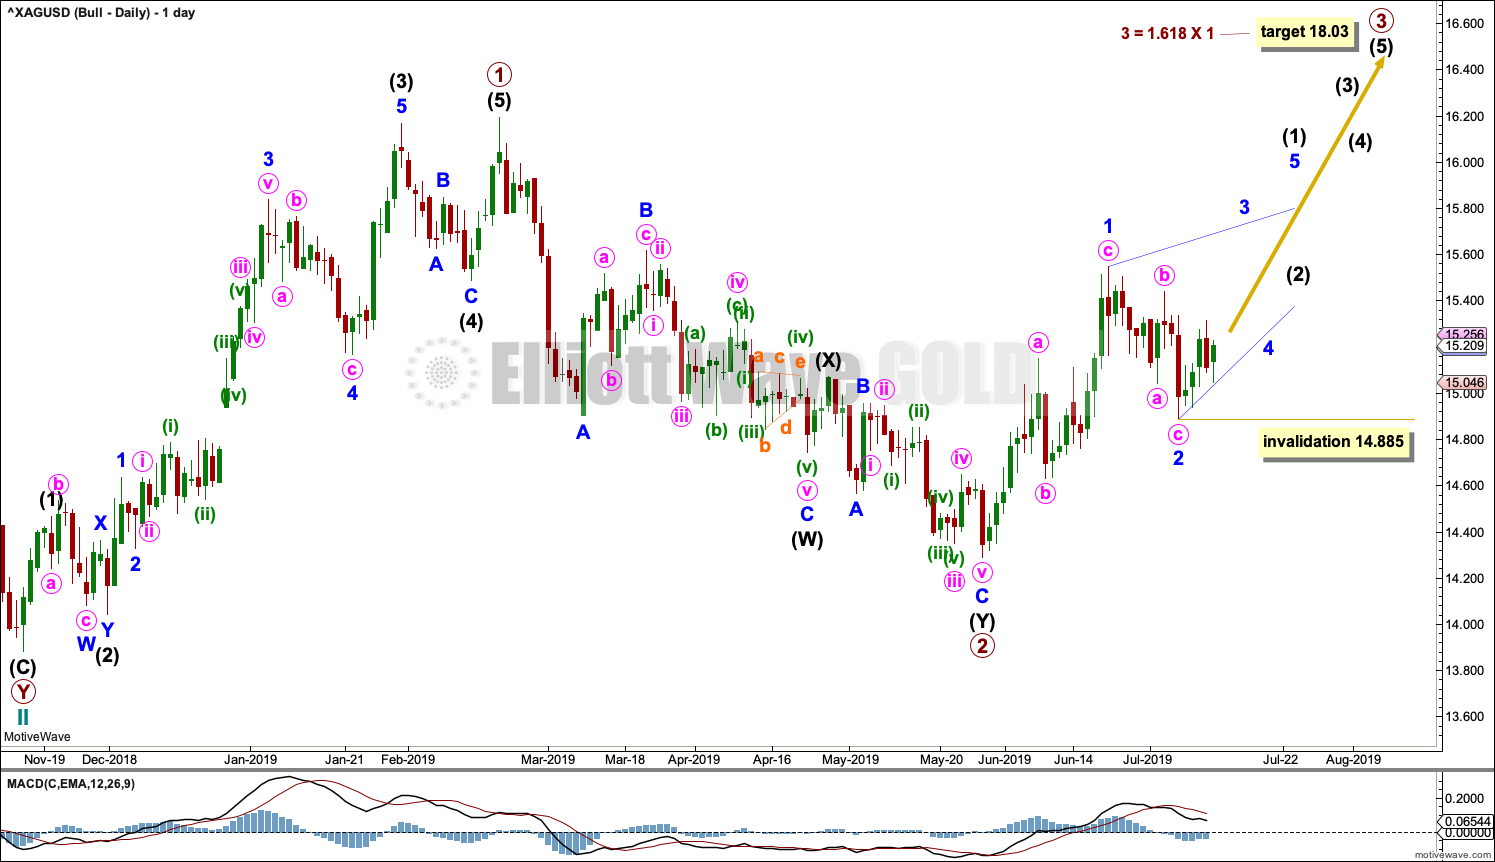
DAILY CHART
Click chart to enlarge.
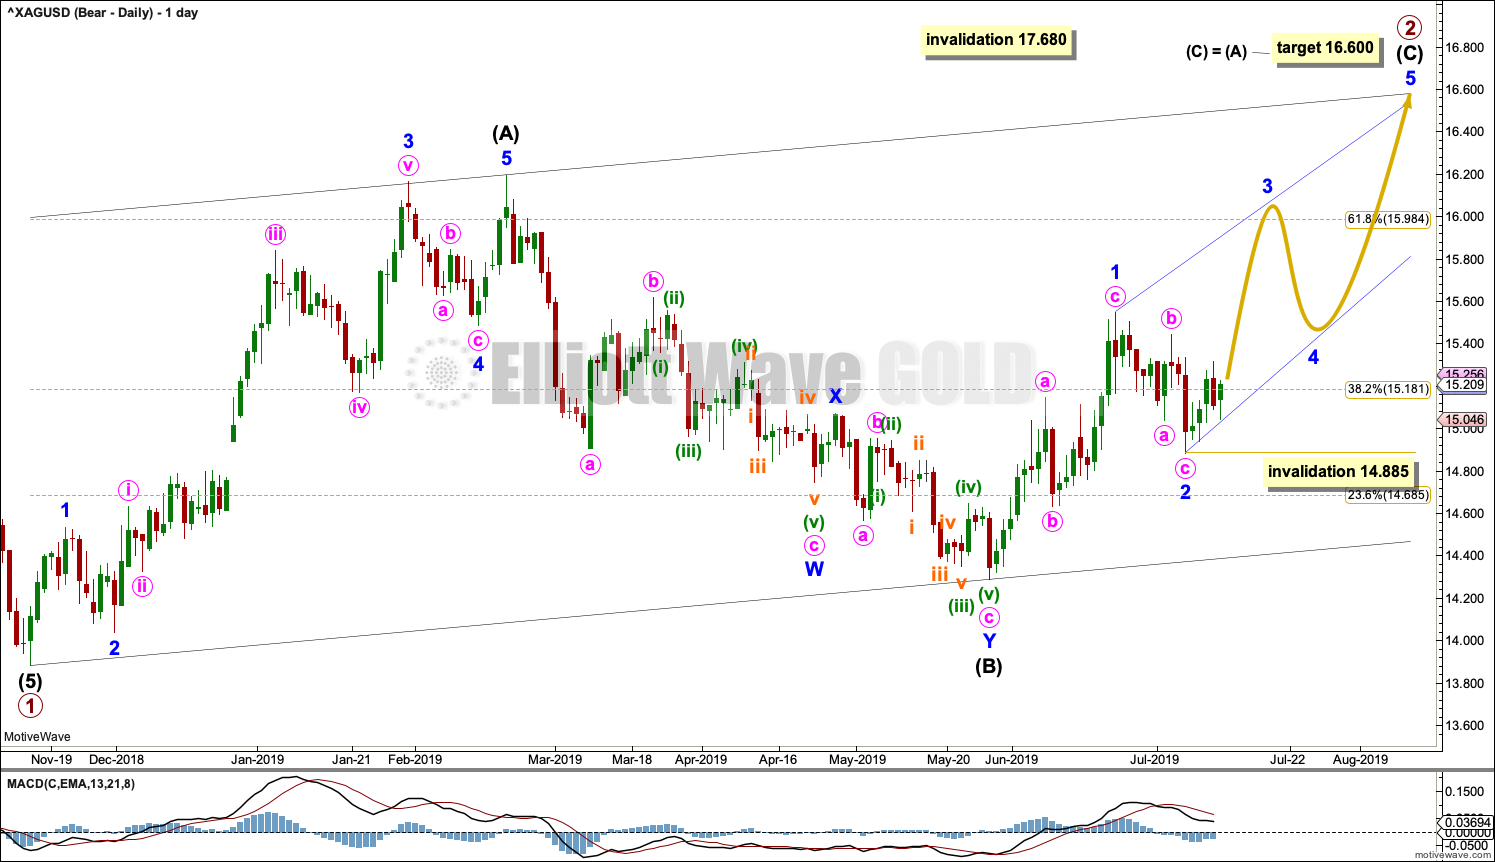
Primary wave 2 may be an incomplete zigzag.
Intermediate wave (C) would be very likely to make at least a slight new high above the end of intermediate wave (A) at 16.195 to avoid a truncation. The target expects to see the most common Fibonacci ratio between intermediate waves (A) and (C).
Intermediate wave (C) may only subdivide as a five wave structure, either an impulse or an ending diagonal. Overlapping now suggests a diagonal should now be considered.
All sub-waves within ending diagonals must subdivide as zigzags and the fourth wave should overlap first wave territory. The most common type of diagonal is contracting where the third wave is shorter than the first, the fourth wave is shorter than the second, the fifth wave is shorter than the third, and the trend lines converge. An ending contracting diagonal is now considered.
Within the diagonal, minor wave 1 fits well as a zigzag and minor wave 2 should now be complete at 0.52 the length of minor wave 1, which is somewhat short of the most common range of 0.66 to 0.81 the prior wave.
Within the zigzag of minor wave 3, minute wave b may not move beyond the start of minute wave a below 14.885.
Ending diagonals in C wave positions are not as common as impulses, so an alternate idea is considered below.
ALTERNATE DAILY CHART
Click chart to enlarge.
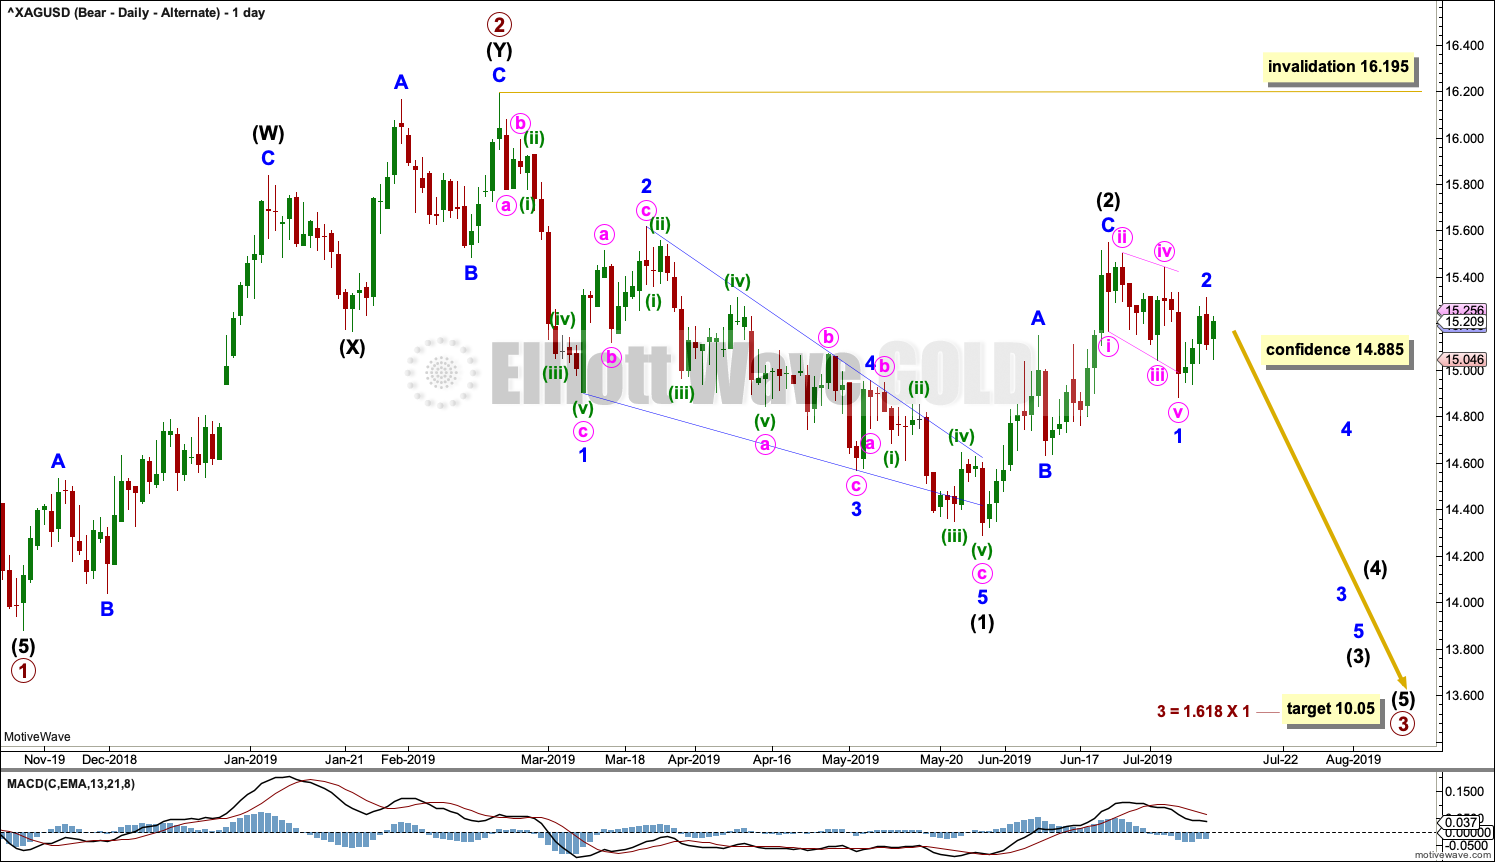
It is still possible that primary wave 2 was over on the 20th of February at 16.195. It will fit as a completed double zigzag.
Primary wave 3 may have begun there. A target for it to end is calculated using the most common Fibonacci ratio to primary wave 1.
Primary wave 3 may only subdivide as an impulse. Within the impulse, intermediate wave (1) may be complete as a leading contracting diagonal and intermediate wave (2) may also now be complete as a zigzag; although if it moves higher as a double zigzag, intermediate wave (2) may not move beyond the start of intermediate wave (1) above 16.195.
Intermediate wave (3) may only subdivide as an impulse. Within the impulse, minor wave 1 may now be complete as a leading contracting diagonal.
A new low now below 14.885 would invalidate the main daily bearish wave count and give some confidence in this alternate.
BULLISH WAVE COUNT
WEEKLY CHART
Click chart to enlarge.
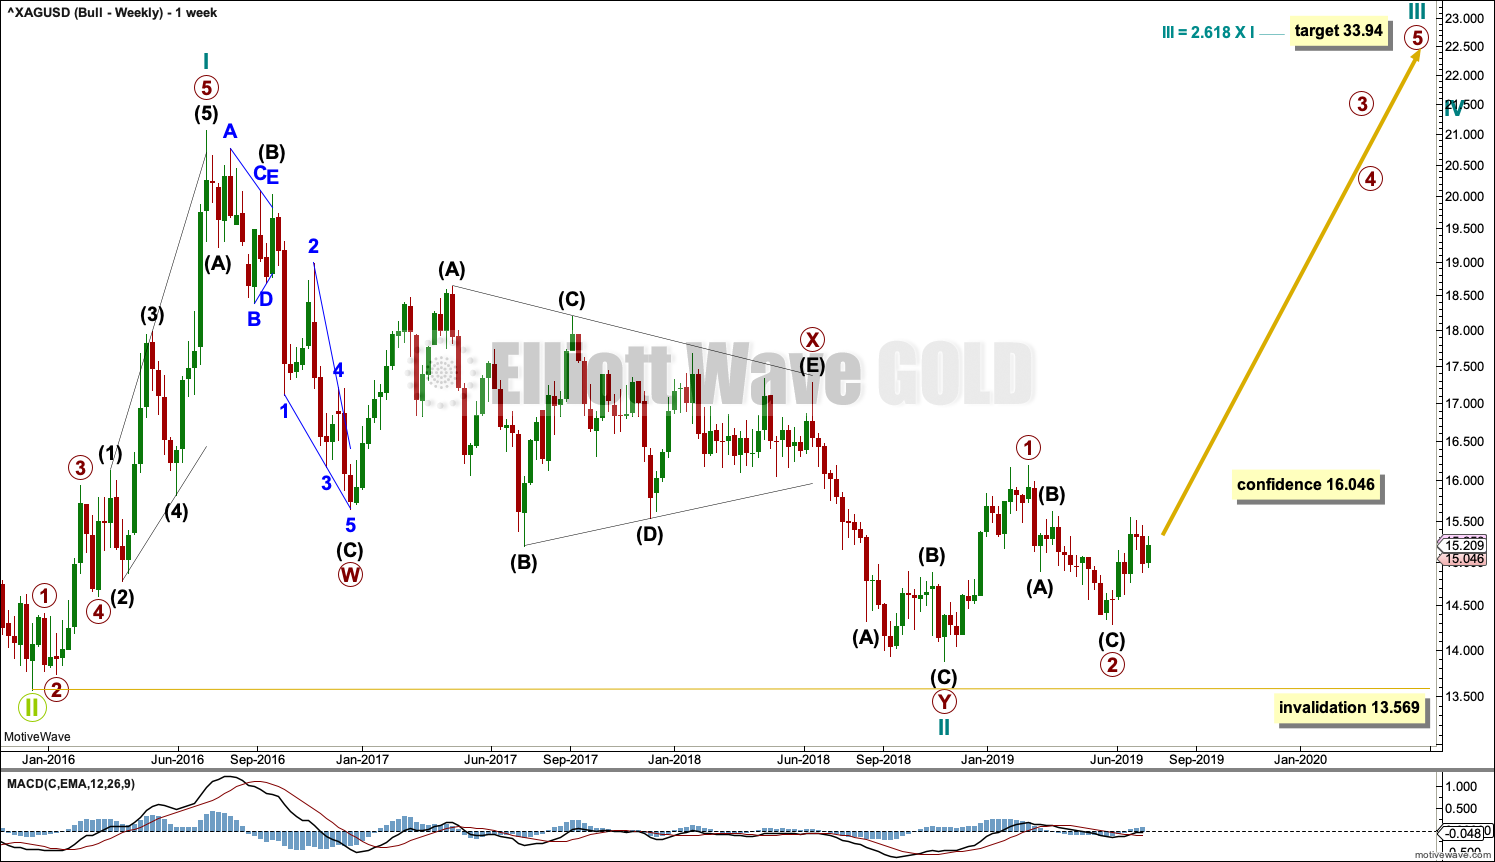
This bullish Elliott wave count sees the three steps back pattern as complete and a new bull market beginning for Silver at the low in December 2015.
A new bull market should begin with a five wave structure upwards. This is labelled cycle wave I.
Following five steps forward should be three steps back. This is labelled cycle wave II. The Elliott wave corrective structure of cycle wave II is labelled as a double zigzag, which is a fairly common structure.
If it continues any further, then cycle wave II may not move beyond the start of cycle wave I below 13.569.
DAILY CHART
Click chart to enlarge.
If cycle wave II is over, then the new trend up for cycle wave III should begin with a five wave structure. This is labelled primary wave 1. The structure may now be complete.
Five steps up should be followed by three steps back, labelled primary wave 2. Primary wave 2 may now be also complete as a double zigzag.
A target is calculated for primary wave 3 that expects to exhibit a common Fibonacci ratio to primary wave 1.
Primary wave 3 may only subdivide as an impulse. Within primary wave 3, intermediate wave (1) may subdivide either as an impulse or a leading diagonal. Overlapping now suggests a diagonal may be considered.
Within leading diagonals, sub-waves 1, 3 and 5 most commonly subdivide as zigzags but may also appear to be impulses. Wave 4 must overlap wave 1 price territory. So far minor wave 1 fits as a zigzag. Minor wave 2 should now be a complete zigzag. Within minor wave 3, no second wave correction nor B wave may move beyond its start below 14.885.
TECHNICAL ANALYSIS
WEEKLY CHART
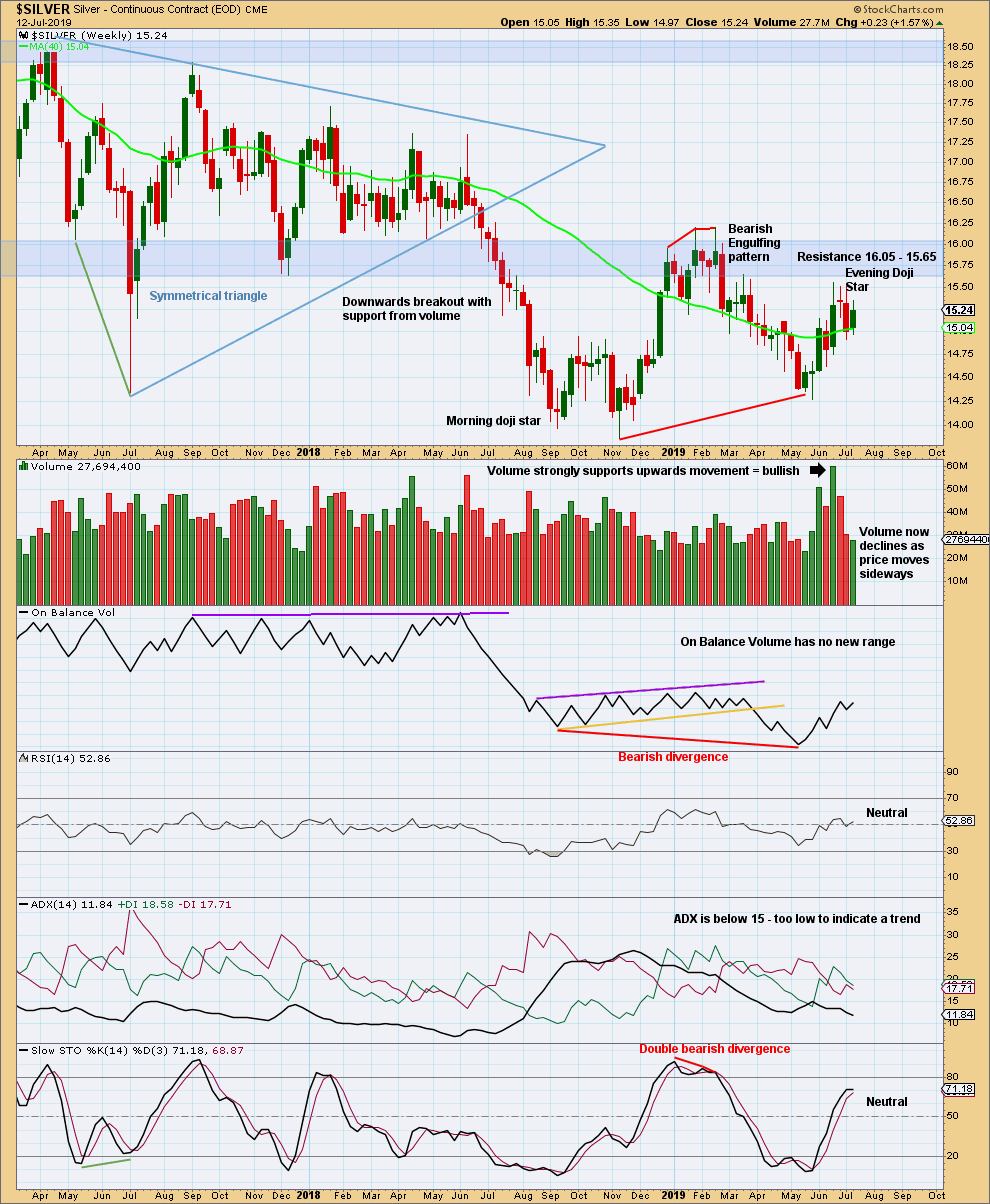
Click chart to enlarge. Chart courtesy of StockCharts.com.
Look for strong resistance in a zone about 15.65 to 16.05.
Resistance is holding at this stage. It looks like it may force a reaction down from here.
The three weekly candlesticks prior to this week complete an Evening Doji Star reversal pattern. This supports the bearish alternate daily wave count.
DAILY CHART
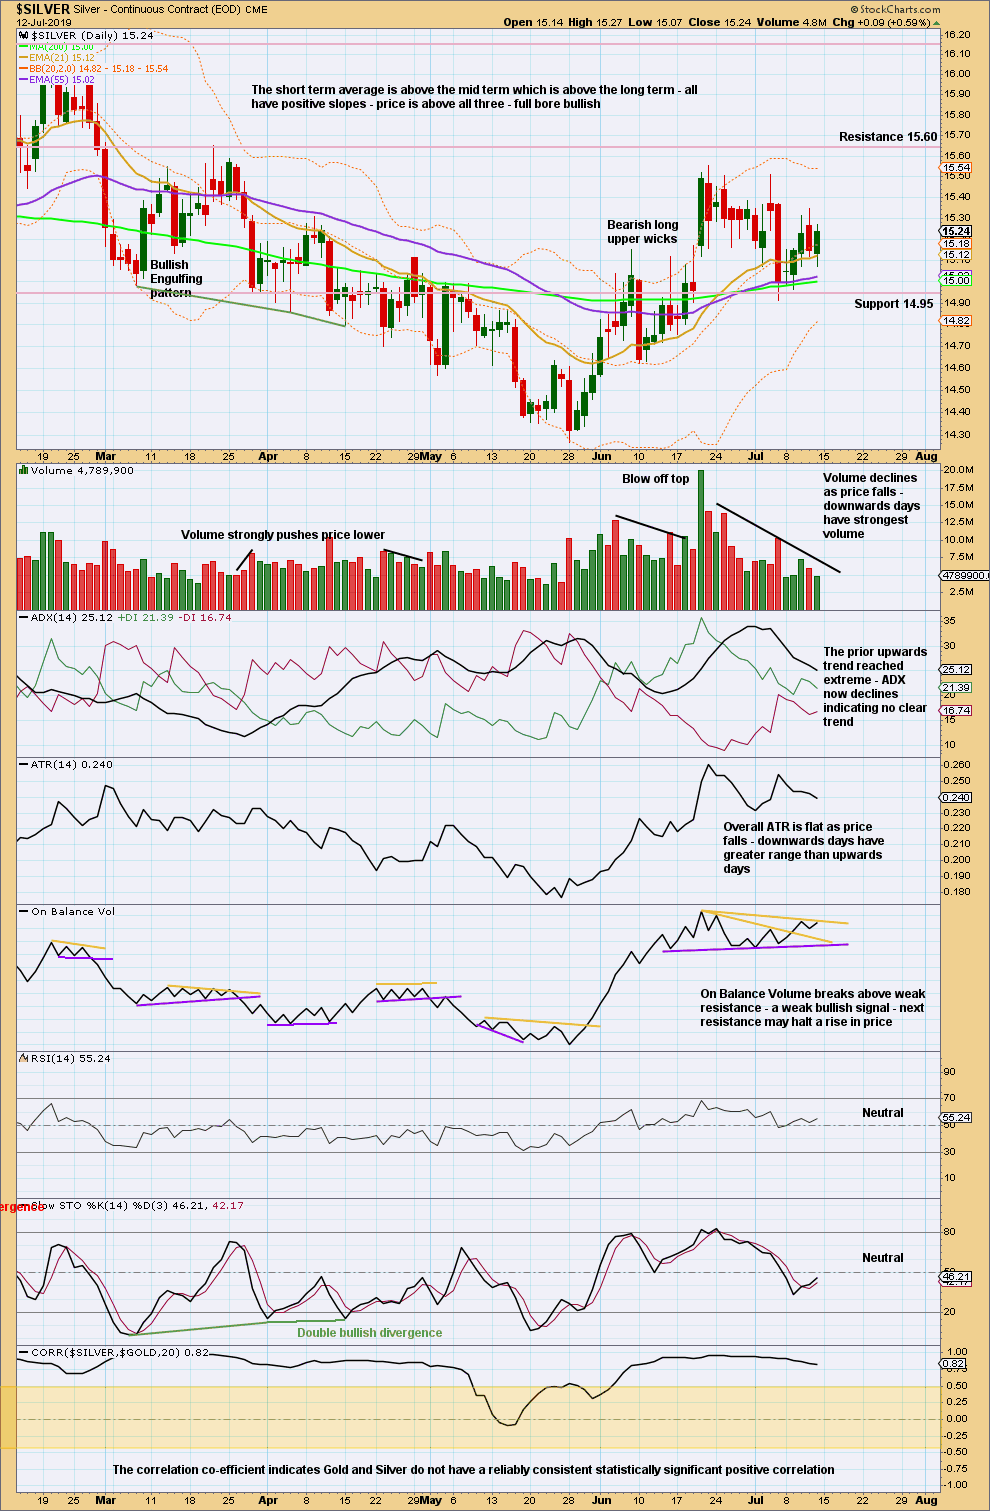
Click chart to enlarge. Chart courtesy of StockCharts.com.
Price is range bound with resistance about 15.10 to 15.50 and support about 14.95. The short-term volume profile and ATR slightly suggest a downwards breakout may be more likely than upwards.
Published @ 11:43 p.m. EST.
—
Careful risk management protects your trading account(s).
Follow my two Golden Rules:
1. Always trade with stops.
2. Risk only 1-5% of equity on any one trade.
—
New updates to this analysis are in bold.
Hi Lara!
Please see attached picture of the current September silver futures contract (matches the same pattern of cash index). I believe Primary wave 1 may now be a completed expanding leading diagonal. I think it explains what’s been happening in silver. The implications are important since we may be starting Primary wave 2.
3 is longer than 1, 5 is longer than 3, and 4 is longer than 2.
The only rule I’m uncertain about is wave 1 being shortest wave – is that relative to only wave 3 and 5, or do you need to compare it to 2 and 4?
Also, I think the structure looks best as a 5-3-5-3-5, but wave 3 might be better counted as a 3.
Let me know your thoughts!
Corey
I suppose it could also be that Primary wave 1 now has a 1-2, 1-2 look, with the first wave three done? This might explain the potential cycle wave 3 target $33.94…the Primary waves getting us there might need to be longer in time to hit that ultimate target.
Either way, I wouldn’t expect corrections to last more than 8-12 day and be shallow in general.
I was fortunate to be extremely long silver in the low 15s…the ride has been nice.
I think I mixed up Intermediate waves with Primary waves. Replace all comments above with Intermediate and now it makes sense. We are done with Intermediate wave 1 within Primary 3. However, with the target at 33+, this might only be a sub-wave 1 of intermediate wave 1!!!
Also, looks like all waves fit as 3-3-3-3-3 now that I revisit it.
Hi Lara!
I love the leading diagonal analysis and is how I’m trading this 3rd wave up in silver.
Question: is there a limit to sub-wave 3 and the steepness of the sub-wave 1-3 upper trend line?
Looks like if sub-wave 4 is to go into sub-wave 1 price territory, then we must be pretty close to making a sub-wave 3 top. I’ve trimmed my position down to half of normal with today’s move.
Thanks!
Corey
For both the first bear daily and the bullish daily charts, a diagonal is expected to be unfolding. So my answer kinda covers both counts.
Diagonals, both leading and ending, are more commonly contracting than expanding. By quite a wide margin. Which means in this case the third wave of minor 3 (it’s the same degree on both counts) would most likely be shorter than minor 1. Minor 3 reaches equality with minor 1 at 16.146 so it’s likely to end prior to that point.
One problem with this expectation however is in my research I have now found one historic example where the structure only fits as a leading diagonal but within it the third wave was by a small margin the longest of 1, 3 and 5. This example was on Bitcoin though, which has huge volatility, and was back in 2011 (I think) when its volume may not have been high enough for a very reliable EW count. There may also however be an example on the monthly chart for Gold, but there it’s not the only way to count the move and there are other ways which meet all EW rules.
So in short, expect minor 3 to be shorter than minor 1 and end prior to 16.146, but that may not be absolute.
When I look at Fibonacci Ratios within minor 3 between minute a and c to calculate a target, nothing works which is higher than where it is now and prior to 16.145. So sorry, can’t calculate a target. Minute c may not exhibit a Fibonacci ratio to minute a.
After the move above 16.146 I’m assuming this can be an expanding diagonal?
I’ve tried to research this, but I think I’m left more confused!
Corey
I’m not clear on what the initial target for the bullish scenario is.
Primary wave 3 target is $18.04, however intermediate wave 1 might be more like mid 16s. Look out though as silver could test back down to the 15.55 area
Most likely not going to be a straight ride up with all the resistance in the 16-17 ranges.
Primary wave 3 or 5 could extend to hit the ultimate target of $33.94 for cycle wave 3.
Good luck!