
Upwards movement continued above 16.195. A target was at 16.600. Upwards movement for the week reached 16.541.
Summary: At this stage, some pullback to relive extreme conditions looks likely to have begun on Friday. How low this goes will indicate which wave count, bull or bear, would be most likely. The target for a pullback on the bullish count is about 15.149.
A new low below 14.288 would indicate the bearish wave count would be most likely. At that stage, a mid-term target would be at 10.39.
If price makes a new high by any amount at any time frame above 17.680, then only the very bullish Elliott wave count would remain. The target would then be at 33.94.
Monthly charts were reviewed here.
ELLIOTT WAVE COUNTS
BEARISH WAVE COUNT
WEEKLY CHART
Click chart to enlarge.
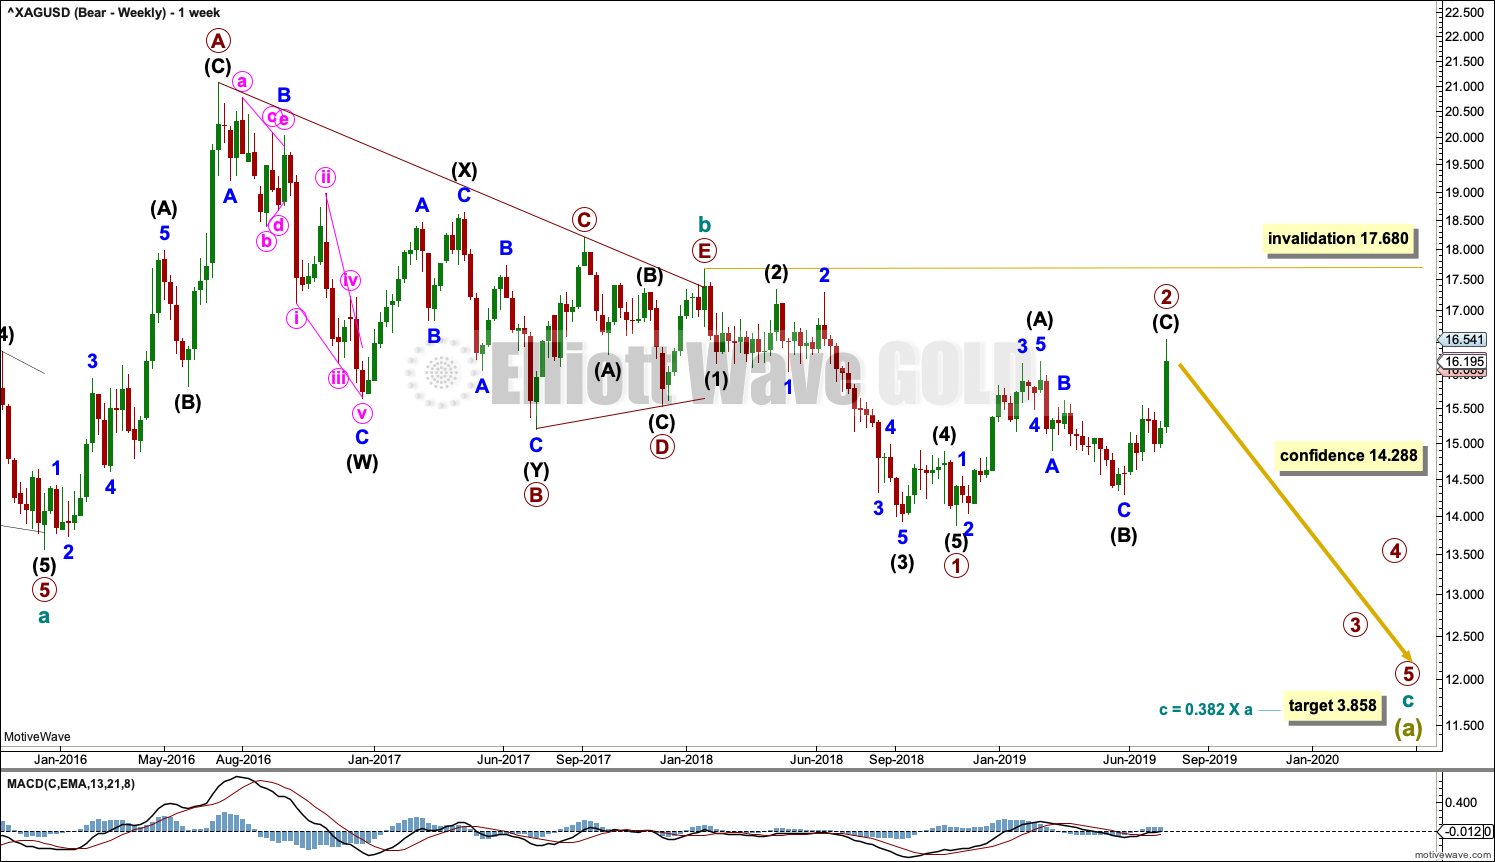
The basic Elliott wave structure is five steps forward followed by three steps back. At this time, it is expected that Silver is within a very large three steps back pattern that began at the all time high in April 2011.
Three steps back are almost always labelled in Elliott wave as A-B-C. This Elliott wave count expects that wave A is incomplete, and this is labelled Super Cycle wave (a).
The Elliott wave structure for Super Cycle wave (a) may be a zigzag. Zigzags subdivide 5-3-5. Within this zigzag, cycle waves a and b may be complete. Cycle wave c must subdivide as a five wave Elliott wave structure, most likely an impulse.
Within the impulse of cycle wave c, if primary wave 2 continues higher as a double zigzag, it may not move beyond the start of primary wave 1 above 17.680.
Within the zigzag of Super Cycle wave (a), it would be extremely likely for cycle wave c to move below the end of cycle wave a at 13.569 to avoid a truncation. The target would see this achieved.
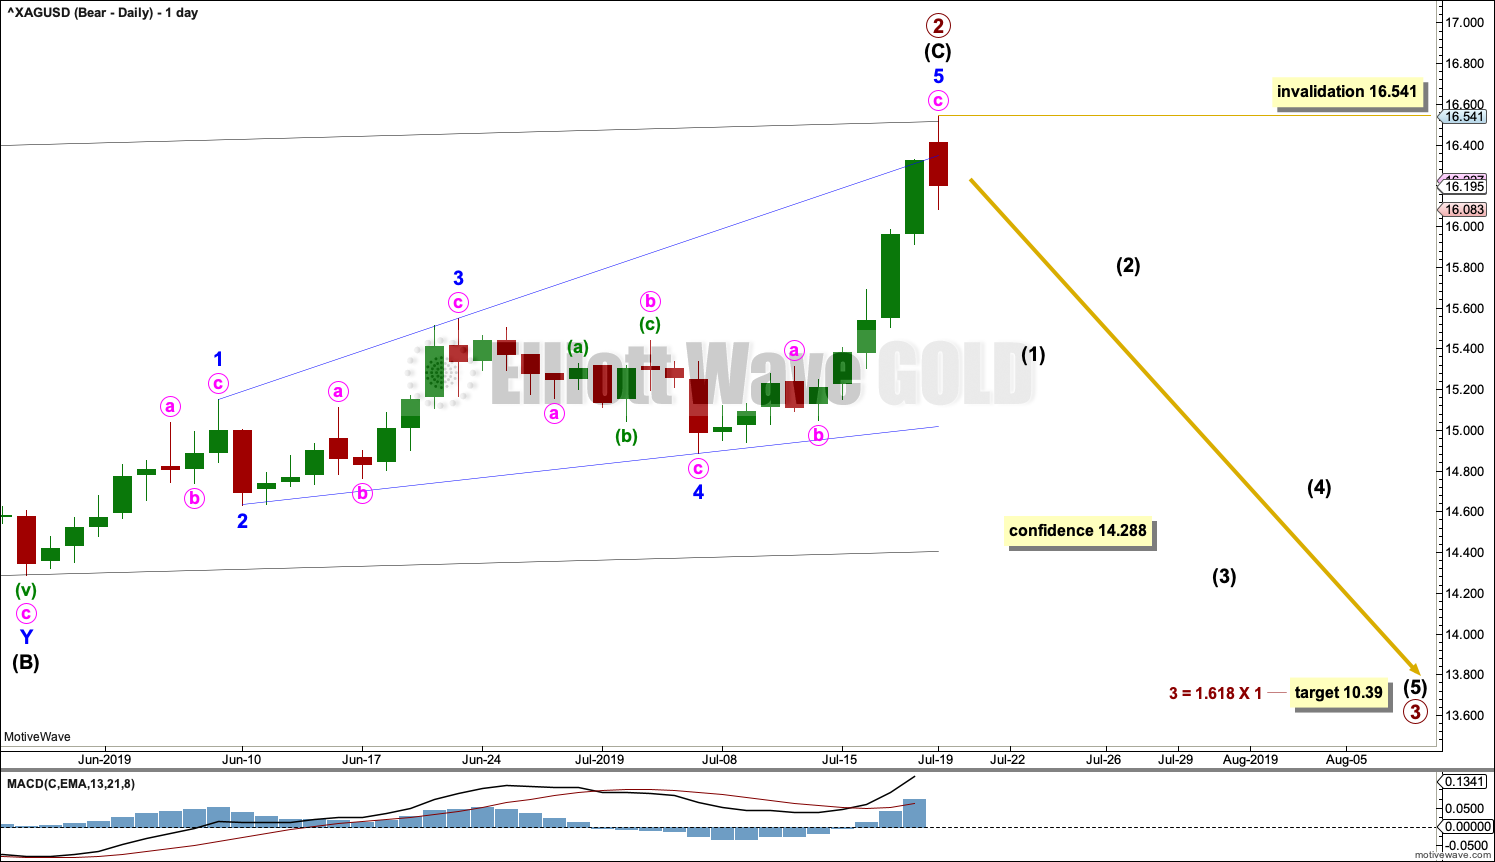
The daily chart below focusses on intermediate wave (C) within primary wave 2.
DAILY CHART
Click chart to enlarge.
Primary wave 2 may be a complete zigzag.
Zigzags subdivide 5-3-5. Within the zigzag, intermediate wave (C) is seen as a complete ending expanding diagonal.
Within ending diagonals, all sub-waves must subdivide as zigzags and fourth waves must overlap first wave price territory. Within expanding diagonals, the third wave should be longer than the first, the fifth wave should be longer than the third, the fourth wave should be longer than the second, and the trend lines should diverge.
This wave count meets all rules for ending expanding diagonals. This structure has the right look.
A target is now calculated for primary wave 3 to reach a common Fibonacci ratio to primary wave 1. Primary wave 3 may only subdivide as an impulse. Within the impulse, intermediate wave (2) may not move beyond the start of intermediate wave (1) above 16.541.
BULLISH WAVE COUNT
WEEKLY CHART
Click chart to enlarge.
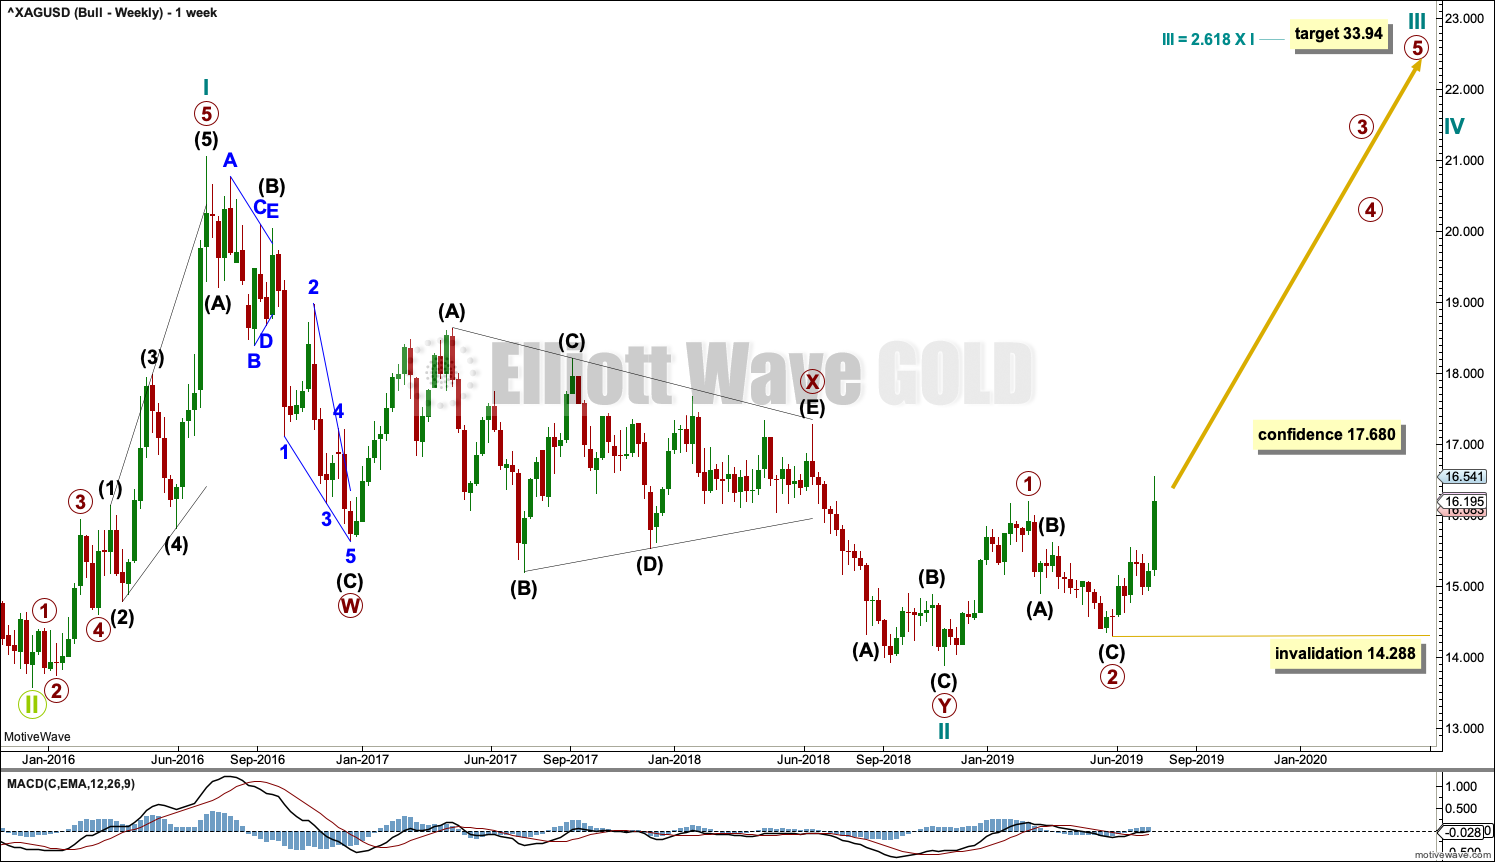
This bullish Elliott wave count sees the three steps back pattern as complete and a new bull market beginning for Silver at the low in December 2015.
A new bull market should begin with a five wave structure upwards. This is labelled cycle wave I.
Following five steps forward should be three steps back. This is labelled cycle wave II. The Elliott wave corrective structure of cycle wave II is labelled as a double zigzag, which is a fairly common structure.
Cycle wave III may only subdivide as an impulse. Within the impulse, primary waves 1 and 2 may now be complete.
Primary wave 3 may only subdivide as an impulse. Within the impulse, no second wave correction may move beyond its start below 14.288.
DAILY CHART
Click chart to enlarge.
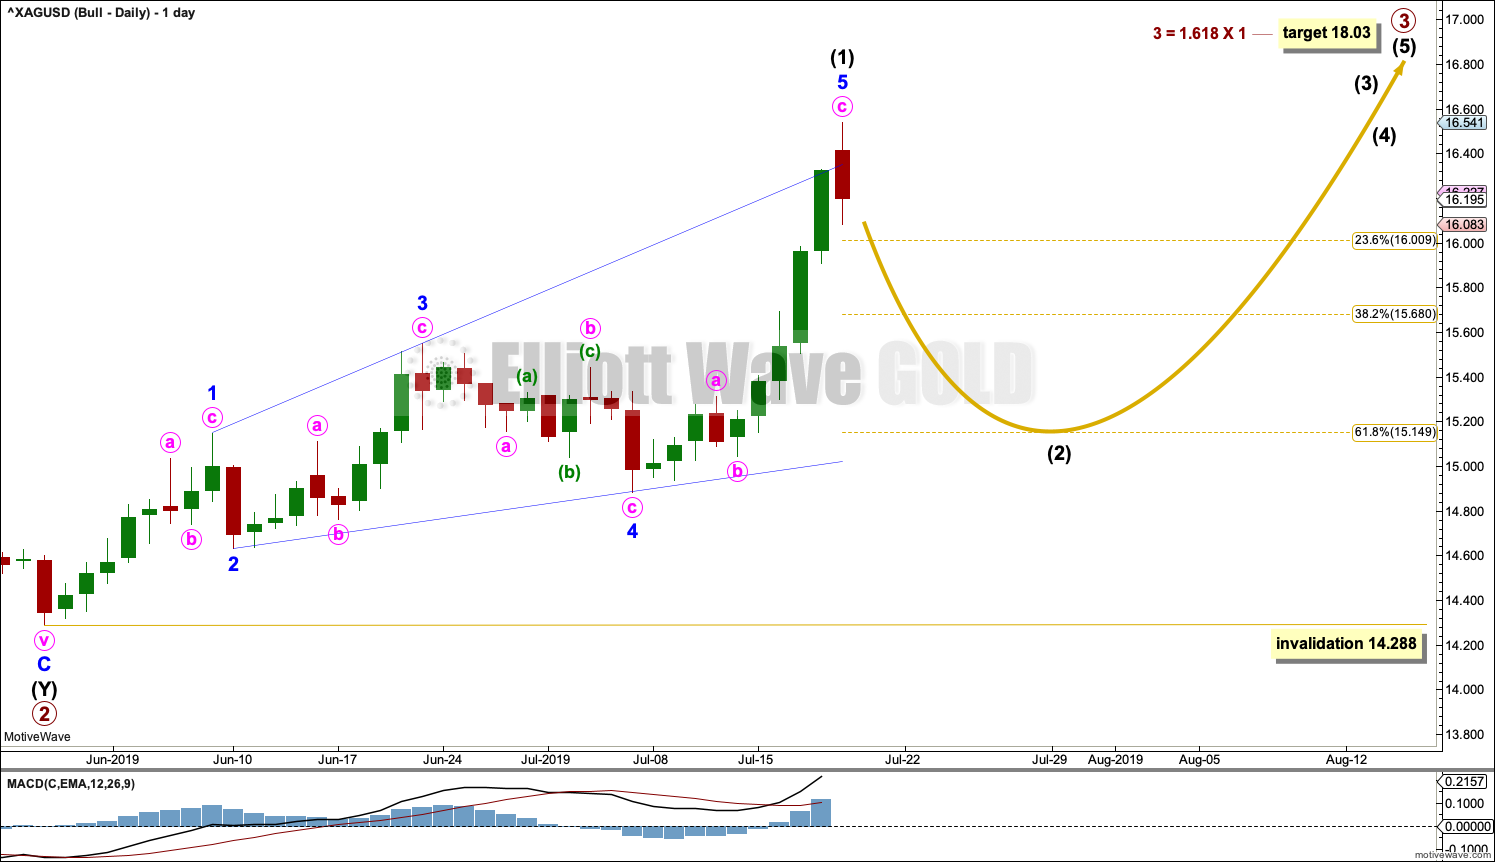
Primary wave 3 may only subdivide as an impulse. Within the impulse, intermediate wave (1) may now be complete as a leading expanding diagonal.
Within leading diagonals, sub-waves two and four must subdivide as zigzags. Sub-waves one, three and five are most commonly zigzags but may sometimes appear as impulses. In this example, they all fit best as zigzags. Within a leading diagonal, wave four must overlap wave one price territory.
Within expanding diagonals, the third wave should be longer than the first, the fifth wave should be longer than the third, the fourth wave should be longer than the second, and the trend lines should diverge.
This structure meets all Elliott wave rules for a leading expanding diagonal. It has the right look.
Second wave corrections following leading diagonals in first wave positions are normally very deep. Here, intermediate wave (2) may be expected to be at least 0.618 the depth of intermediate wave (1), but it could be deeper than that.
Intermediate wave (2) may not move beyond the start of intermediate wave (1) below 14.288.
TECHNICAL ANALYSIS
WEEKLY CHART
Click chart to enlarge. Chart courtesy of StockCharts.com.
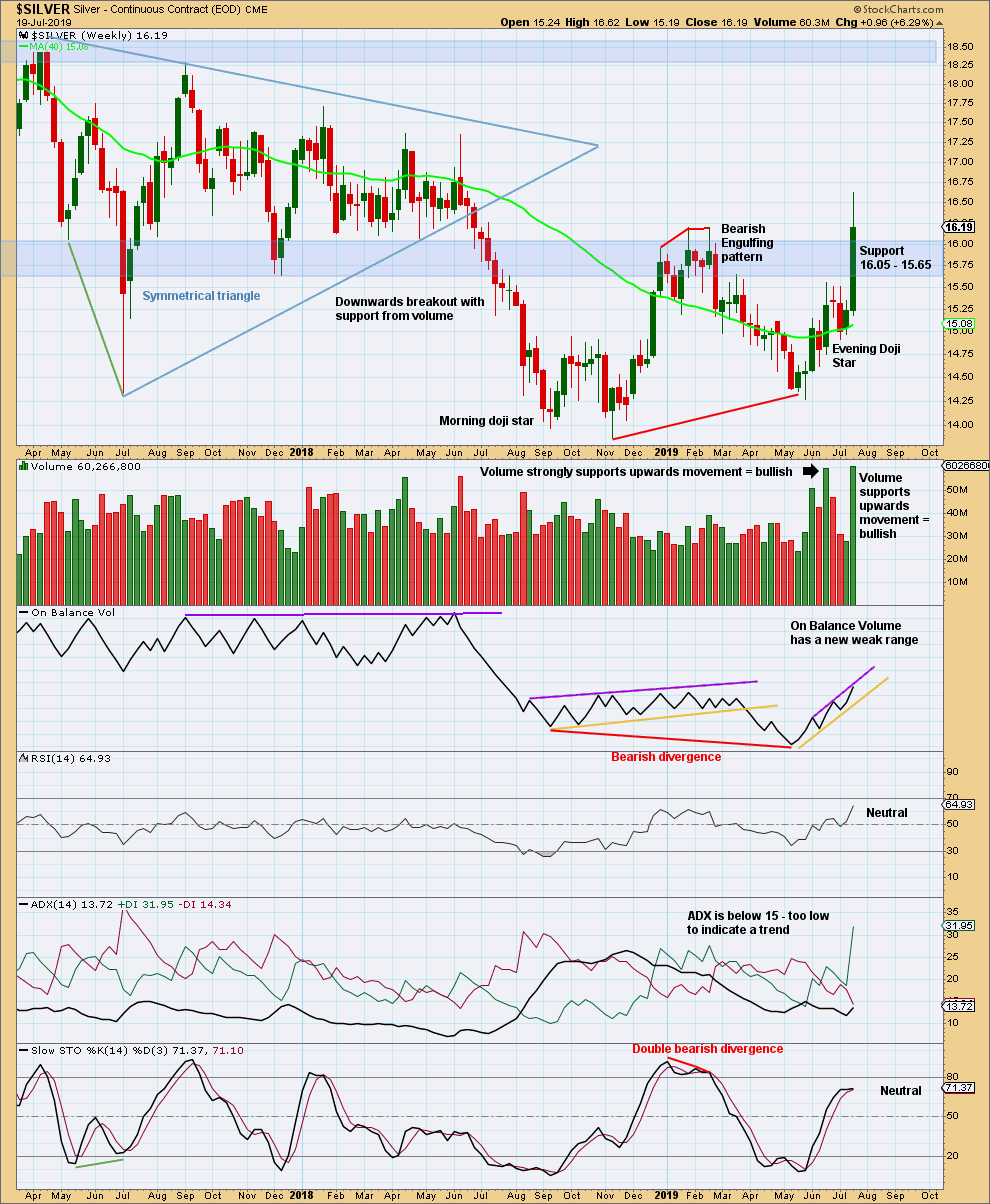
Resistance at 16.05 has been overcome by a strong upwards week, which has support from volume. The long upper wick this week suggests a back test of support now in the zone 16.05 to 15.65 may begin.
DAILY CHART
Click chart to enlarge. Chart courtesy of StockCharts.com.
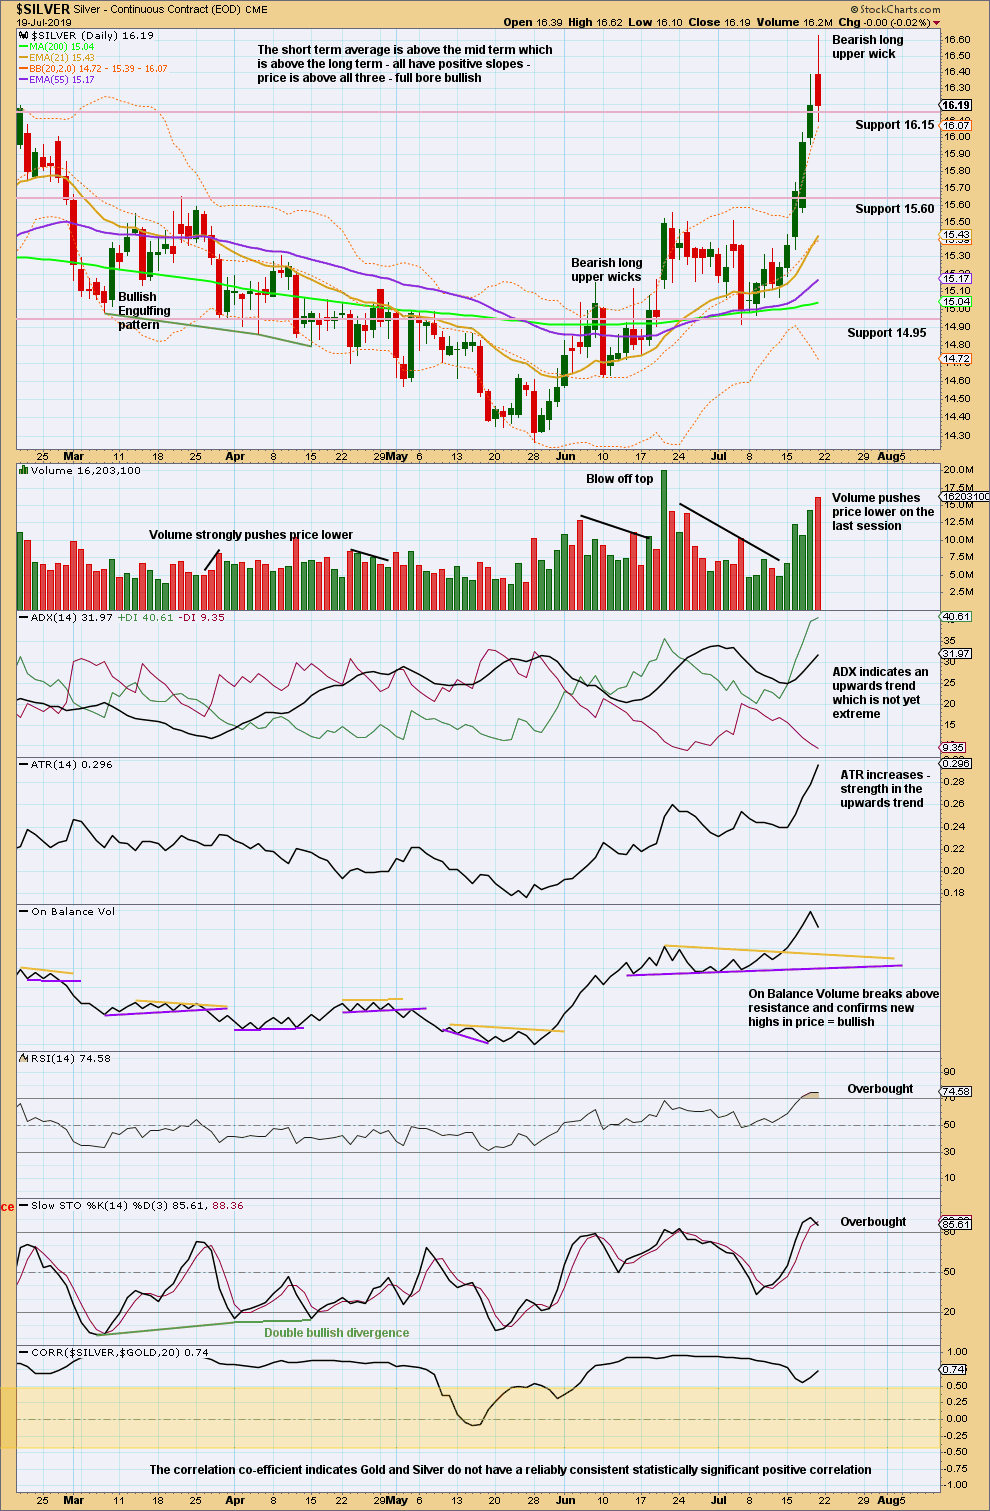
While Friday’s candlestick is bearish, it is not a Bearish Reversal pattern because price has not closed back within the real body of Thursday’s candlestick. However, the long upper wick with volume actively pushing price lower on Friday while RSI has reached overbought suggests some pullback or consolidation may continue next week.
Possible areas of support for a pullback or consolidation are identified on both daily and weekly charts.
Published @ 10:42 p.m. EST.
—
Careful risk management protects your trading account(s).
Follow my two Golden Rules:
1. Always trade with stops.
2. Risk only 1-5% of equity on any one trade.
—
New updates to this analysis are in bold.
I think there’s likely a count that has more up to go before turning big time bearish that aligns with the alternate Weekly for gold. If that gold count shows itself to be “the one”, then I’m sure Lara will have a silver count that matches.
For the bear count, primary wave 2 could still continue higher as a double zigzag.
It would need some downwards or sideways movement first to complete an X wave, but after that it could move higher.
That’s why I’m leaving the invalidation point on the weekly chart for the bear count up at the start of primary wave 1. Until primary wave 3 has moved below the end of primary wave 1, meeting that core Elliott wave rule, I prefer to leave open the possibility that primary wave 2 may not be over.
Thank you, Lara
Always appreciate the silver updates – people are watching, even if it attracts less comments.
You’re welcome. 😊
When it attracts a lot of comments it will be time to sell all.