
Some pullback to relieve extreme conditions was expected to continue for the week. This is exactly what has happened.
Summary: At this stage, some pullback to relieve extreme conditions looks likely to continue. How low this goes will indicate which wave count, bull or bear, would be most likely. The target for a pullback on the bullish count is about 15.149.
A new low below 14.288 would indicate the bearish wave count would be most likely. At that stage, a mid-term target would be at 10.39.
If price makes a new high by any amount at any time frame above 17.680, then only the very bullish Elliott wave count would remain. The target would then be at 33.94.
Monthly charts were last updated here.
ELLIOTT WAVE COUNTS
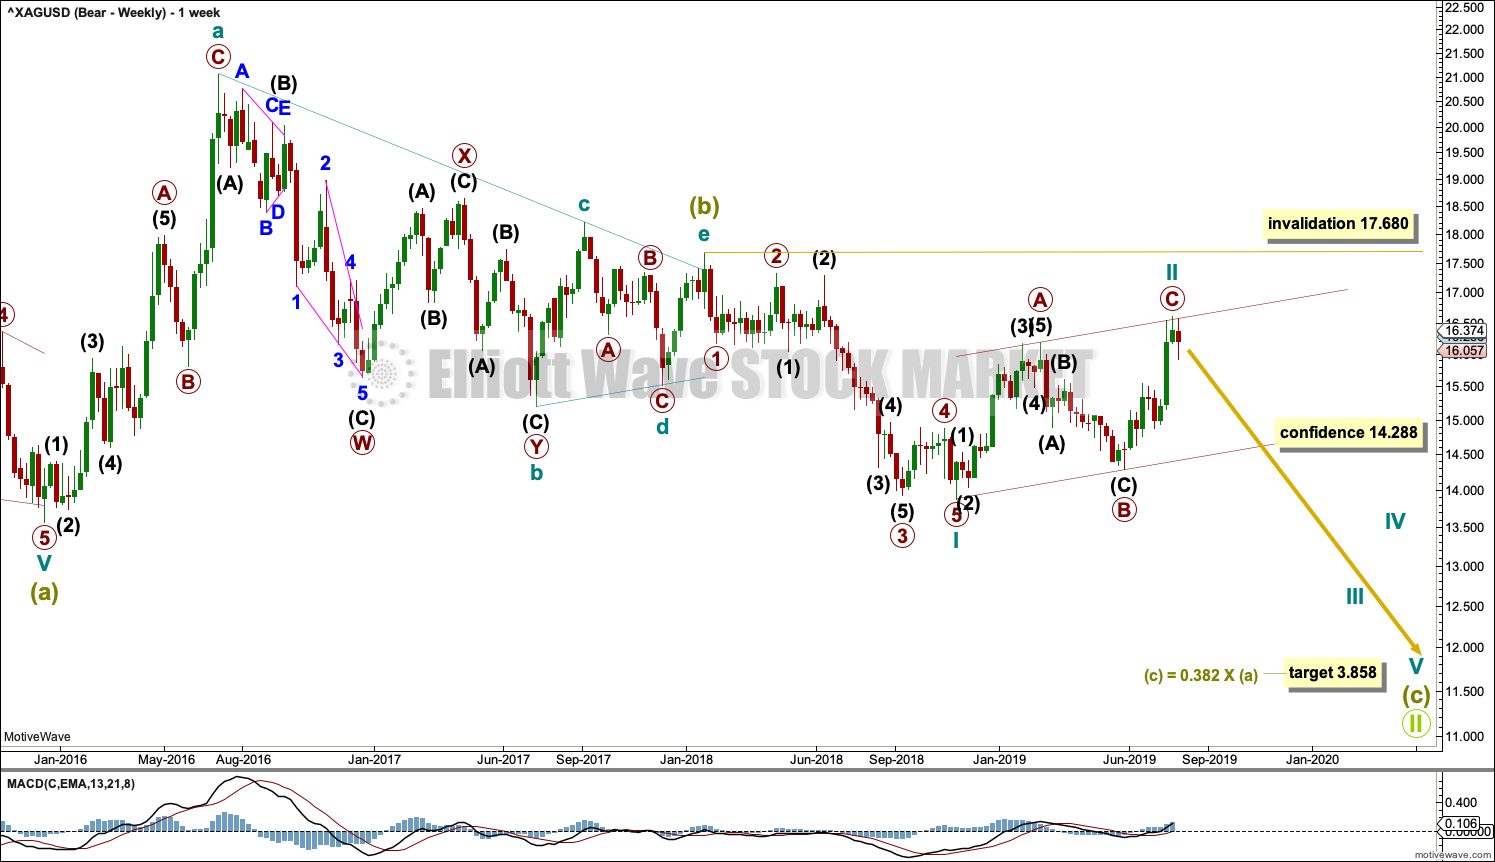
BEARISH WAVE COUNT
WEEKLY CHART
Click chart to enlarge.
The basic Elliott wave structure is five steps forward followed by three steps back. At this time, it is expected that Silver is within a very large three steps back pattern that began at the all time high in April 2011.
Three steps back are almost always labelled in Elliott wave as A-B-C. This Elliott wave count labels waves A and B complete as Super Cycle wave (a) and a triangle for Super Cycle wave (b).
The Elliott wave structure for Grand Super Cycle wave II may be a zigzag. Zigzags subdivide 5-3-5. Within this zigzag, Super Cycle waves (a) and (b) may be complete. Super Cycle wave (c) must subdivide as a five wave Elliott wave structure, most likely an impulse.
Within the impulse of Super Cycle wave (c), if cycle wave II continues higher as a double zigzag, it may not move beyond the start of cycle wave I above 17.680.
Within the zigzag of Grand Super Cycle wave II, it would be extremely likely for Super Cycle wave (c) to move below the end of cycle wave a at 13.569 to avoid a truncation. The target would see this achieved.
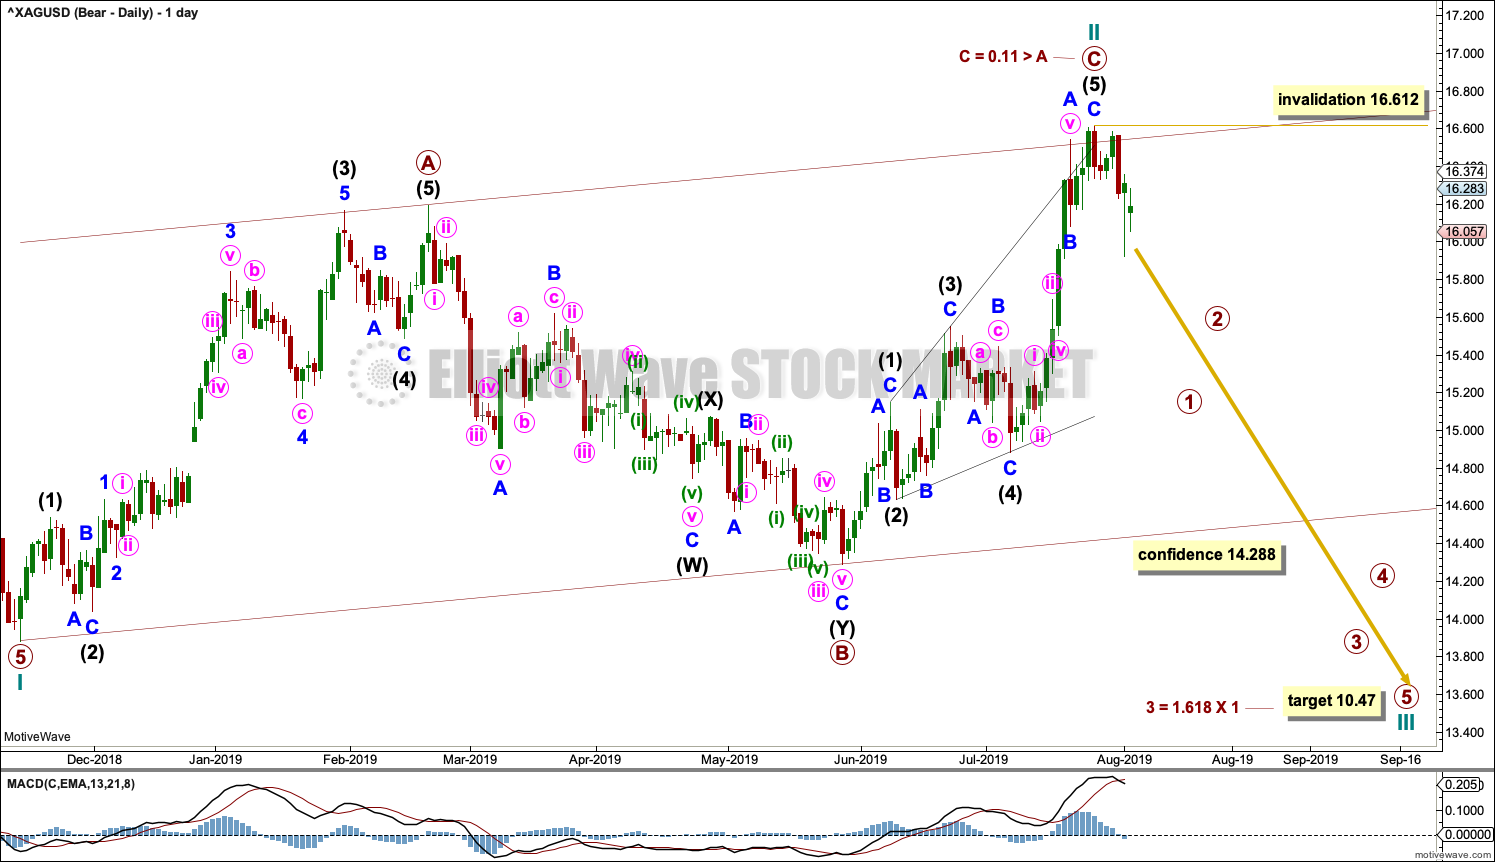
The daily chart below focusses on cycle wave II.
DAILY CHART
Click chart to enlarge.
Cycle wave II may be a complete zigzag.
Zigzags subdivide 5-3-5. Within the zigzag, primary wave C is seen as a complete ending expanding diagonal.
Within ending diagonals, all sub-waves must subdivide as zigzags and fourth waves must overlap first wave price territory. Within expanding diagonals, the third wave should be longer than the first, the fifth wave should be longer than the third, the fourth wave should be longer than the second, and the trend lines should diverge.
This wave count meets all rules for ending expanding diagonals. This structure has the right look.
A target is calculated for cycle wave III to reach a common Fibonacci ratio to cycle wave I.
Within cycle wave III, no second wave correction may move beyond the start of its first wave above 16.612.
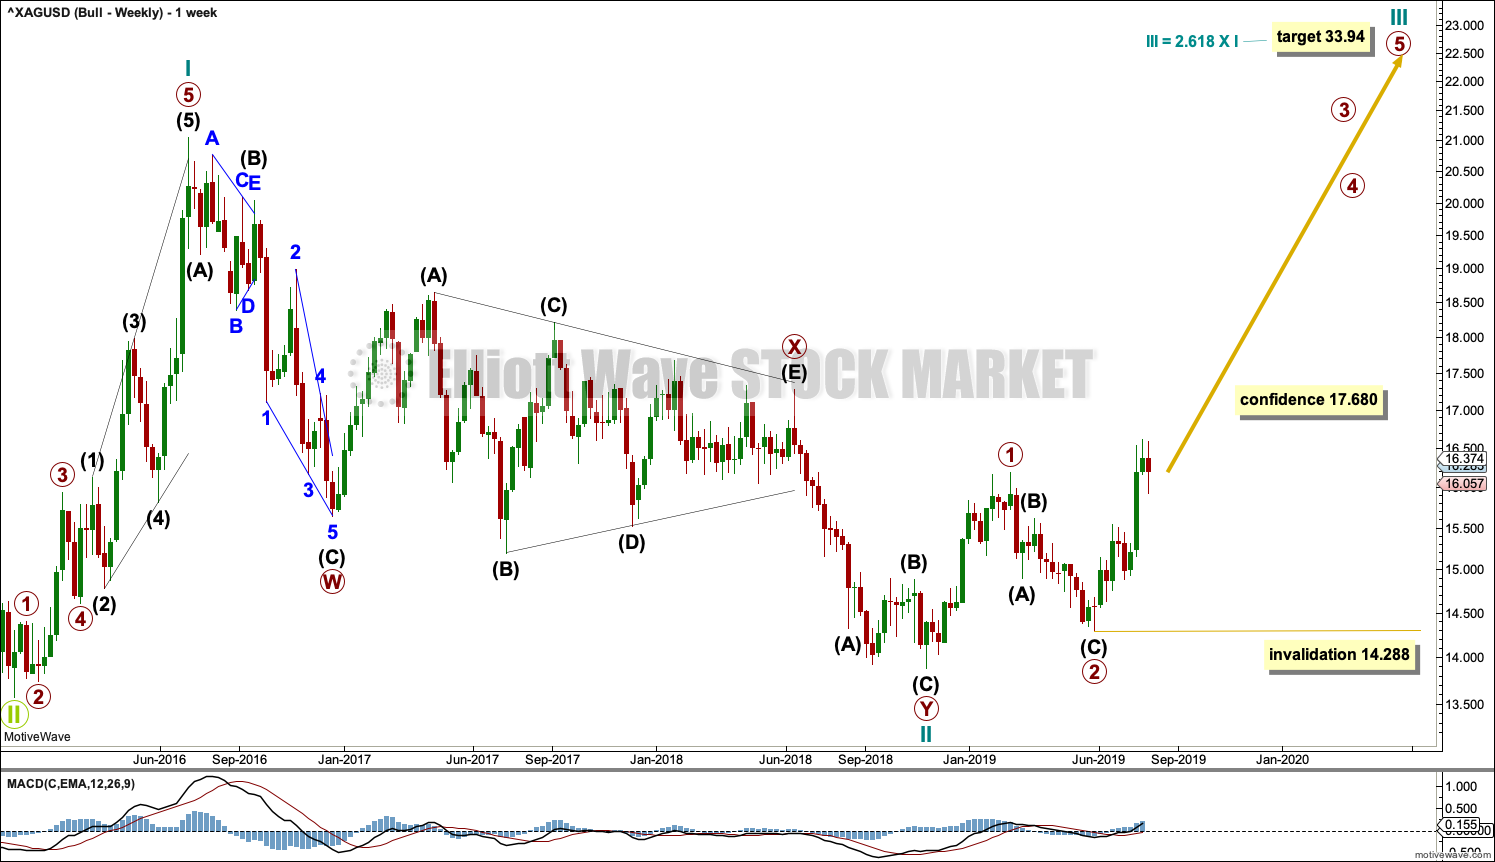
BULLISH WAVE COUNT
WEEKLY CHART
Click chart to enlarge.
This bullish Elliott wave count sees the three steps back pattern as complete and a new bull market beginning for Silver at the low in December 2015.
A new bull market should begin with a five wave structure upwards. This is labelled cycle wave I.
Following five steps forward should be three steps back. This is labelled cycle wave II. The Elliott wave corrective structure of cycle wave II is labelled as a double zigzag, which is a fairly common structure.
Cycle wave III may only subdivide as an impulse. Within the impulse, primary waves 1 and 2 may now be complete.
Primary wave 3 may only subdivide as an impulse. Within the impulse, no second wave correction may move beyond its start below 14.288.
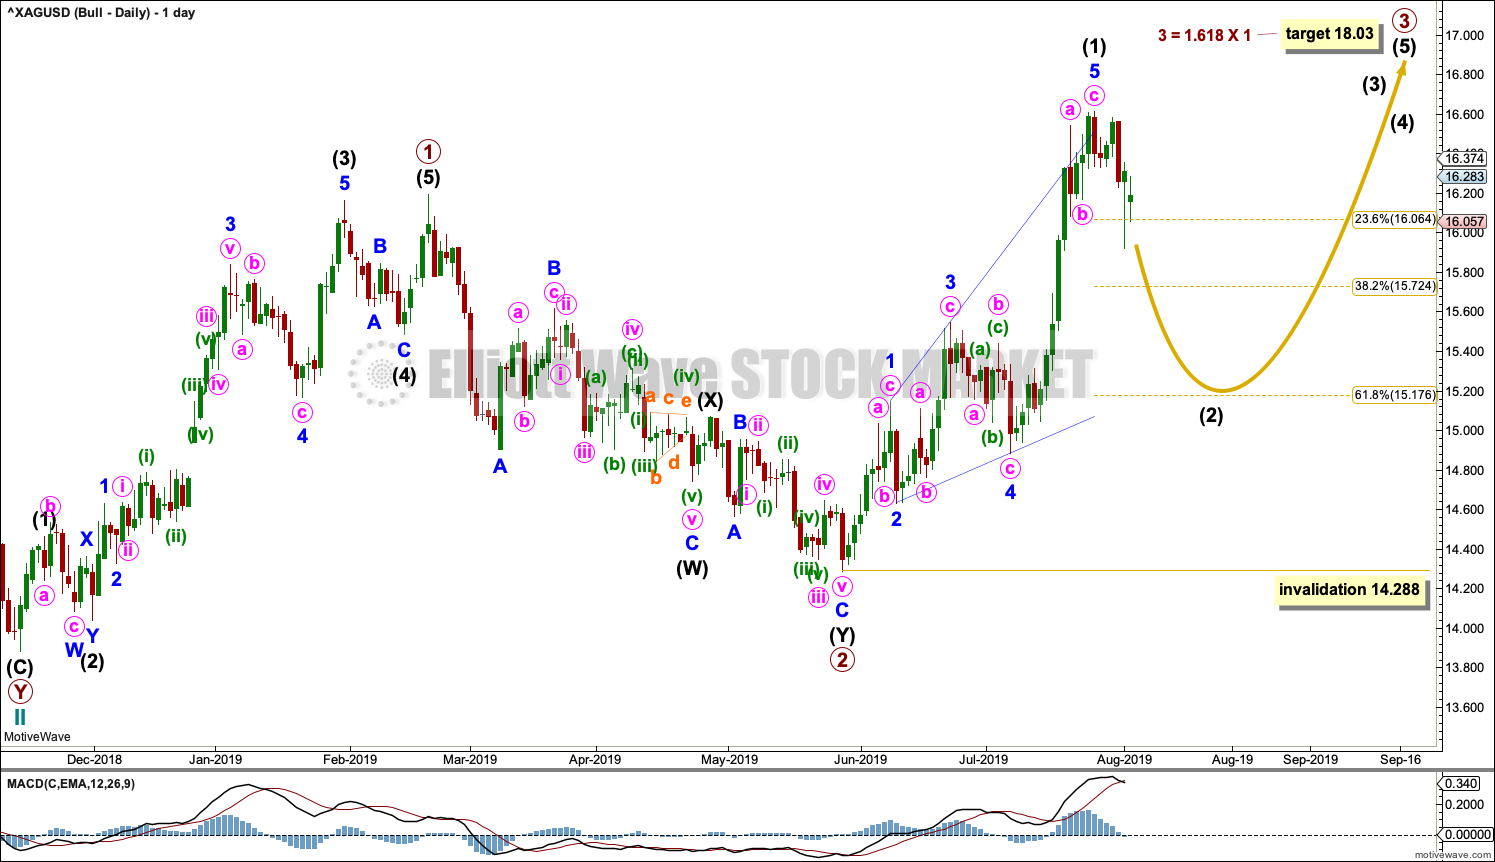
DAILY CHART
Click chart to enlarge.
Primary wave 3 may only subdivide as an impulse. Within the impulse, intermediate wave (1) may be complete as a leading expanding diagonal.
Within leading diagonals, sub-waves two and four must subdivide as zigzags. Sub-waves one, three and five are most commonly zigzags but may sometimes appear as impulses. In this example, they all fit best as zigzags. Within a leading diagonal, wave four must overlap wave one price territory.
Within expanding diagonals, the third wave should be longer than the first, the fifth wave should be longer than the third, the fourth wave should be longer than the second, and the trend lines should diverge.
This structure meets all Elliott wave rules for a leading expanding diagonal. It has the right look.
Second wave corrections following leading diagonals in first wave positions are normally very deep. Here, intermediate wave (2) may be expected to be at least 0.618 the depth of intermediate wave (1), but it could be deeper than that.
Intermediate wave (2) may not move beyond the start of intermediate wave (1) below 14.288.
TECHNICAL ANALYSIS
WEEKLY CHART
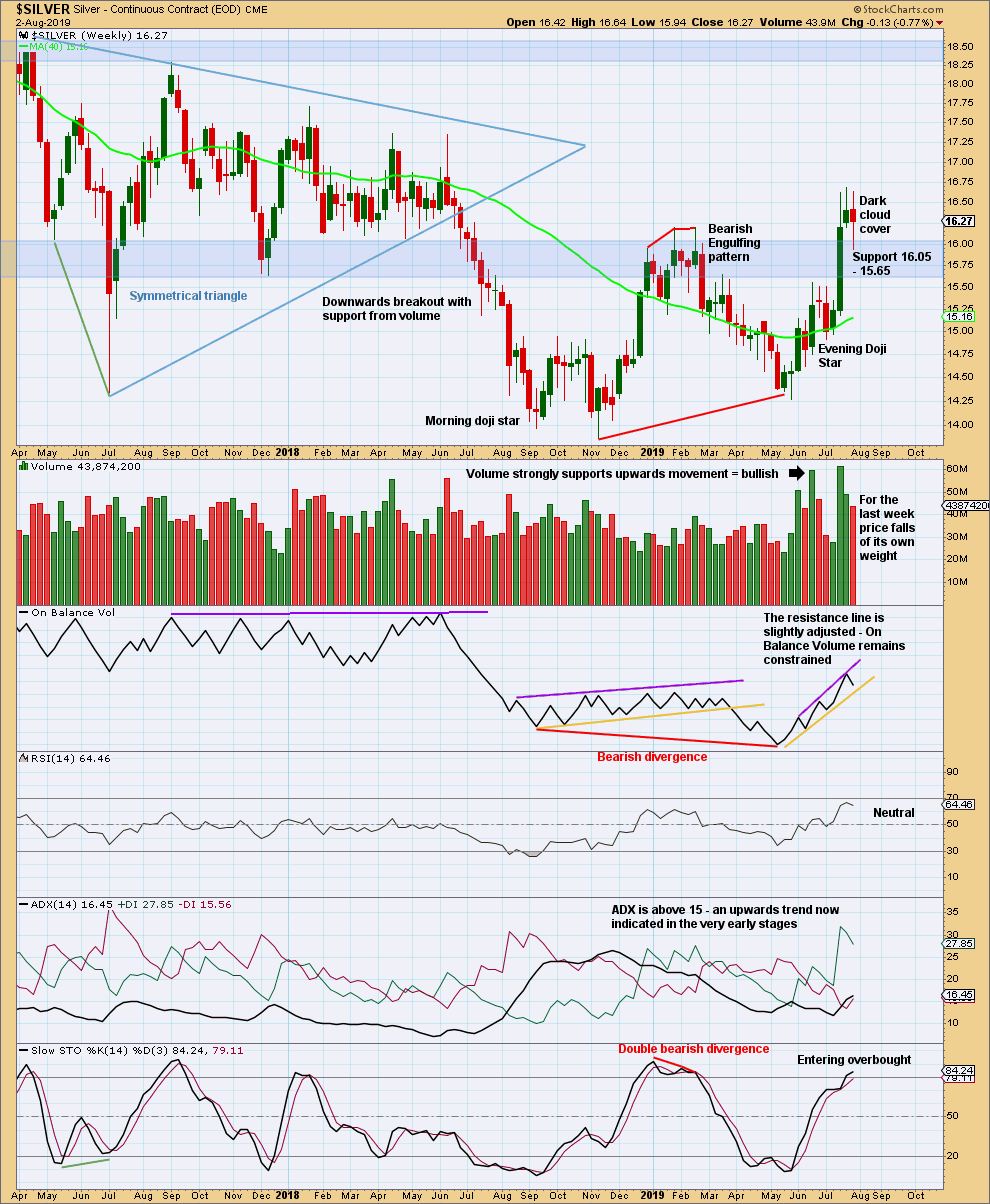
Click chart to enlarge. Chart courtesy of StockCharts.com.
There is an upwards trend. The break above resistance is highly technically significant.
This week completes a bearish candlestick reversal pattern, a Dark Cloud Cover. However, the long upper and lower wicks of this weekly candlestick give the week a neutral look. The bearish reversal pattern may be indicating a trend change to a sideways consolidation and not a full 180 degree reversal to downwards.
Look for strong support for the consolidation in the shaded blue zone.
DAILY CHART
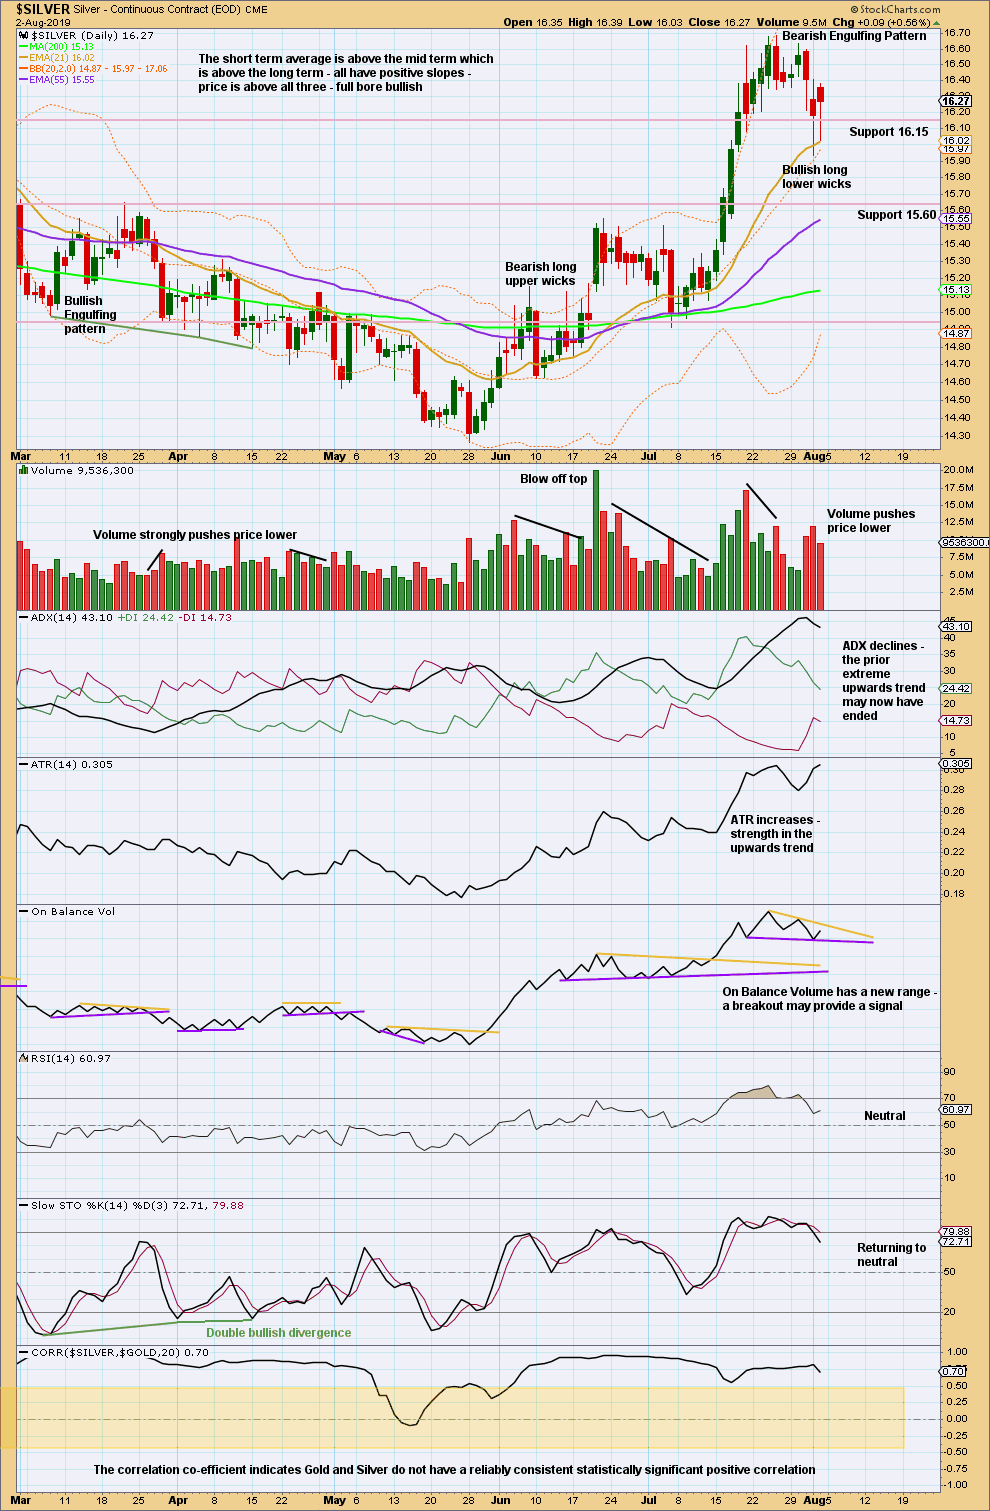
Click chart to enlarge. Chart courtesy of StockCharts.com.
The prior upwards trend reached extreme and conditions were overbought. A pullback has begun.
Published @ 10:15 p.m. EST.
—
Careful risk management protects your trading account(s).
Follow my two Golden Rules:
1. Always trade with stops.
2. Risk only 1-5% of equity on any one trade.
—
New updates to this analysis are in bold.
Thanks for the update Lara.
Updated bearish daily chart:
Cycle wave II may be continuing higher. The invalidation point at the weekly chart is the final invalidation point for a bearish wave count for Silver for now.
The big ? at the high is because currently there is clearly an upwards trend in place and no evidence yet of it being over.
Updated bullish chart:
The leading diagonal is discarded in favour of an impulse unfolding higher. The invalidation point is moved higher.
While price remains within the best fit channel assume the upwards trend remains.
This is an extremely helpful update. I thought with high confidence the expanding diagonal was correct, and now the impulse takes over! If a 4th wave correction meanders back to the 16.65 breakout spot and holds, then I think a high confidence trade can be to go long for a big move up. If it doesn’t hold, then watch out down!