
Last week both Elliott wave counts expected more upwards movement, which is what has happened.
Summary: The next Elliott wave target is at 18.03. A classic analysis target calculated from the pennant pattern is at 18.70.
Monthly charts were last updated here.
ELLIOTT WAVE COUNTS
BEARISH WAVE COUNTS
MAIN WEEKLY CHART
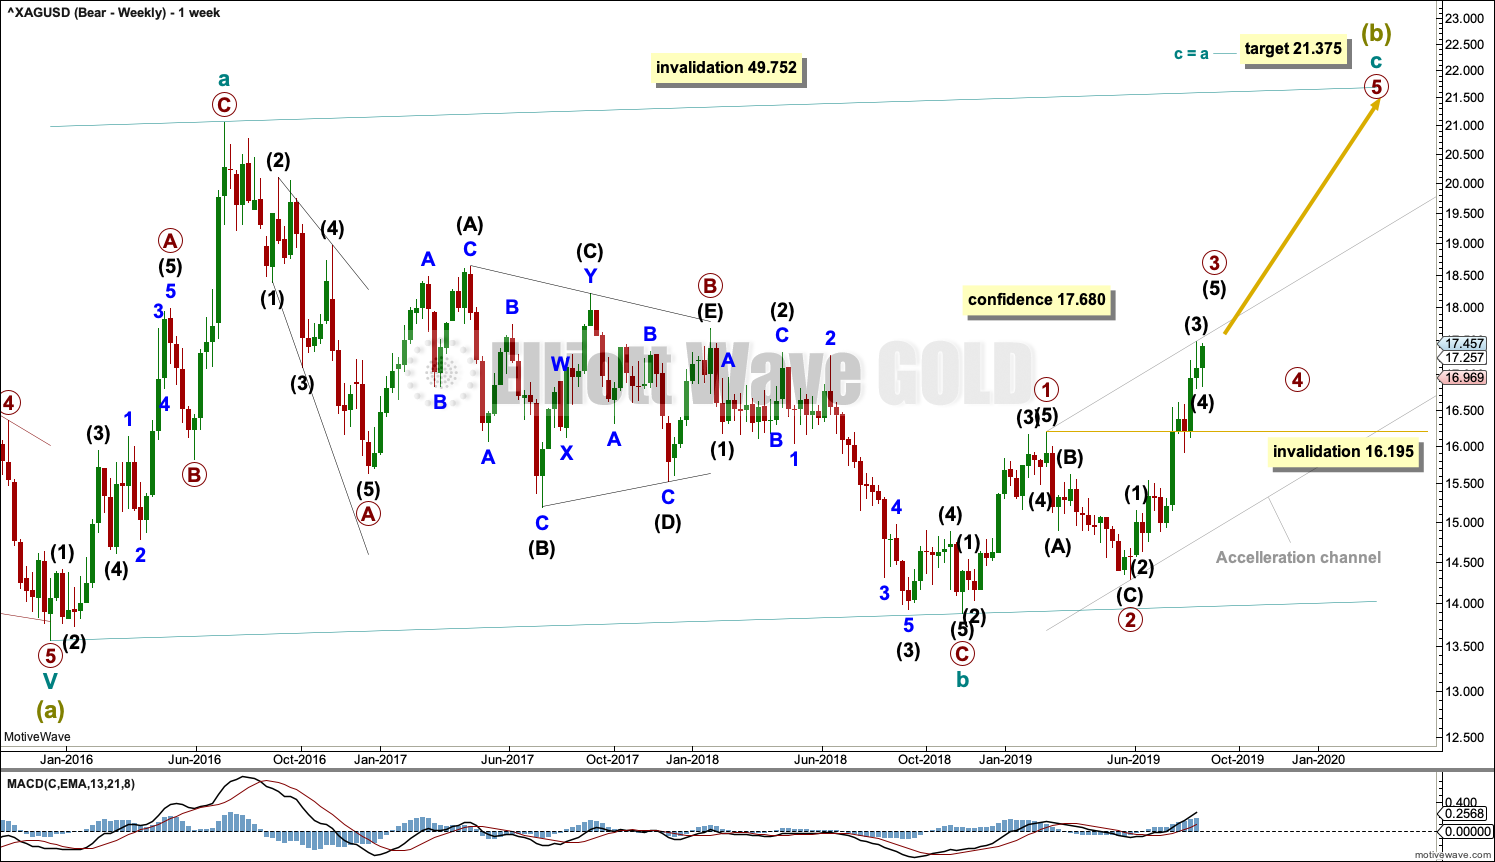
Click chart to enlarge.
This wave count is new this week.
It is possible that Super Cycle wave (b) is an incomplete regular flat correction.
Within the regular flat correction, cycle wave a subdivides well as a zigzag and cycle wave b subdivides well as a zigzag, which is a 0.96 correction of cycle wave a.
Cycle wave c must complete as a five wave structure. Within cycle wave c, primary waves 1 and 2 may be complete and primary wave 3 may be nearing completion. Primary wave 4 may not move into primary wave 1 price territory below 16.195.
Regular flat corrections often fit within parallel channels. Cycle wave c may end about resistance at the upper edge of the channel. The most common Fibonacci Ratio for cycle wave c within a regular flat would be equality in length with cycle wave a.
MAIN DAILY CHART
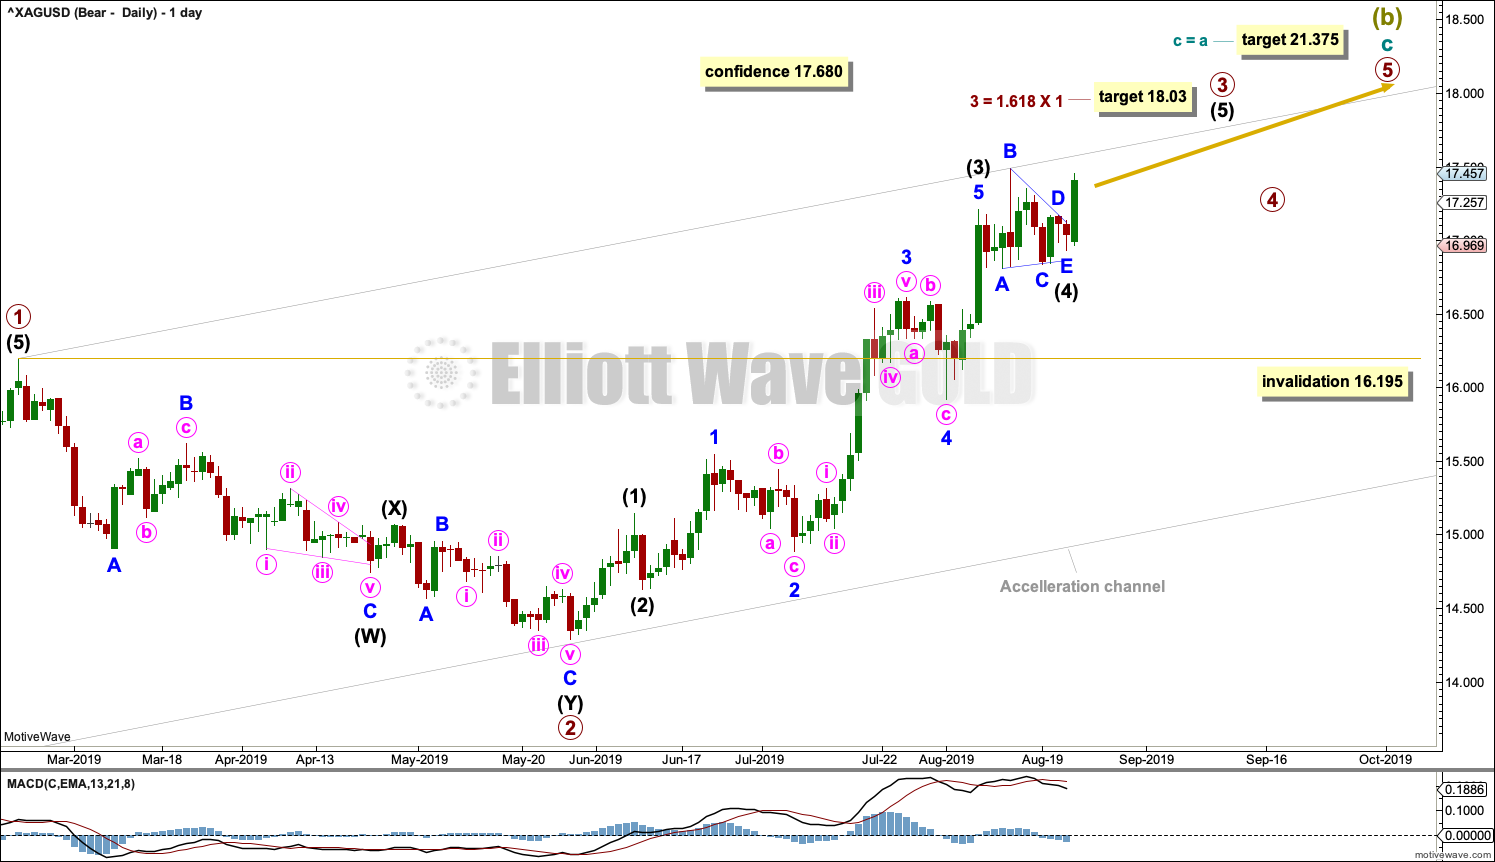
Click chart to enlarge.
Cycle wave C may be subdividing as an impulse. Within the impulse, primary wave 3 may be nearing completion. A target is calculated for primary wave 3 to reach a common Fibonacci Ratio to primary wave 1.
Primary wave 3 may only subdivide as an impulse. Within the impulse, there is alternation between a zigzag of intermediate wave (2) and a running contracting triangle of intermediate wave (4).
Intermediate wave (5) to end primary wave 3 may exhibit a further increase in strength. It may exhibit one or more blow off tops as it completes.
Primary wave 4 may not move into primary wave 1 price territory below 16.195.
ALTERNATE WEEKLY CHART
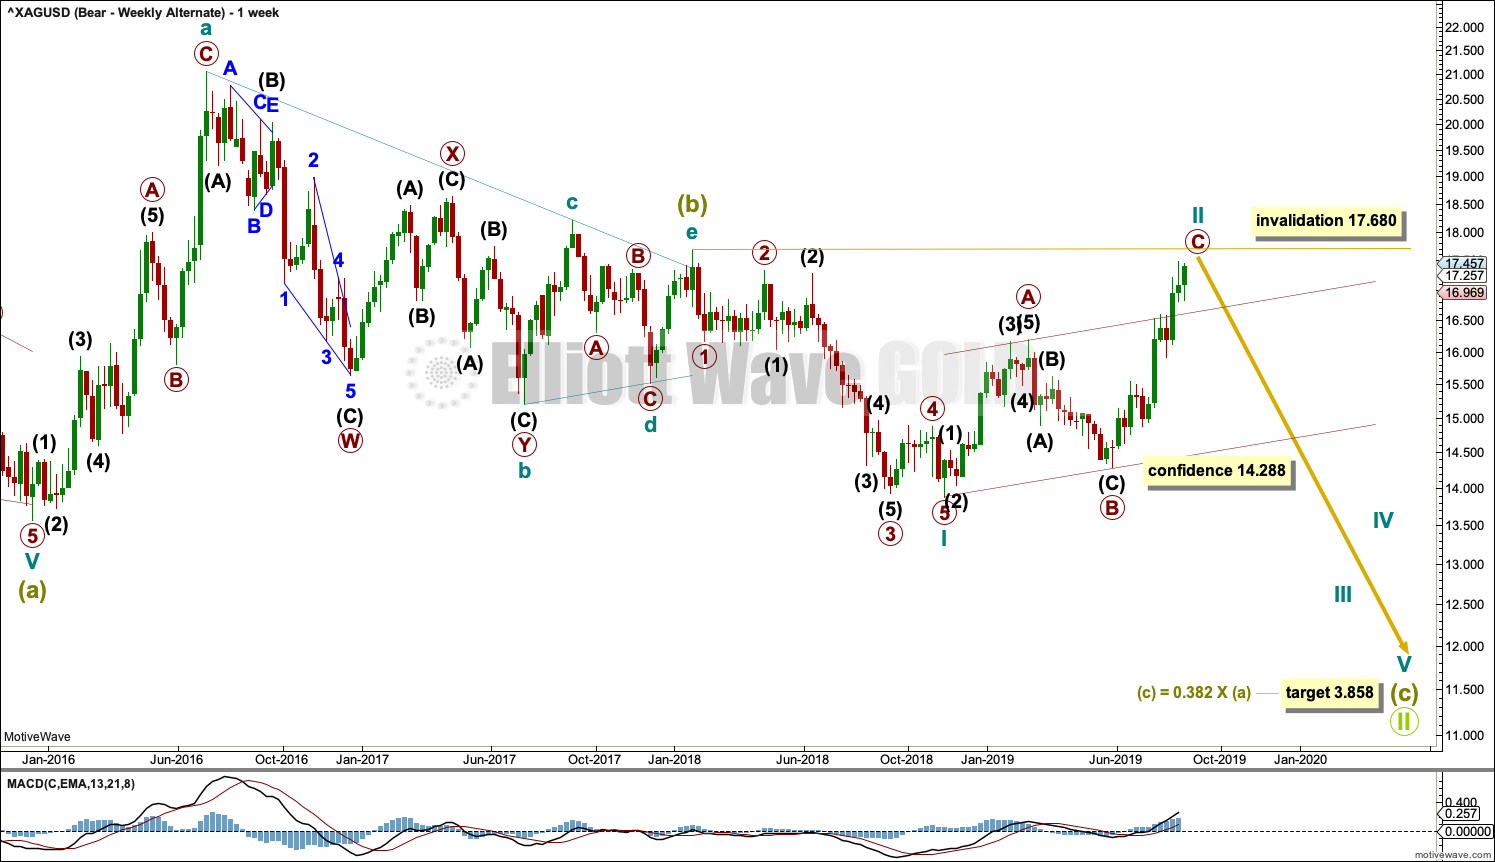
Click chart to enlarge.
This wave count is now an alternate for a bearish scenario.
It is possible that Super Cycle wave (b) is complete and Super Cycle wave (c) downwards has begun. Super Cycle wave (b) may fit as a regular contracting triangle.
Super Cyce wave (c) must subdivide as a five wave motive structure, most likely an impulse. Within the impulse, cycle wave I may be complete and cycle wave II may not move beyond the start of cycle wave I above 17.680.
ALTERNATE DAILY CHART
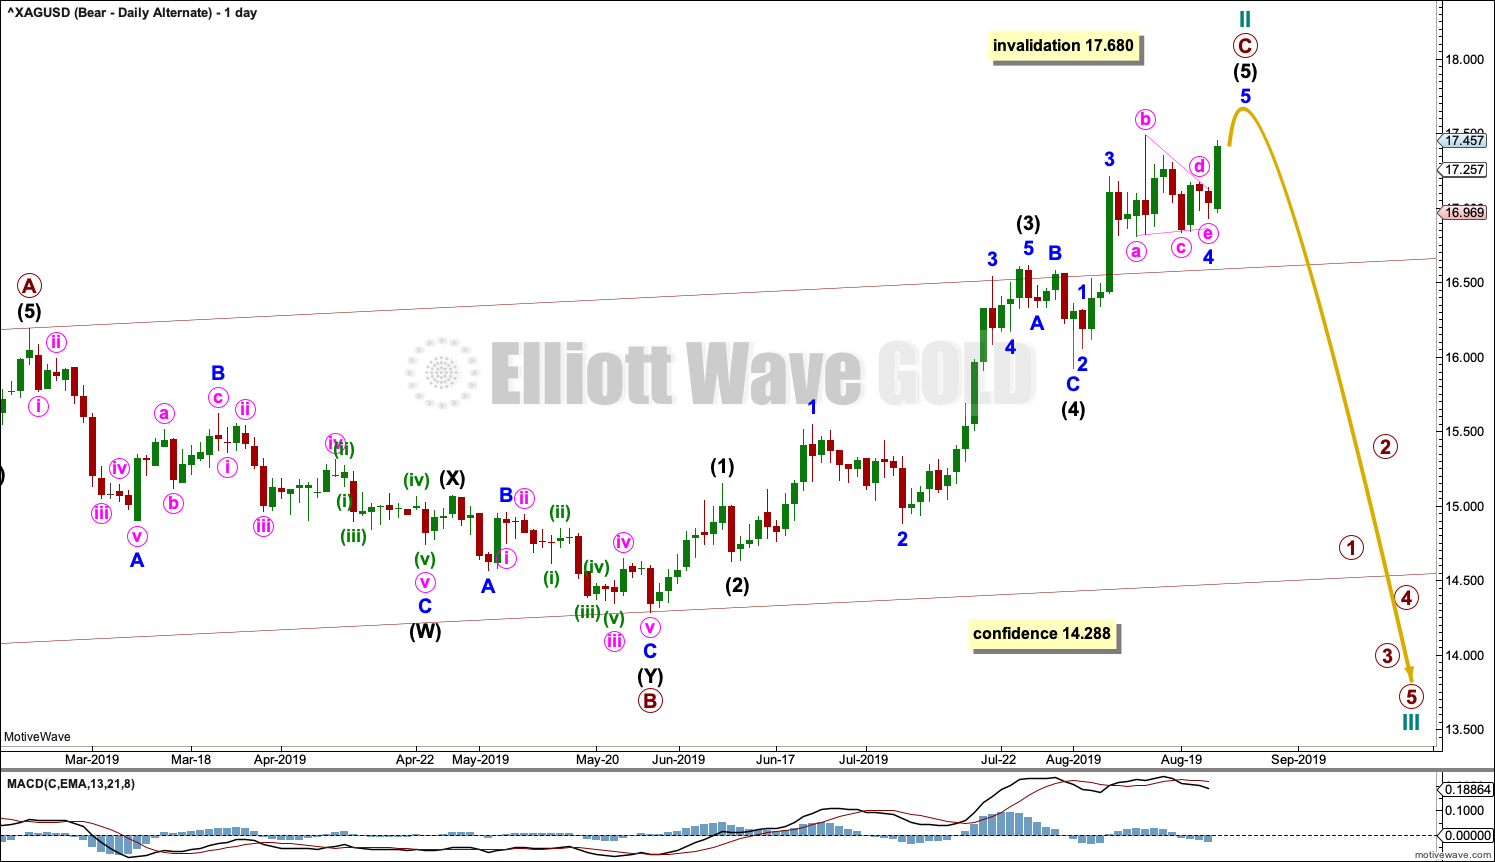
Click chart to enlarge.
Cycle wave II may be a zigzag. Primary wave C may be an incomplete impulse.
Within the impulse of primary wave C, intermediate waves (1) through to (4) may be complete. Intermediate wave (5) may be incomplete.
Within intermediate wave (5), minor waves 1 through to 3 may be complete. Minor wave 4 may be complete as a small triangle. Only minor wave 5 may be now required to complete the structure at all degrees.
Minor wave 5 may end above 17.488, but it may not move above 17.680.
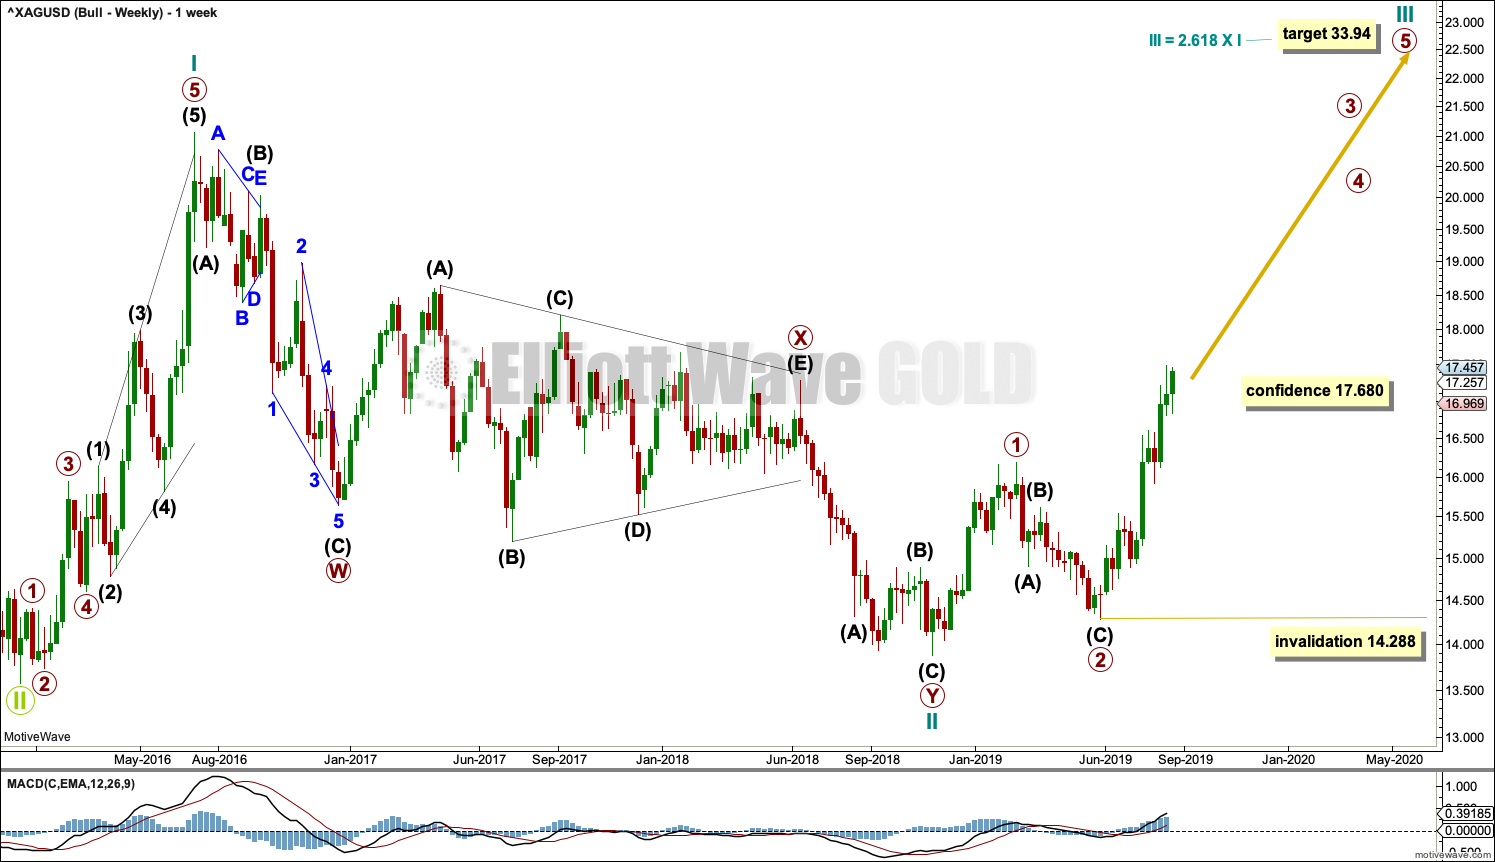
BULLISH WAVE COUNT
WEEKLY CHART
Click chart to enlarge.
This bullish Elliott wave count sees a new bull market beginning for Silver at the low in December 2015.
A new bull market should begin with a five wave structure upwards. This is labelled cycle wave I.
Following five steps forward should be three steps back. This is labelled cycle wave II. The Elliott wave corrective structure of cycle wave II is labelled as a double zigzag, which is a fairly common structure.
Cycle wave III may only subdivide as an impulse. Within the impulse, primary waves 1 and 2 may now be complete.
DAILY CHART
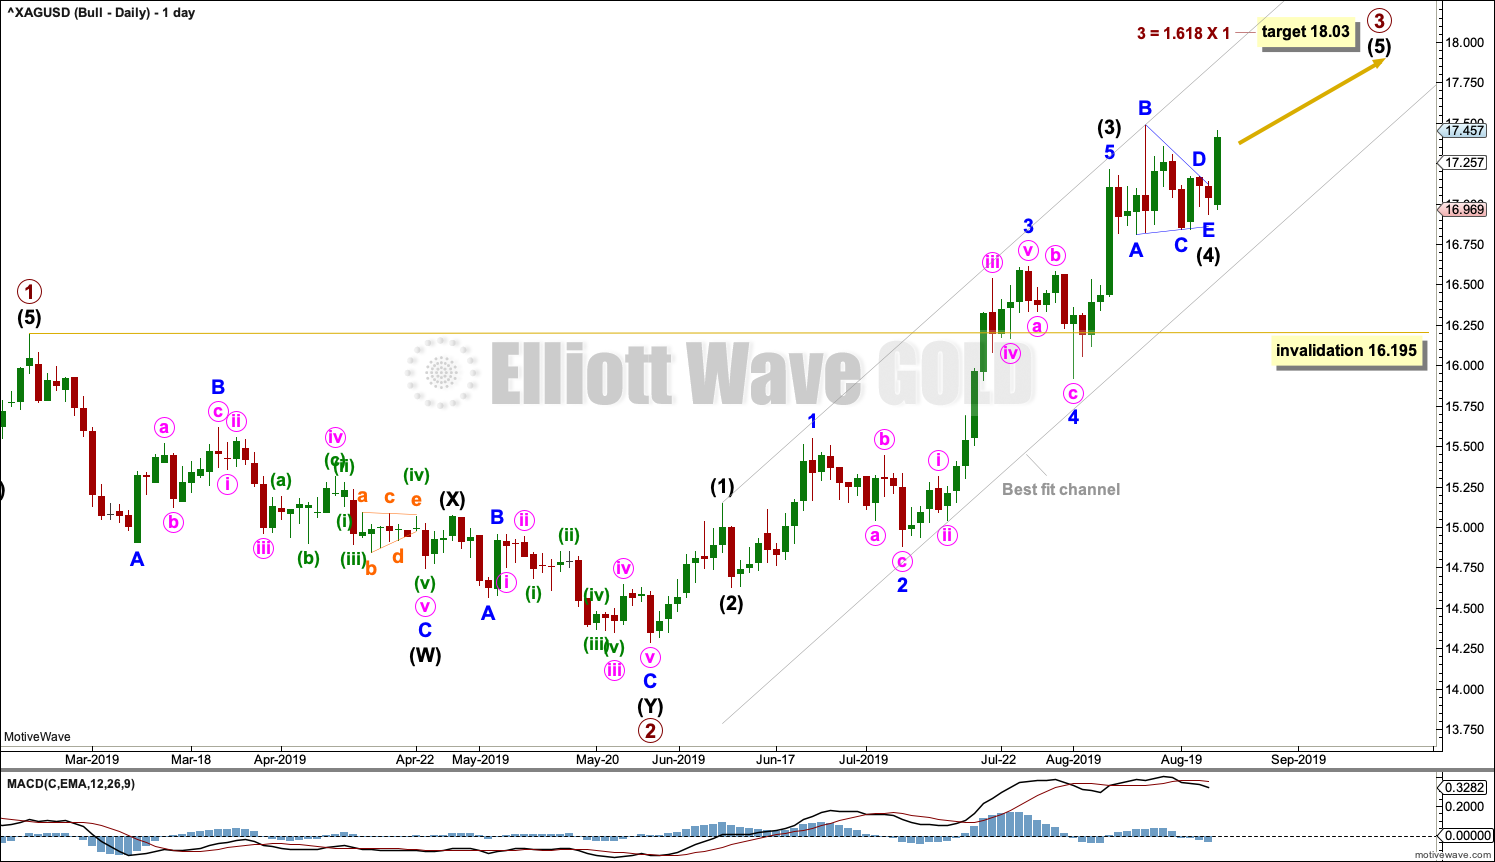
Click chart to enlarge.
Primary wave 3 may only subdivide as an impulse. Within the impulse, intermediate waves (1) through to (4) may be complete.
The target for primary wave 3 remains the same.
Primary wave 4 may not move into primary wave 1 price territory below 16.195.
TECHNICAL ANALYSIS
WEEKLY CHART
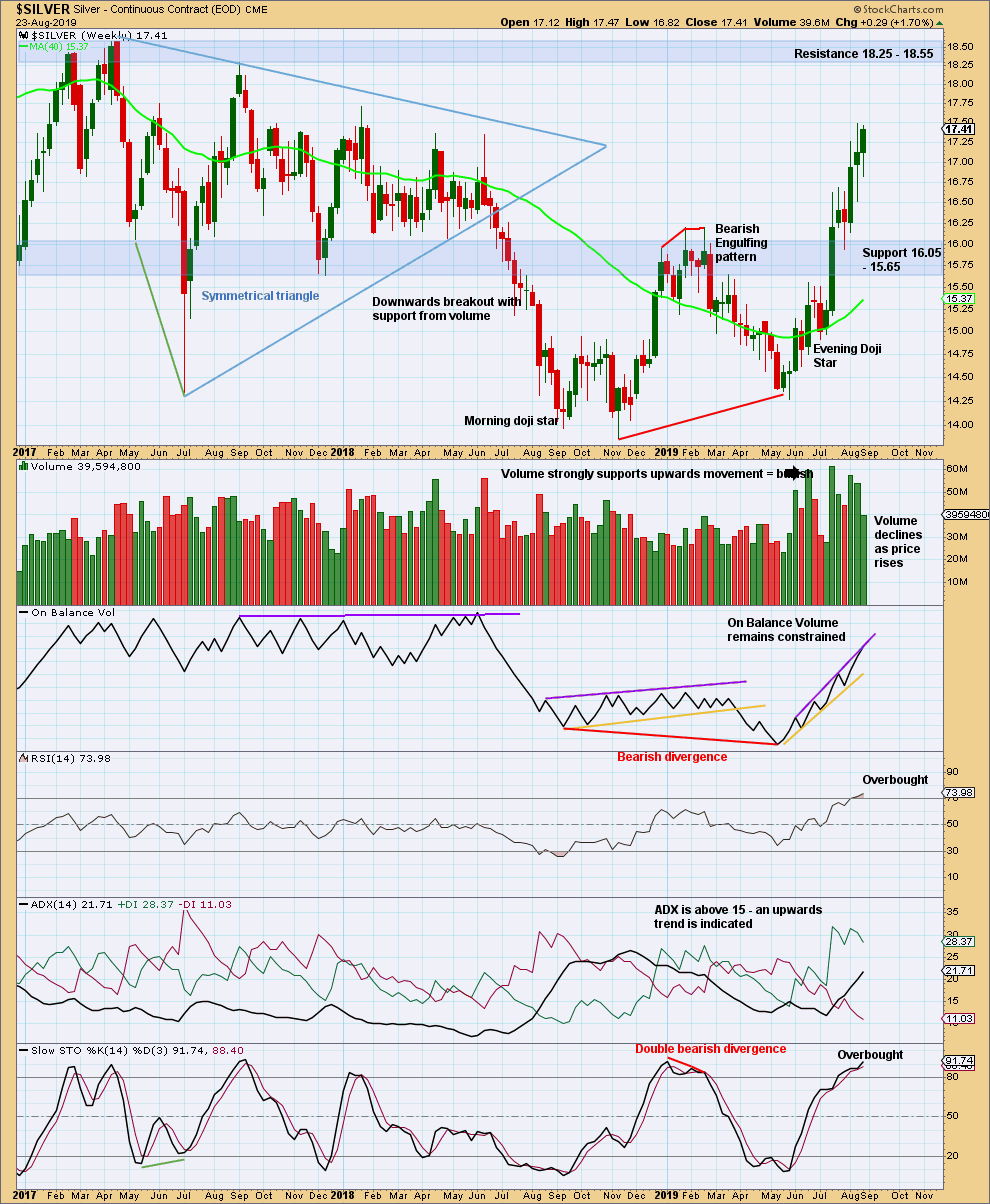
Click chart to enlarge. Chart courtesy of StockCharts.com.
Support has been tested and held. The upwards trend continues. Next strong resistance is in the blue shaded zone above.
DAILY CHART
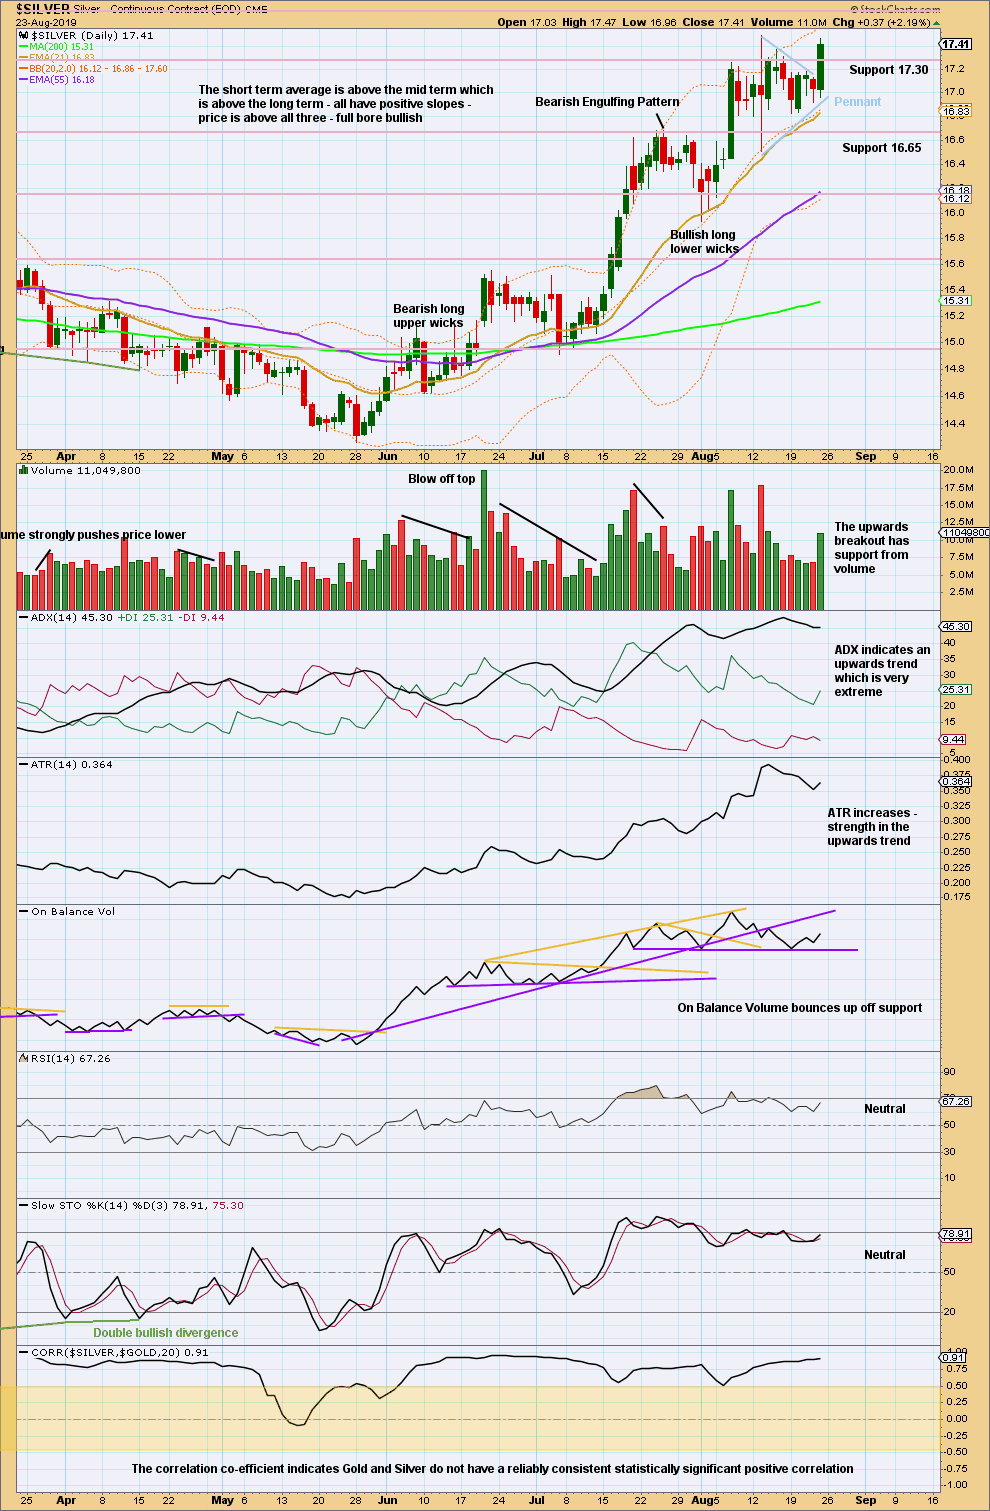
Click chart to enlarge. Chart courtesy of StockCharts.com.
There is an upwards trend at both the daily and weekly chart time frames. There is as yet no evidence the trend has ended. Expect pullbacks and consolidations to occur within the upwards trend.
The pennant pattern completed and has now been followed by an upwards breakout, which has support from volume. A target from the flag pole would be at 18.70.
Published @ 01:08 a.m. EST on August 24, 2019.
—
Careful risk management protects your trading account(s).
Follow my two Golden Rules:
1. Always trade with stops.
2. Risk only 1-5% of equity on any one trade.
—
New updates to this analysis are in bold.
Nice to see alternate bear daily get discarded.
Silver might have spiked this morning to make the primary wave 3 high.
Looks like for both gold and silver we should be entering a wave 4 correction to then be followed by another move to new highs for both bear and bull counts!
Looking forward to getting very long after a correction over the next week or two.
GLTA