
Downwards movement was expected for the week for Silver. This is exactly what has happened.
Summary: A trend change to a large multi week consolidation looks highly likely to have begun. The target for support is now at 16.59.
Monthly charts were last updated here.
ELLIOTT WAVE COUNTS
BEARISH WAVE COUNT
WEEKLY CHART
Click chart to enlarge.
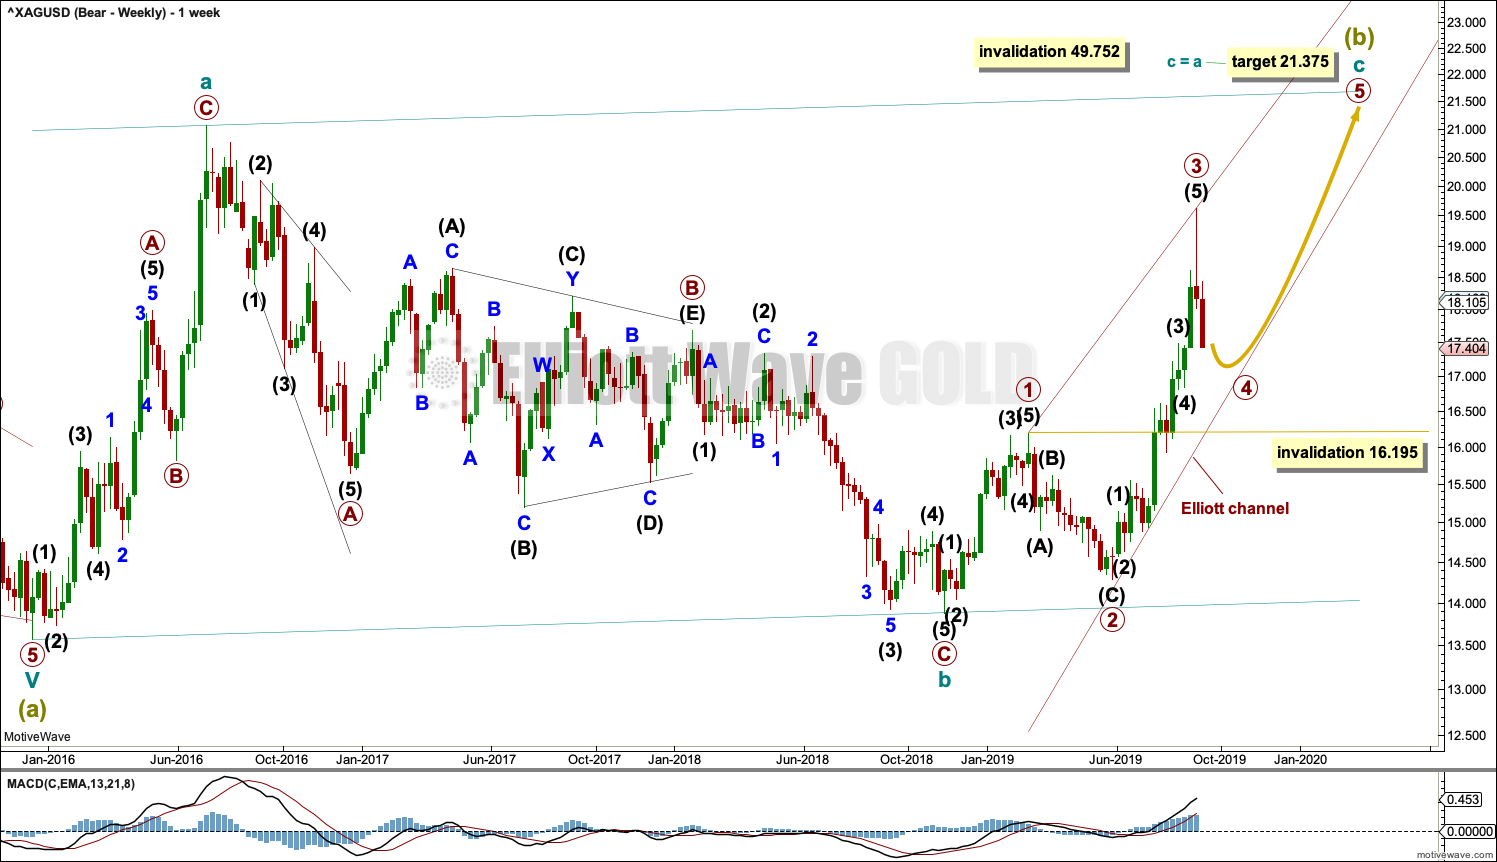
It is possible that Super Cycle wave (b) is an incomplete regular flat correction.
Within the regular flat correction, cycle wave a subdivides well as a zigzag and cycle wave b subdivides well as a zigzag, which is a 0.96 correction of cycle wave a.
Cycle wave c must complete as a five wave structure. Within cycle wave c, primary waves 1 through to 3 may be complete. Primary wave 4 may not move into primary wave 1 price territory below 16.195.
Regular flat corrections often fit within parallel channels. Cycle wave c may end about resistance at the upper edge of the channel. The most common Fibonacci Ratio for cycle wave c within a regular flat would be equality in length with cycle wave a.
It would be extremely likely, for this wave count, for cycle wave c to move at least slightly above the end of cycle wave a at 21.062 to avoid a truncation.
This week I have taken some time to see if Super Cycle wave (b) could be labelled as a complete corrective structure. At this time, I have been unable to find a solution. That does not mean it cannot be complete; if a solution is found, it will be published in comments during the week. For now it looks most likely that Super Cycle wave (b) is incomplete and needs one last high to complete it.
DAILY CHART
Click chart to enlarge.
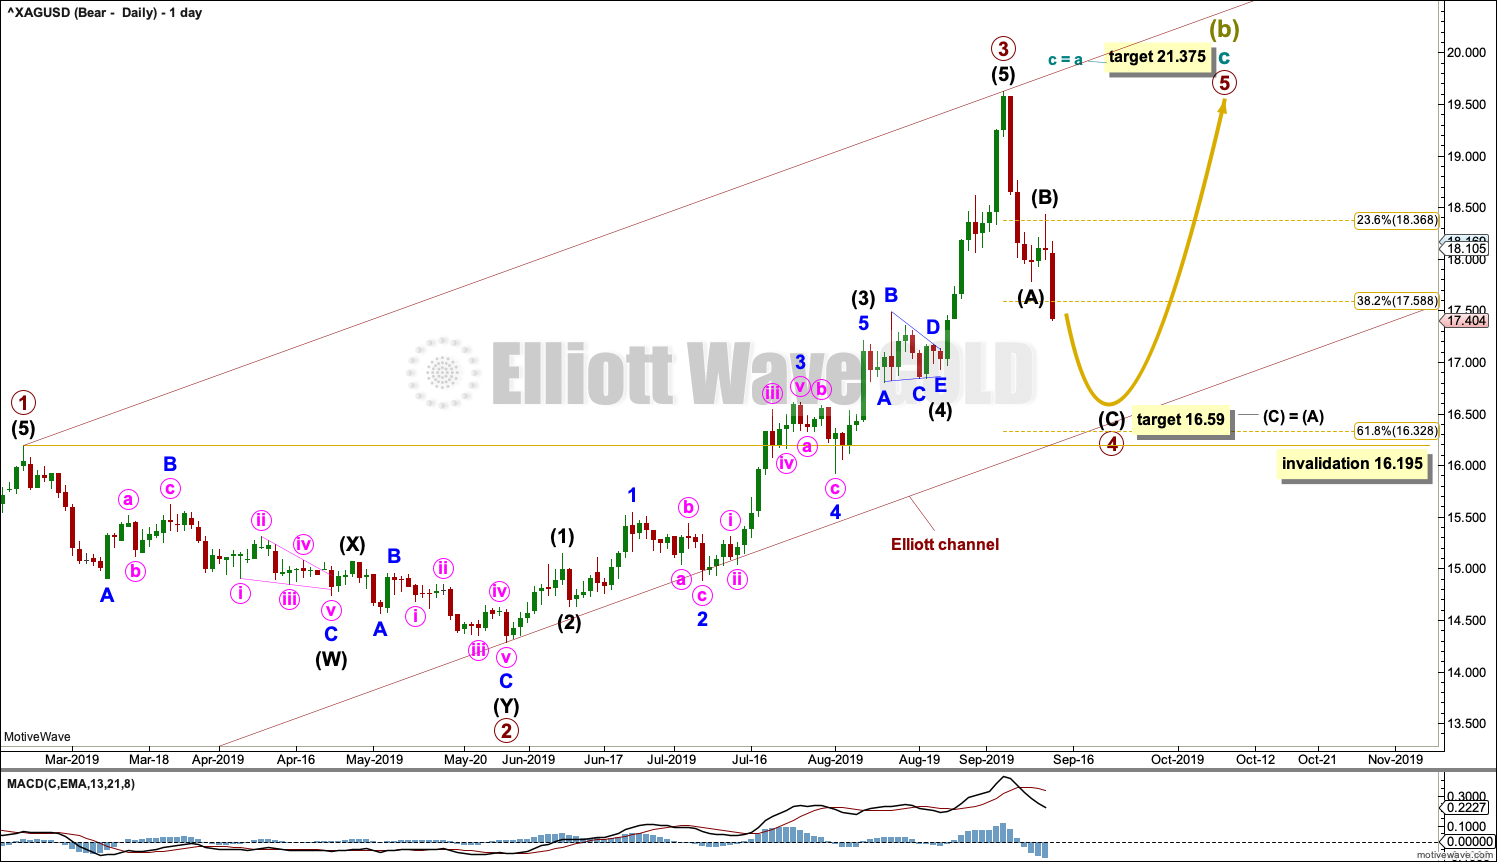
Cycle wave C may be subdividing as an impulse. Within the impulse, primary waves 1 to 3 may be complete.
Primary wave 4 may not move into primary wave 1 price territory below 16.195.
Primary wave 2 lasted 69 sessions and subdivided as a deep 0.82 double zigzag. Given the guideline of alternation, primary wave 4 may be expected to be shallow and most likely a sideways type of correction such as a flat, combination or triangle.
Primary wave 4 may be more brief than primary wave 2; fourth waves for Silver tend to be more brief than counterpart second waves.
The target for primary wave 4 is this week recalculated using the most common Fibonacci Ratio between intermediate waves (A) and (C).
BULLISH WAVE COUNT
WEEKLY CHART
Click chart to enlarge.
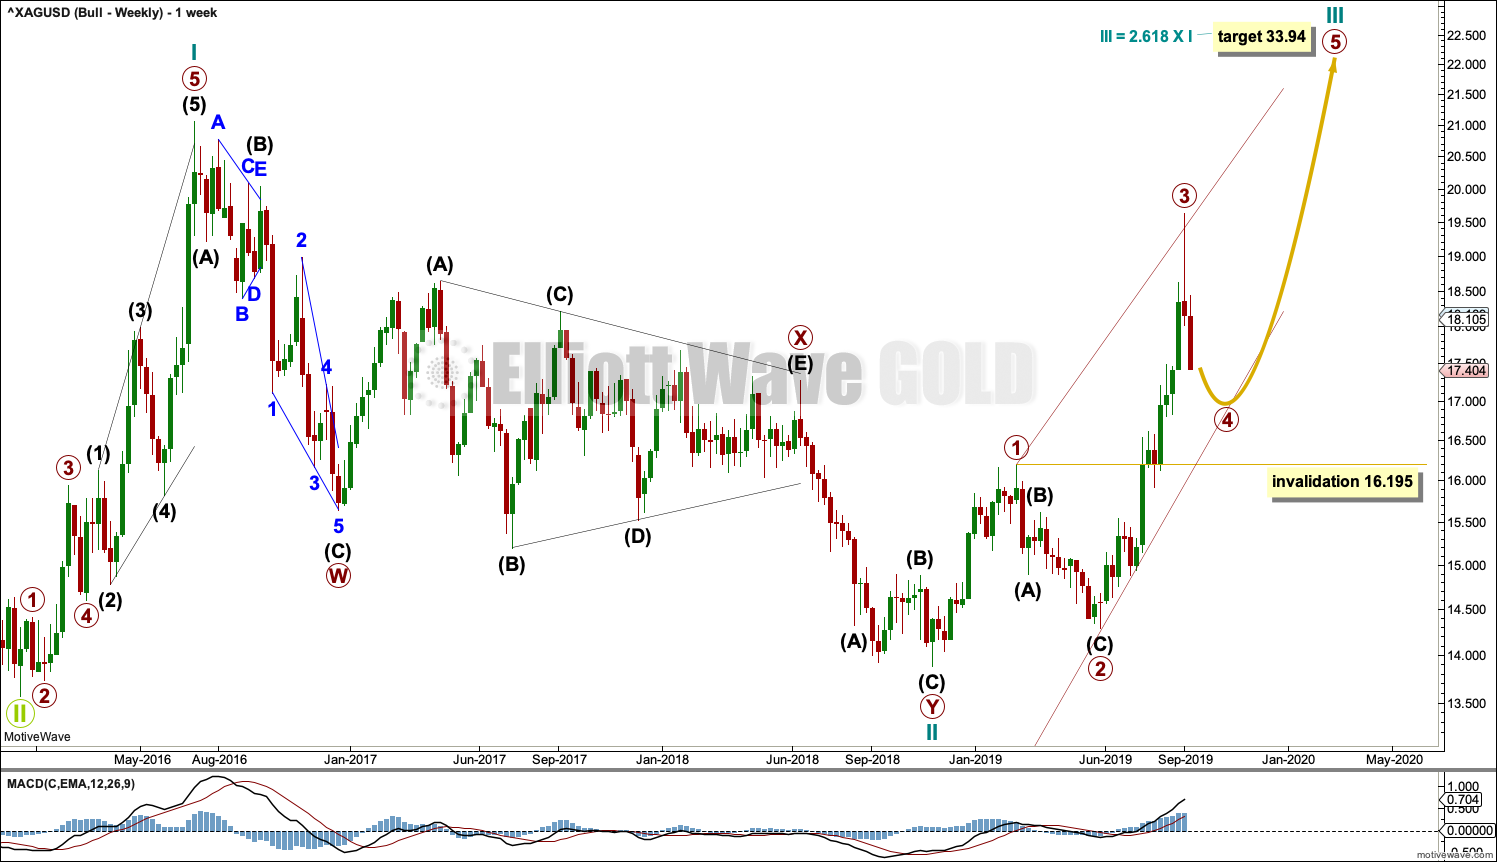
This bullish Elliott wave count sees a new bull market beginning for Silver at the low in December 2015.
A new bull market should begin with a five wave structure upwards. This is labelled cycle wave I.
Following five steps forward should be three steps back. This is labelled cycle wave II. The Elliott wave corrective structure of cycle wave II is labelled as a double zigzag, which is a fairly common structure.
Cycle wave III may only subdivide as an impulse. Within the impulse, primary waves 1 through to 3 may now be complete.
Cycle wave III must move beyond the end of cycle wave I above 21.062. Cycle wave III must move far enough above this point to allow room for cycle wave IV to unfold and remain above cycle wave I price territory.
DAILY CHART
Click chart to enlarge.
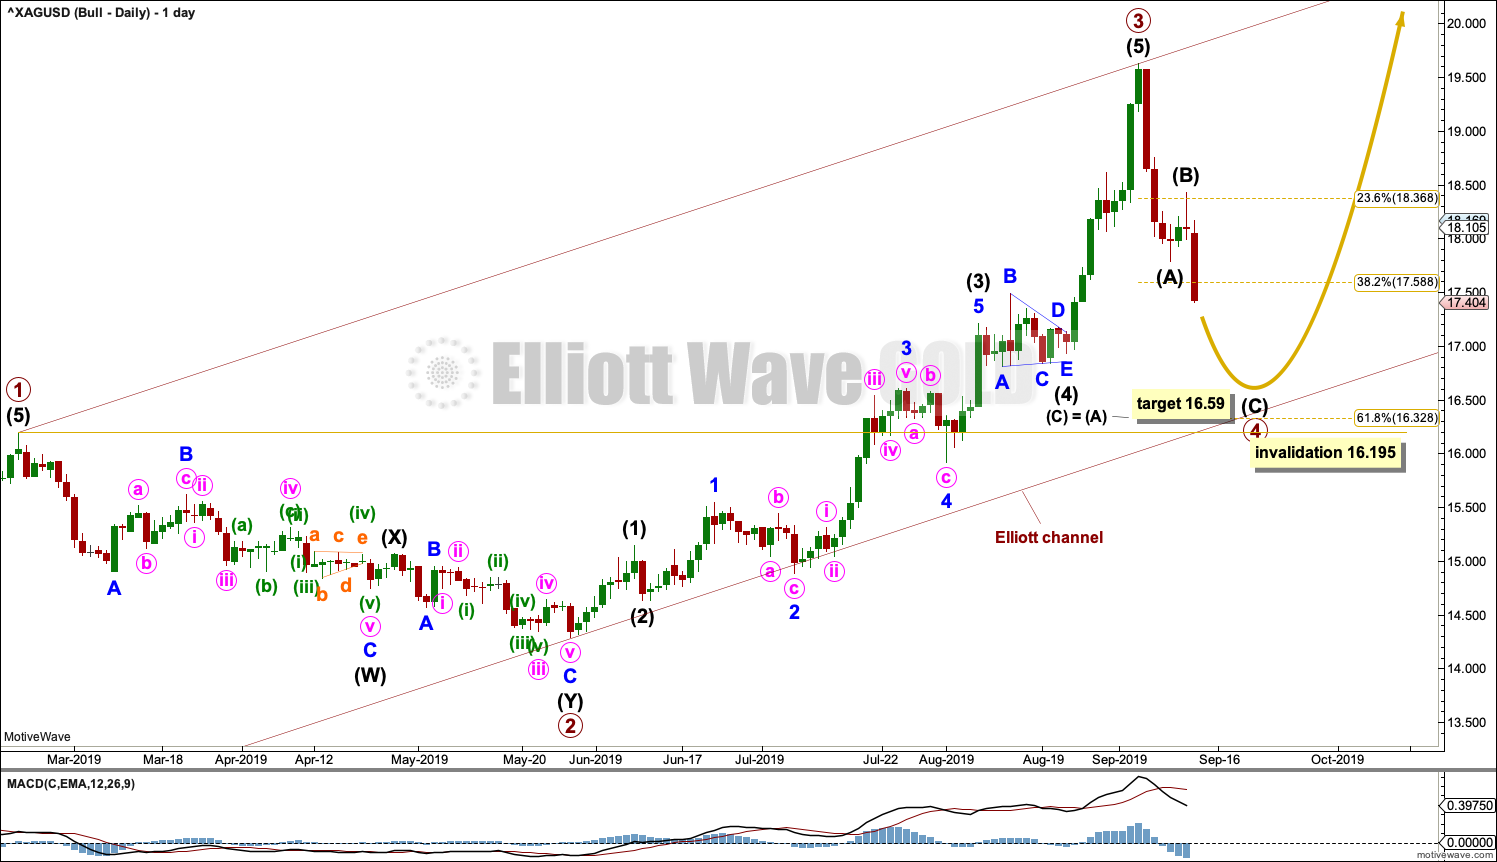
Both Elliott wave counts now expect a primary degree fourth wave to unfold. There is currently no divergence between the two wave counts at the daily chart level.
TECHNICAL ANALYSIS
WEEKLY CHART
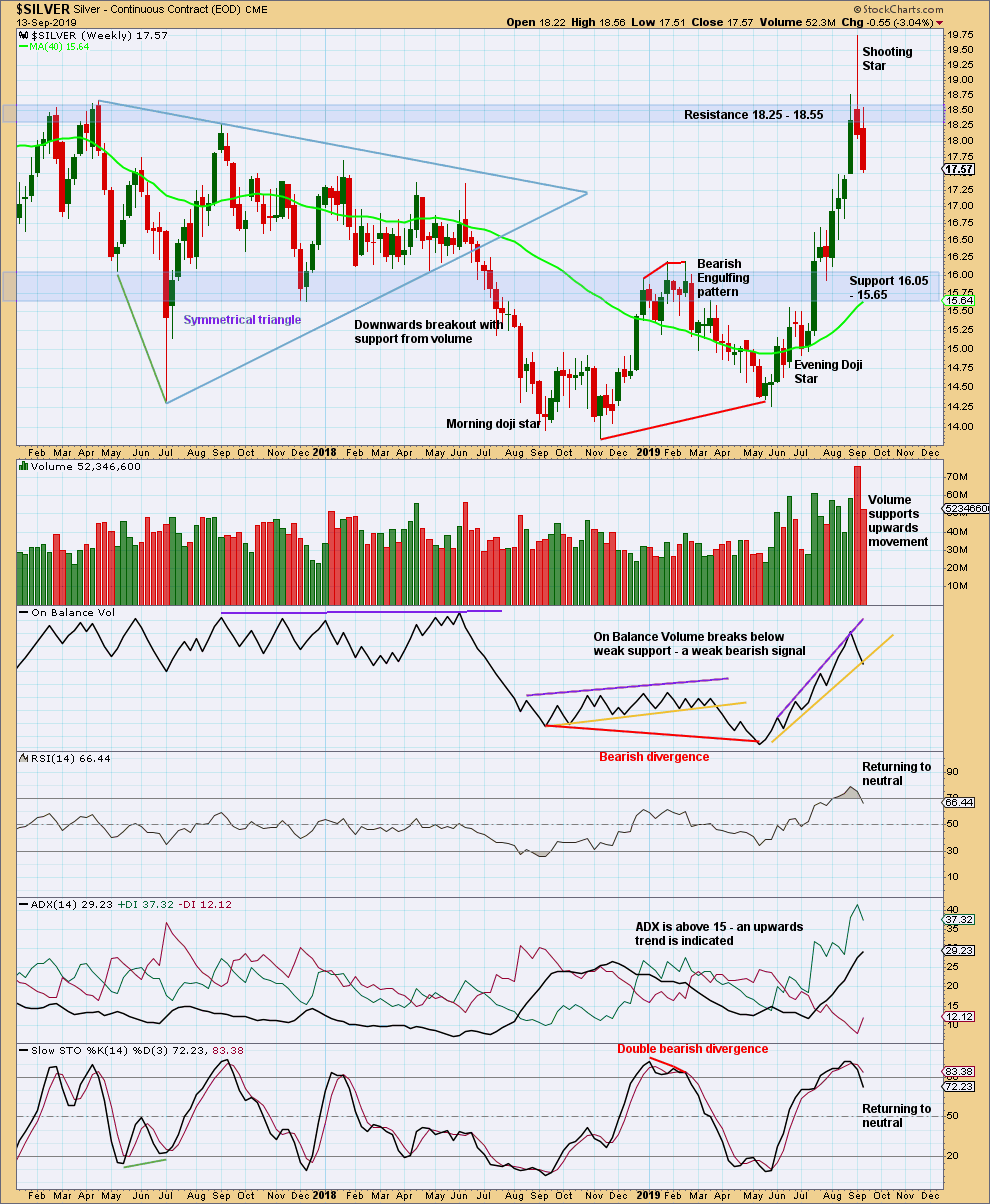
Click chart to enlarge. Chart courtesy of StockCharts.com.
Last week looks like a blow off top with a very strong bearish candlestick reversal pattern. This week confirms the bearishness in that pattern.
DAILY CHART
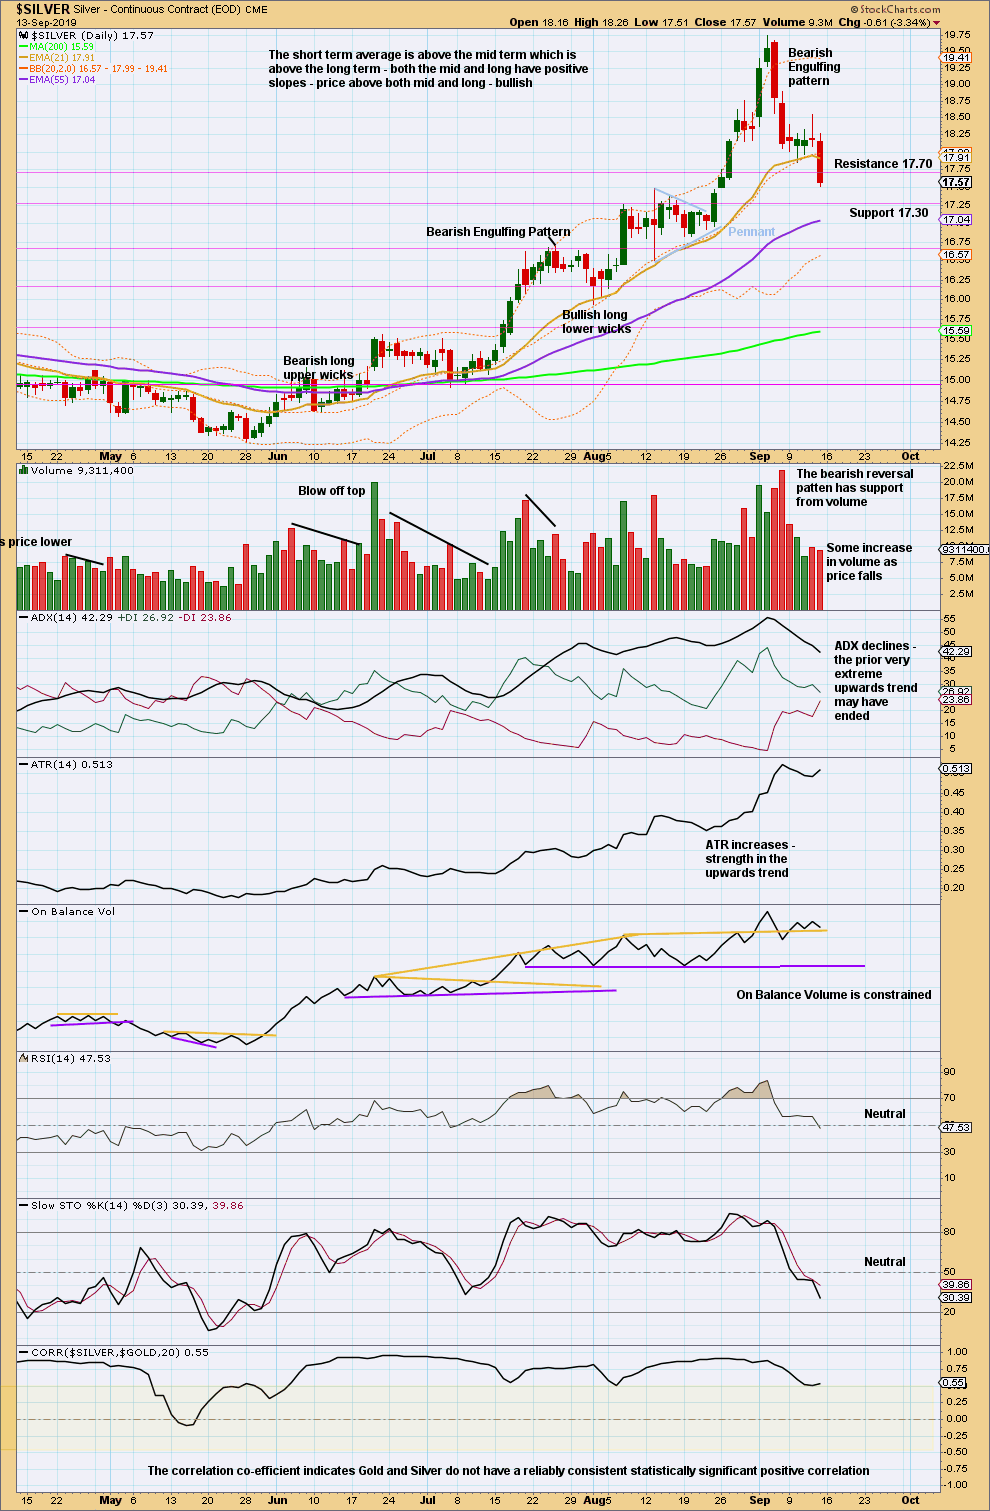
Click chart to enlarge. Chart courtesy of StockCharts.com.
The Bearish Engulfing reversal pattern has strong support from volume. It looks strongly like a high is now in for Silver. Look for support along the way down at identified horizontal trend lines. Do not expect price to move in a straight line; look for bounces and consolidations on the way down.
Published @ 08:31 p.m. EST on September 14, 2019.
—
Careful risk management protects your trading account(s).
Follow my two Golden Rules:
1. Always trade with stops.
2. Risk only 1-5% of equity on any one trade.
—
New updates to this analysis are in bold.
Thanks ZH. That makes a lot of sense.
Any thoughts on an upside target for the bounce?
ZH,
I’d be thinking about 18.5, but I’d be very cautious about chasing the dregs of this move (potentially).
I’d sit and watch it (unless you wanted a very small position), and go short when it looks like its peaked – longer term trend is down, so you are safer going short when the time is right.
It looks like we had bearish flag forming and it broke to the downside. This supports your 16.59 target. Also the commercials did not cover their short positions in the move down from 19.6 or so to 18. 16.59 silver would be a gift in the bullish or bearish wave analysis. Great update Lara. Keep up the great work. This really warrants careful watching.
I’m curious if you look at the gold/silver ratio. At this point, I’m wondering if Gold falls and Silver rises, or perhaps Gold consolidates sideways and Silver climbs to a new local high. Do you have any thoughts and possible targets on the Gold/Silver Ratio?
No, I don’t look at it. Because there is not a reliable statistically significant correlation between it and the price of Gold.
The correlation co-efficient between the price of Gold and the Gold / Silver ratio is on the bottom of this chart. It’s all over the place.
When two sets of data do not have a reliable and statistically significant correlation co-efficient, it is my approach to always expect that they are not correlated, or that any correlation which appears to exist from time to time may end at any moment.
great – many thanks!