
Overall, downwards movement was expected for the week for Silver. An inside week sees price move sideways, remaining constrained within support and resistance.
Summary: A trend change to a large multi week consolidation looks highly likely to have begun. Look for support at the lower edge of the Elliott channel on the daily charts.
Monthly charts were last updated here.
ELLIOTT WAVE COUNTS
BEARISH WAVE COUNT
WEEKLY CHART

Click chart to enlarge.
It is possible that Super Cycle wave (b) is an incomplete regular flat correction.
Within the regular flat correction, cycle wave a subdivides well as a zigzag and cycle wave b subdivides well as a zigzag, which is a 0.96 correction of cycle wave a.
Cycle wave c must complete as a five wave structure. Within cycle wave c, primary waves 1 through to 3 may be complete. Primary wave 4 may not move into primary wave 1 price territory below 16.195.
Regular flat corrections often fit within parallel channels. Cycle wave c may end about resistance at the upper edge of the channel. The most common Fibonacci Ratio for cycle wave c within a regular flat would be equality in length with cycle wave a.
It would be extremely likely, for this wave count, for cycle wave c to move at least slightly above the end of cycle wave a at 21.062 to avoid a truncation.
DAILY CHART
Click chart to enlarge.
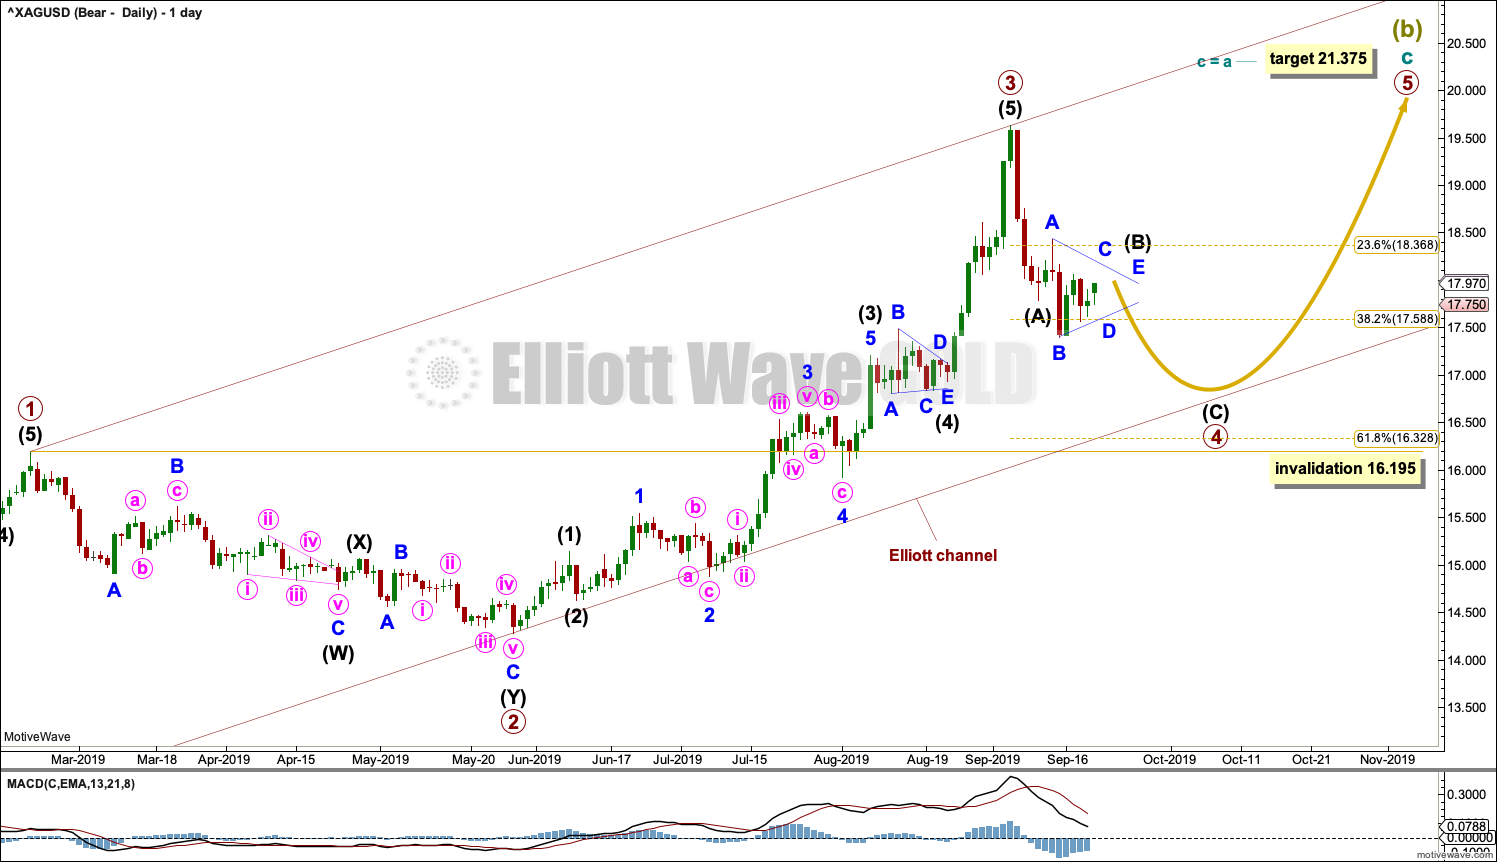
Cycle wave C may be subdividing as an impulse. Within the impulse, primary waves 1 to 3 may be complete.
Primary wave 4 may not move into primary wave 1 price territory below 16.195.
Primary wave 2 lasted 69 sessions and subdivided as a deep 0.82 double zigzag. Given the guideline of alternation, primary wave 4 may be expected to be shallow and most likely a sideways type of correction such as a flat, combination or triangle.
Primary wave 4 may be more brief than primary wave 2; fourth waves for Silver tend to be more brief than counterpart second waves.
Each daily chart this week considers a different structure for intermediate wave (B).
This daily chart considers a running contracting triangle. Within primary wave 4, intermediate wave (B) may be continuing sideways.
When intermediate wave (B) may again be complete, then a new target for intermediate wave (C) to end may be calculated.
BULLISH WAVE COUNT
WEEKLY CHART
Click chart to enlarge.
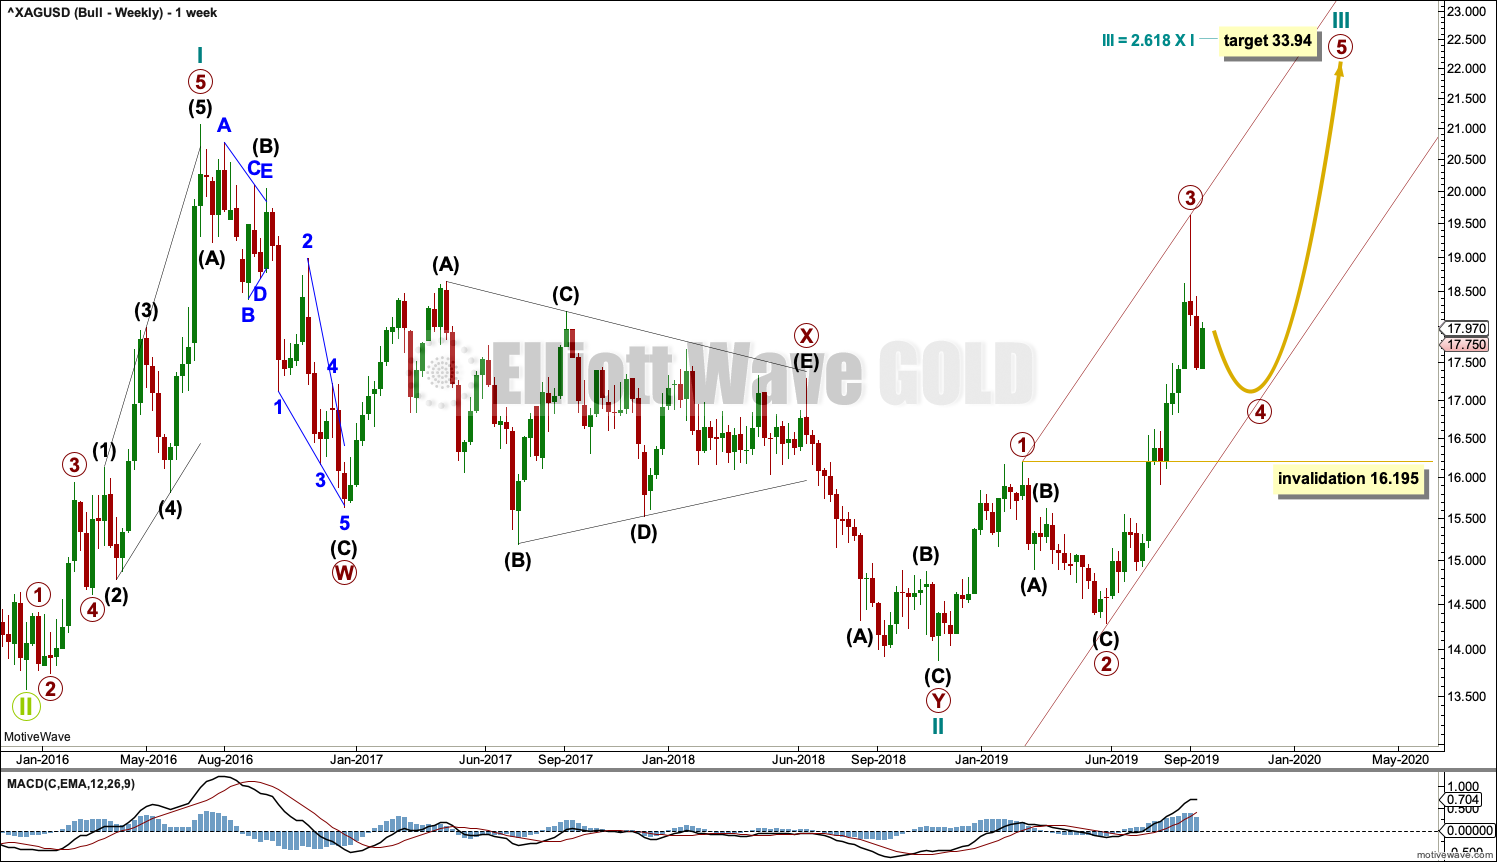
This bullish Elliott wave count sees a new bull market beginning for Silver at the low in December 2015.
A new bull market should begin with a five wave structure upwards. This is labelled cycle wave I.
Following five steps forward should be three steps back. This is labelled cycle wave II. The Elliott wave corrective structure of cycle wave II is labelled as a double zigzag, which is a fairly common structure.
Cycle wave III may only subdivide as an impulse. Within the impulse, primary waves 1 through to 3 may now be complete.
Cycle wave III must move beyond the end of cycle wave I above 21.062. Cycle wave III must move far enough above this point to allow room for cycle wave IV to unfold and remain above cycle wave I price territory.
DAILY CHART
Click chart to enlarge.
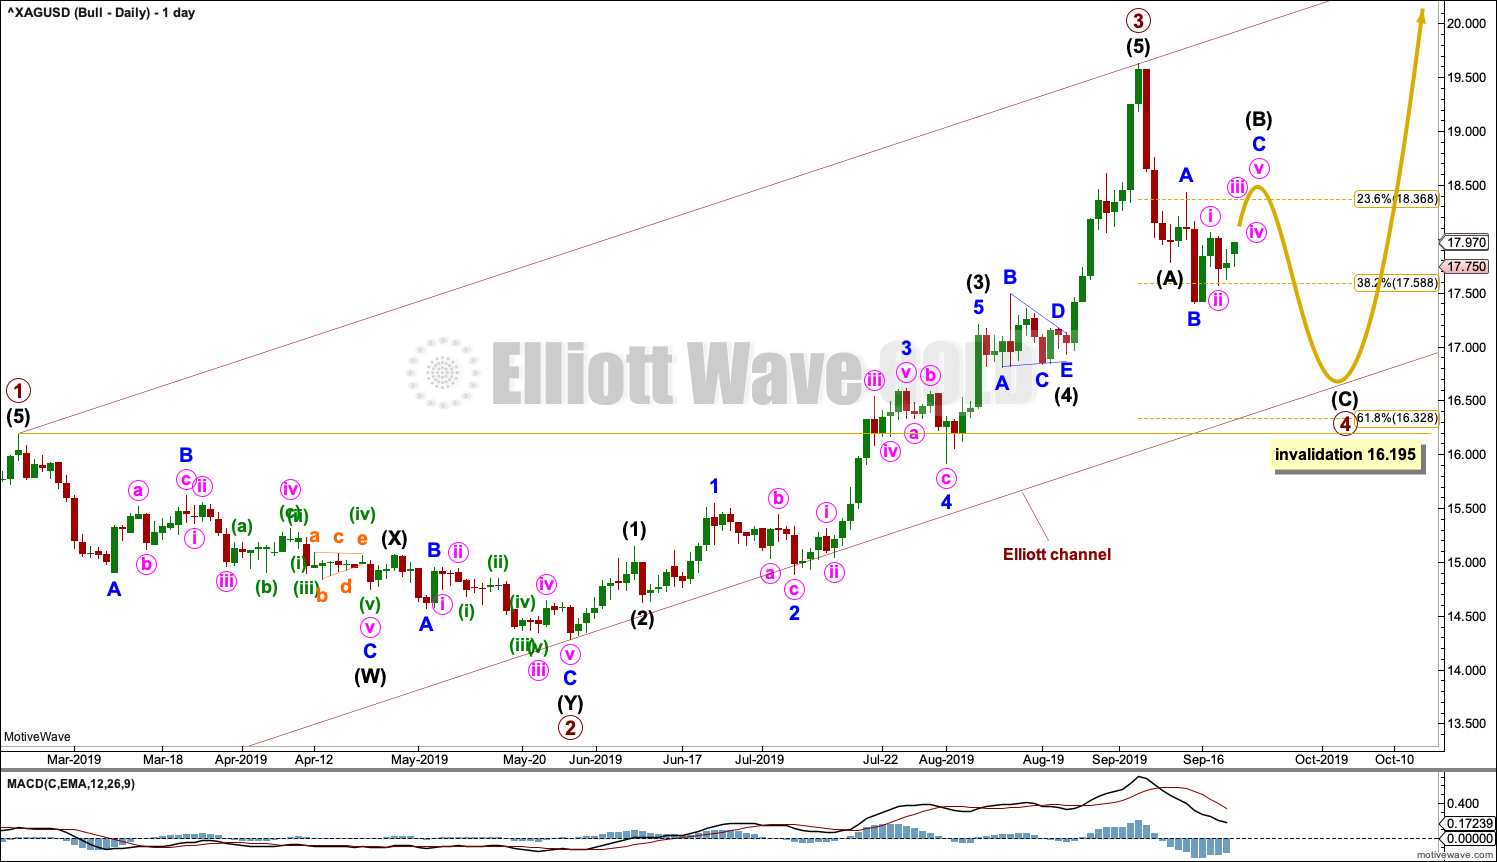
Both Elliott wave counts now expect a primary degree fourth wave to unfold. This second daily chart considers a different structure for intermediate wave (B) within primary wave 4. Intermediate wave (B) may be unfolding as an expanded flat correction.
TECHNICAL ANALYSIS
WEEKLY CHART

Click chart to enlarge. Chart courtesy of StockCharts.com.
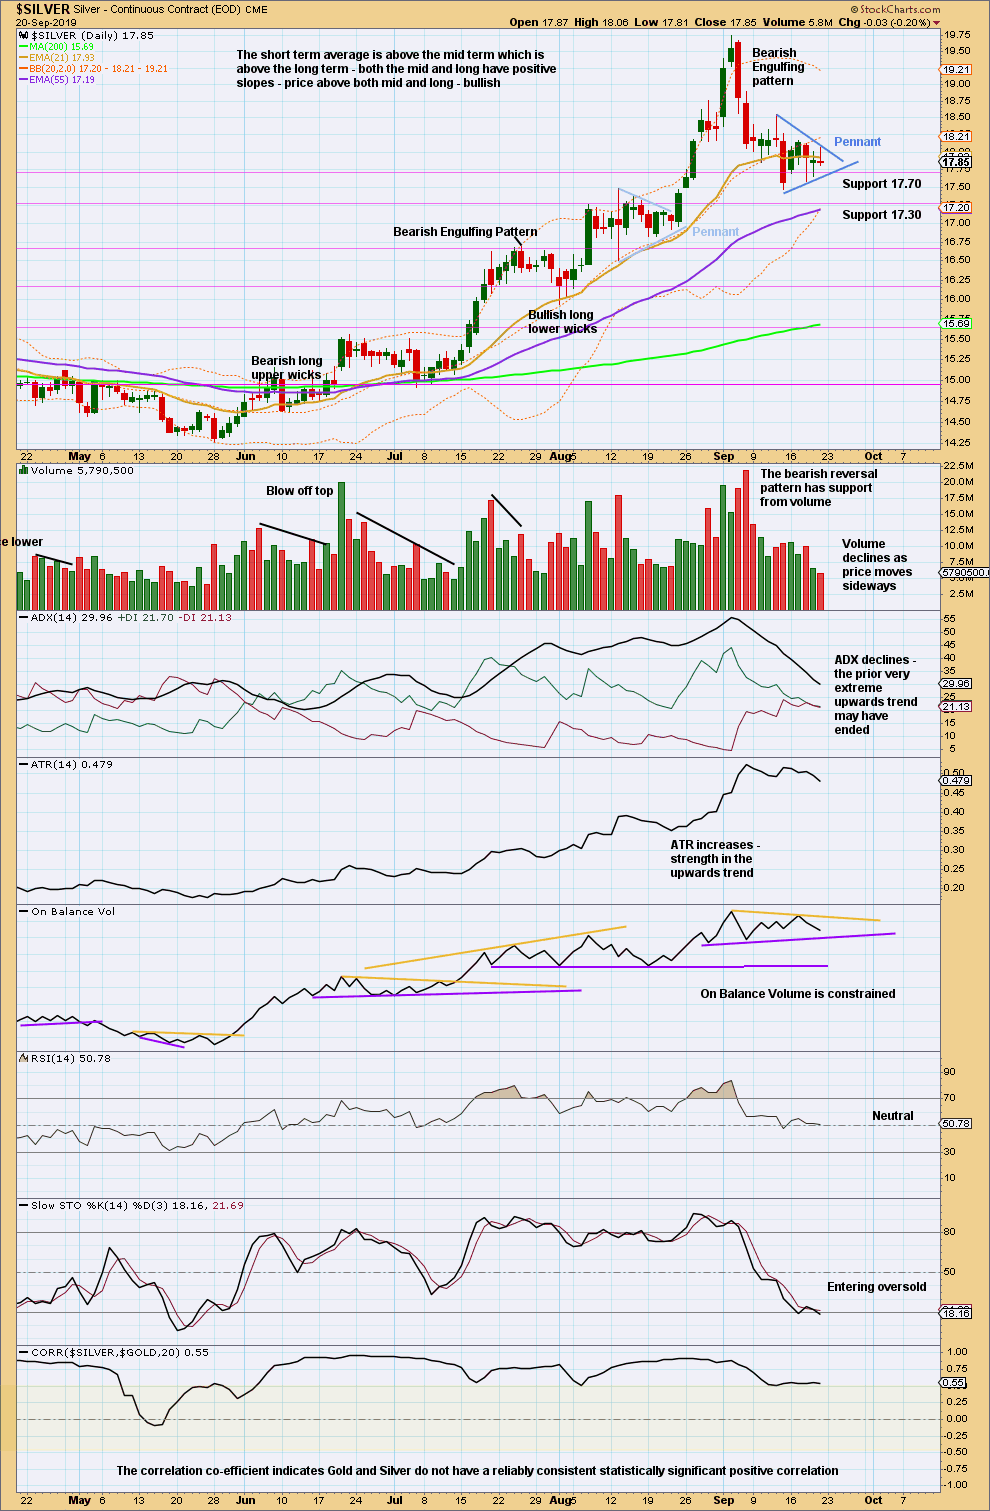
This week looks like a pause within a downwards movement. The week closes inside with a small real body. Volume does not support upwards movement within the week.
DAILY CHART
Click chart to enlarge. Chart courtesy of StockCharts.com.
Last week members were warned to not expect price to move in a straight line, to look for bounces and consolidations on the way down. This week may be completing a small consolidation, which may be a small pennant pattern. The target calculated from the pennant is about 15.80.
Published @ 08:50 p.m. EST.
—
Careful risk management protects your trading account(s).
Follow my two Golden Rules:
1. Always trade with stops.
2. Risk only 1-5% of equity on any one trade.
—
New updates to this analysis are in bold.
my 2c is i sold 100% silver position at 19.40, will nibble at 16.98
well I was short last night, so I guess it doesn’t matter now 🙂
😂me too
Lara, do you have a calculated target for this current silver bounce? I took a short at the end of the day, may be slightly early but I don’t mind if we’re close
my comment is so lonely 🙁
I expect that now the bounce is over and it followed the pathway I had outlined on the daily chart for the bull count.
Now on down to the support line of the maroon Elliott channel.