
Again, last week’s analysis expected more upwards movement. The first target was at 18.03, the next at 18.70. Price reached a high at 18.615 for the week.
Summary: A trend change to a large multi week consolidation looks most likely to have begun at this week’s high. The target for support is 16.962.
Monthly charts were last updated here.
ELLIOTT WAVE COUNTS
BEARISH WAVE COUNT
WEEKLY CHART
Click chart to enlarge.
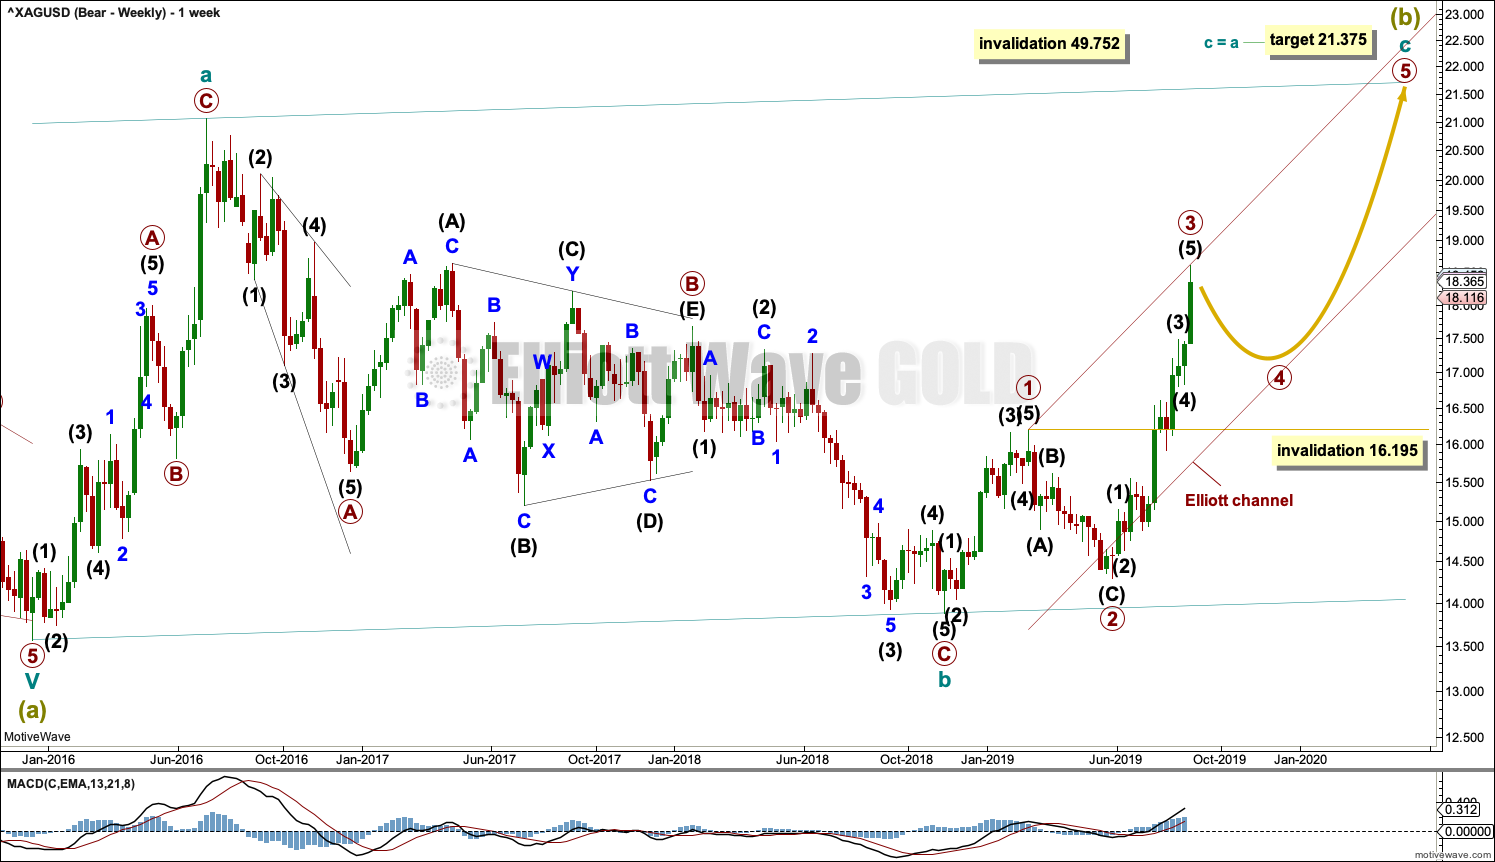
It is possible that Super Cycle wave (b) is an incomplete regular flat correction.
Within the regular flat correction, cycle wave a subdivides well as a zigzag and cycle wave b subdivides well as a zigzag, which is a 0.96 correction of cycle wave a.
Cycle wave c must complete as a five wave structure. Within cycle wave c, primary waves 1 and 2 may be complete and primary wave 3 may be nearing completion. Primary wave 4 may not move into primary wave 1 price territory below 16.195.
Regular flat corrections often fit within parallel channels. Cycle wave c may end about resistance at the upper edge of the channel. The most common Fibonacci Ratio for cycle wave c within a regular flat would be equality in length with cycle wave a.
It would be extremely likely, for this wave count, for cycle wave c to move at least slightly above the end of cycle wave a at 21.062 to avoid a truncation.
DAILY CHART
Click chart to enlarge.
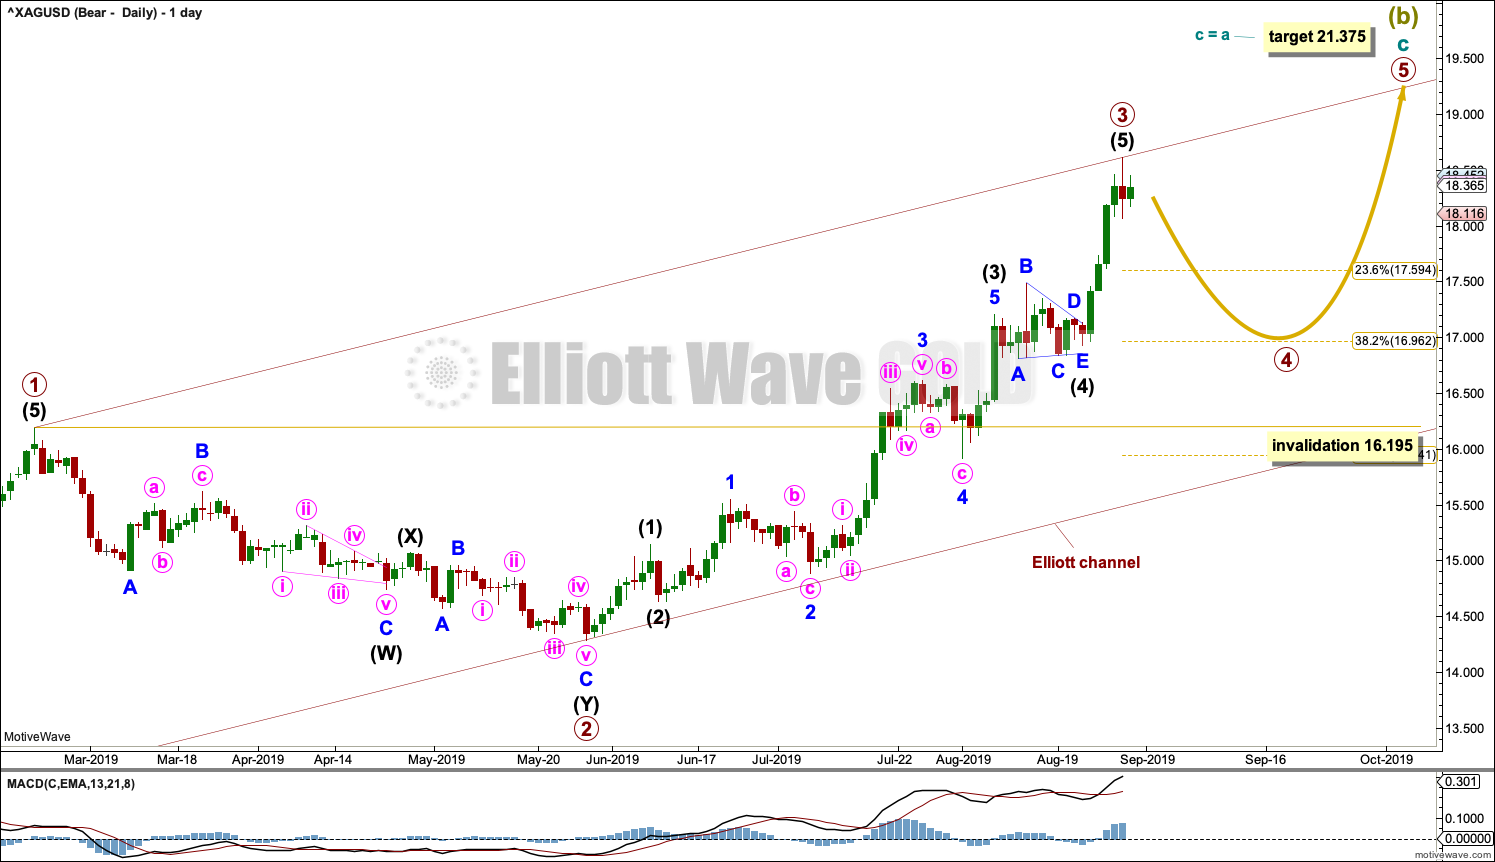
Cycle wave C may be subdividing as an impulse. Within the impulse, primary waves 1 to 3 may be complete.
Primary wave 4 may not move into primary wave 1 price territory below 16.195.
Primary wave 2 lasted 69 sessions and subdivided as a deep 0.82 double zigzag. Given the guideline of alternation, primary wave 4 may be expected to be shallow and most likely a sideways type of correction such as a flat, combination or triangle.
Primary wave 4 may be more brief than primary wave 2; fourth waves for Silver tend to be more brief than counterpart second waves.
BULLISH WAVE COUNT
WEEKLY CHART
Click chart to enlarge.
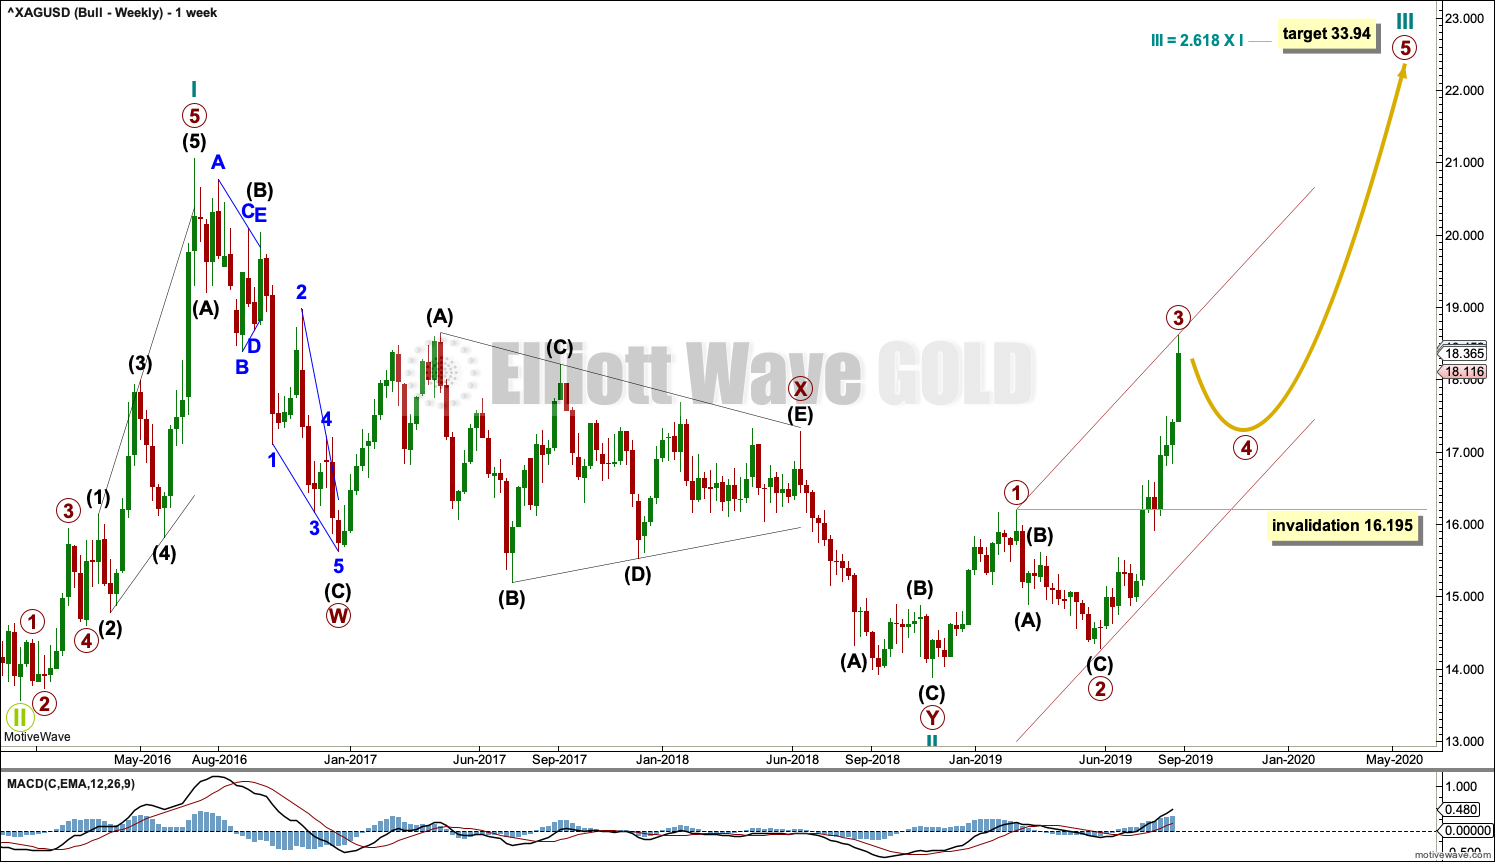
This bullish Elliott wave count sees a new bull market beginning for Silver at the low in December 2015.
A new bull market should begin with a five wave structure upwards. This is labelled cycle wave I.
Following five steps forward should be three steps back. This is labelled cycle wave II. The Elliott wave corrective structure of cycle wave II is labelled as a double zigzag, which is a fairly common structure.
Cycle wave III may only subdivide as an impulse. Within the impulse, primary waves 1 through to 3 may now be complete.
Cycle wave III must move beyond the end of cycle wave I above 21.062. Cycle wave III must move far enough above this point to allow room for cycle wave IV to unfold and remain above cycle wave I price territory.
DAILY CHART
Click chart to enlarge.
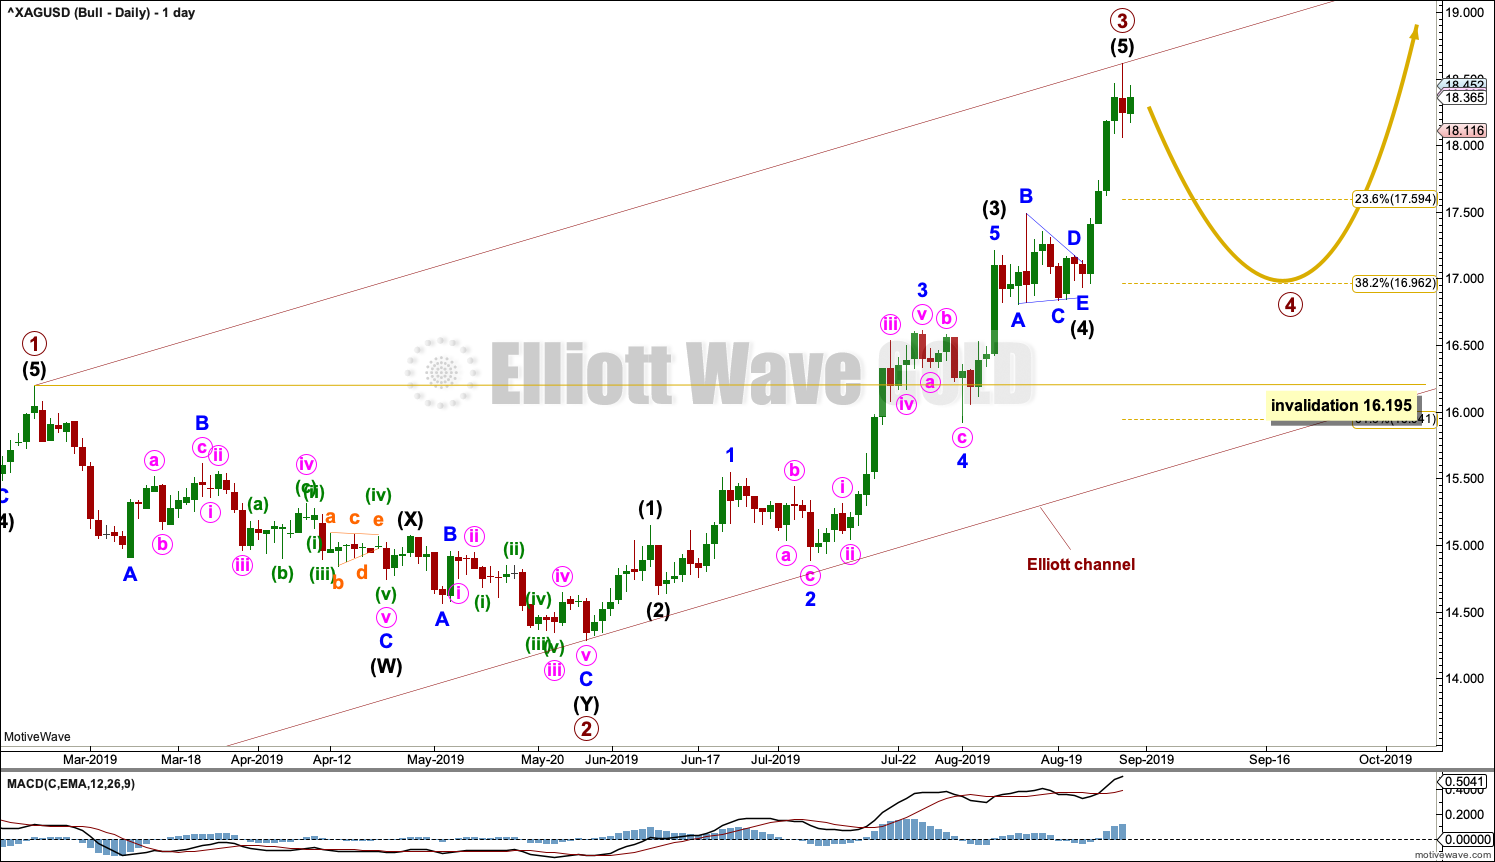
Both Elliott wave counts now expect a primary degree fourth wave to unfold. There is currently no divergence between the two wave counts at the daily chart level.
TECHNICAL ANALYSIS
WEEKLY CHART
Click chart to enlarge. Chart courtesy of StockCharts.com.
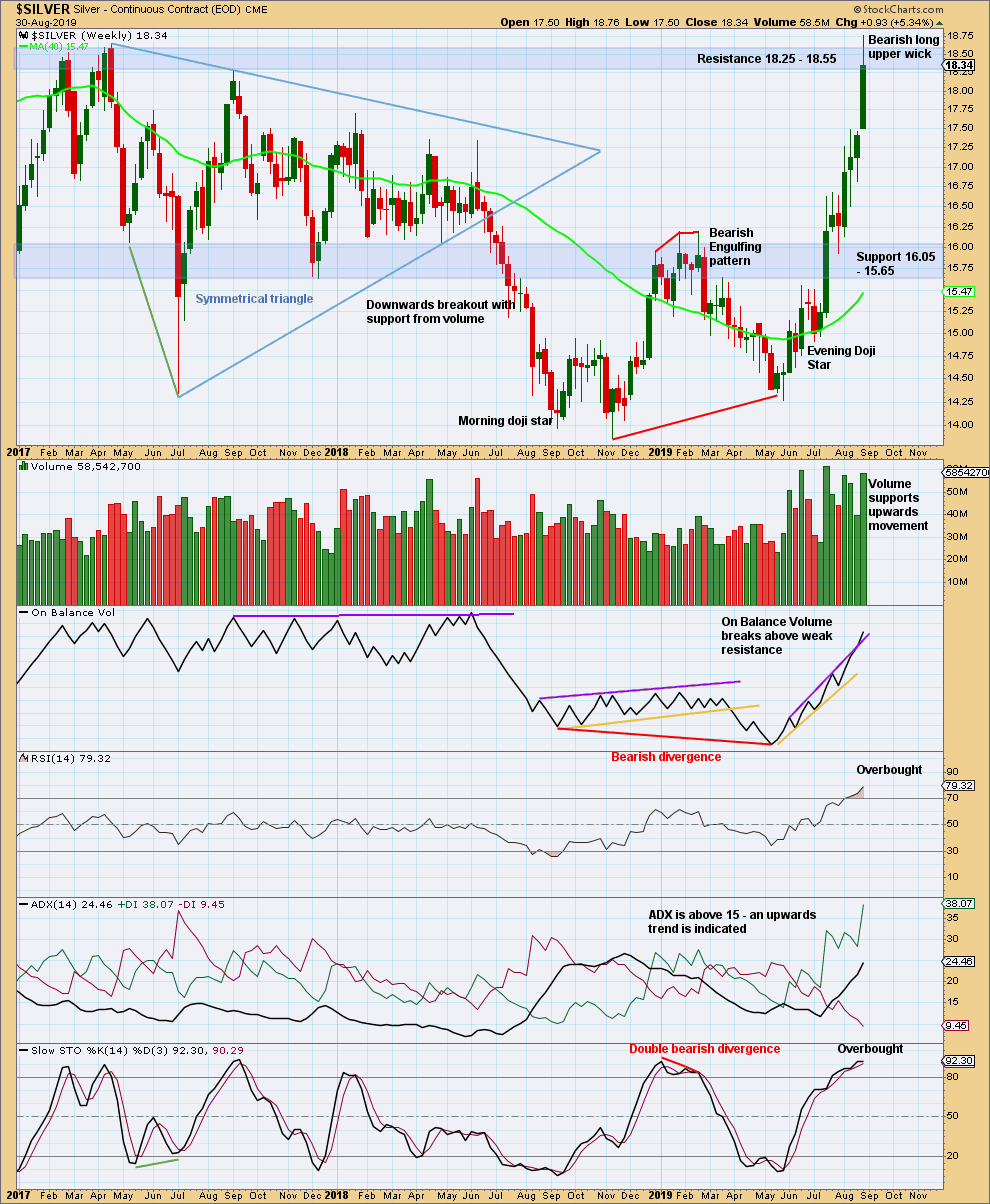
Price has now closed within the upper shaded blue zone of resistance. The long upper wick suggests downwards movement next week. Only a close above the blue zone would indicate more upwards movement for the short to mid term.
DAILY CHART
Click chart to enlarge. Chart courtesy of StockCharts.com.
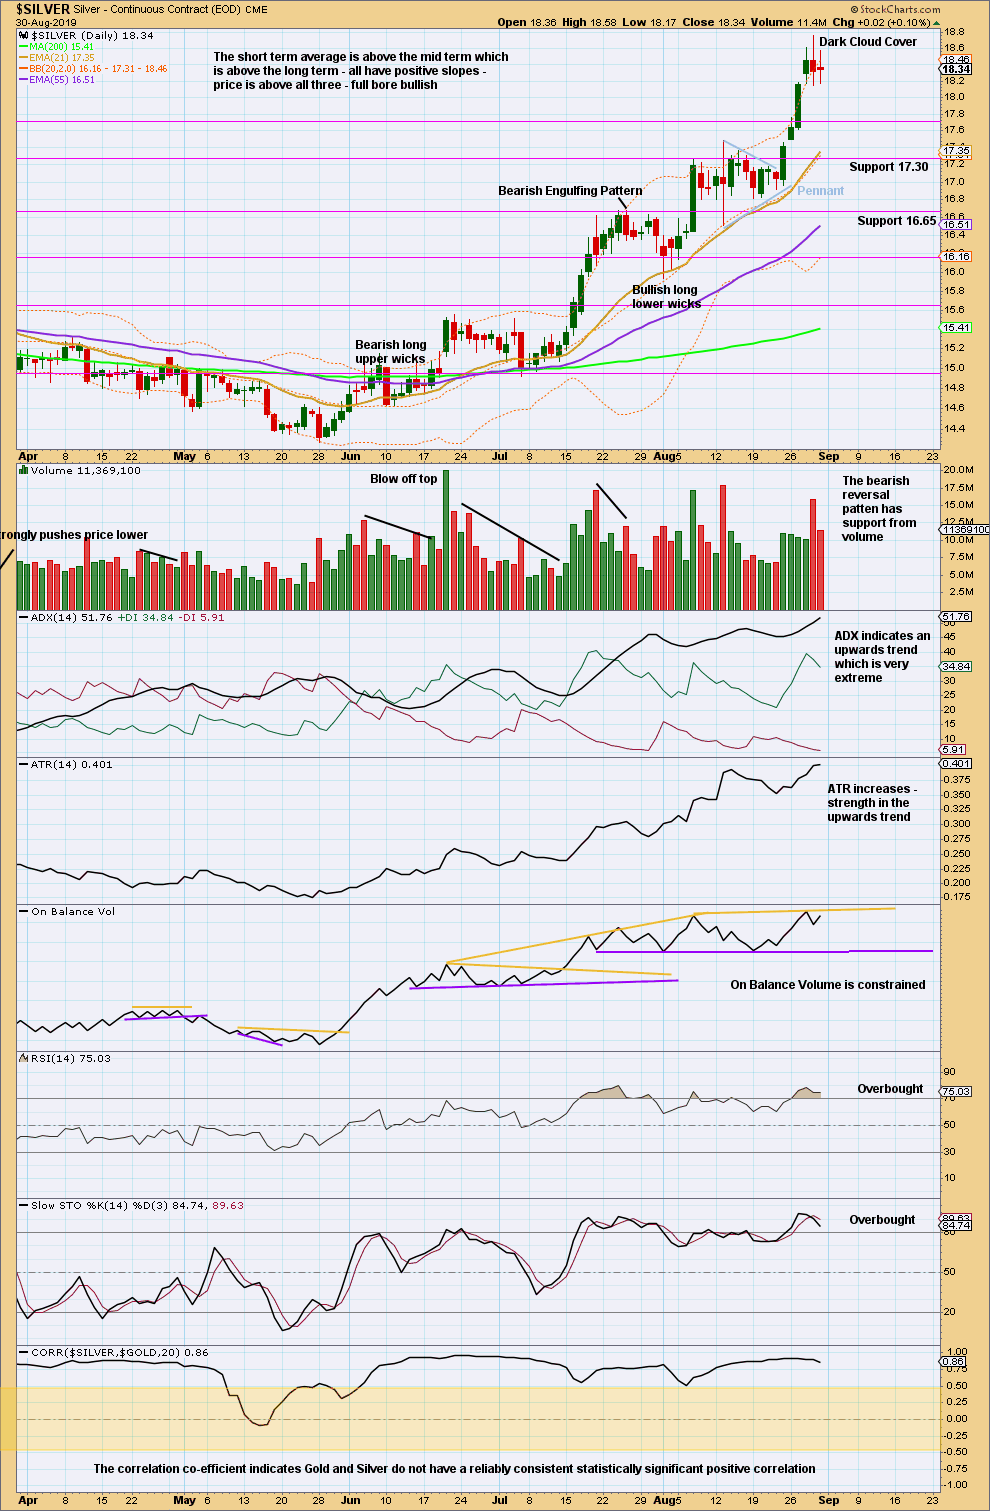
The target for the pennant was at 18.70. This has now been met and slightly exceeded, and a bearish candlestick reversal pattern now suggests either a trend change to down or another consolidation may have begun.
Published @ 02:27 a.m. EST on September 1, 2019.
—
Careful risk management protects your trading account(s).
Follow my two Golden Rules:
1. Always trade with stops.
2. Risk only 1-5% of equity on any one trade.
—
New updates to this analysis are in bold.
Considering we hit 19.5 this week and today was an obvious reversal candle, are you leaning more towards the bearish wave count for Silver? thank you Lara
Yes, I am.
The huge spike from Silver on the 4th looks like the end of primary 3.
This huge reversal looks like the start of primary 4.
With primary 3 ending higher, it’s not that far for primary 5 to go to take cycle c above cycle a eventually.
Silver and Gold don’t always turn together. I expect Gold may have its high, end of Super Cycle (b) already in, but Silver may have its high in coming months.
thank you very much for your reply. Have a great weekend!
Lara the Weekly reports are not loading, the links are not working,..Thanks for all you do.
Do you mean “Lara’s Weekly”? I can load that one and I notice one comment already underneath it from Rodney, so he’s seeing it…
Or do you mean this weekly analysis of Silver?
If something’s not working for you please could you email Cesar with the problem at webmaster@elliottwavegold.com and then he can fix it. He’ll need to know what browser and operating system you’re using.
Is anyone else having problems viewing analysis this week?
day one i did too, but working now
Thanks guys. Seems to be all good now.