
Upwards movement was expected to resume for this week, which is exactly what has happened.
Summary: Look out for the potential for a short-term pullback. Thereafter, the upwards trend may then resume towards a target at 21.375. This target may be met in about another 5 or 10 weeks.
ELLIOTT WAVE COUNTS
Last updated monthly charts may be found here.
BEARISH WAVE COUNT
WEEKLY CHART
Click chart to enlarge.
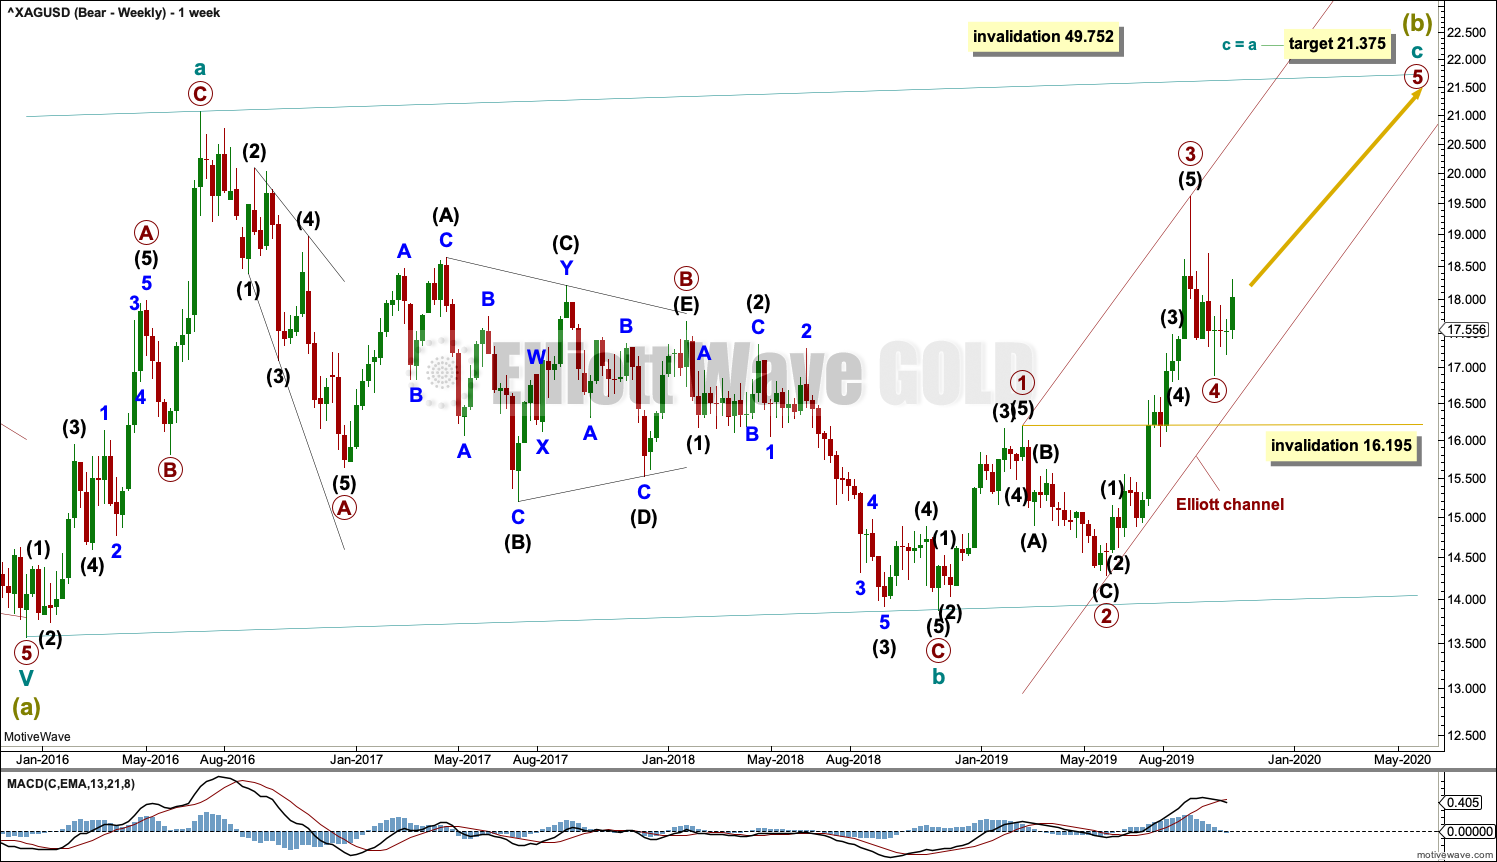
Super Cycle wave (b) may be an incomplete regular flat correction.
Within the regular flat correction, cycle wave a subdivides well as a zigzag and cycle wave b subdivides well as a zigzag, which is a 0.96 correction of cycle wave a.
Cycle wave c must complete as a five wave structure. Within cycle wave c, primary waves 1 through to 4 may be complete. If it continues any further, then primary wave 4 may not move into primary wave 1 price territory below 16.195.
Regular flat corrections often fit within parallel channels. Cycle wave c may end about resistance at the upper edge of the channel. The most common Fibonacci Ratio for cycle wave c within a regular flat would be equality in length with cycle wave a.
It would be extremely likely, for this wave count, for cycle wave c to move at least slightly above the end of cycle wave a at 21.062 to avoid a truncation.
Within cycle wave c, primary waves 1 and 3 both lasted 14 weeks, one longer than a Fibonacci 13. Primary wave 5 may be a little shorter in length. It may last a total Fibonacci 8 or 13 weeks.
I have looked for an Elliott wave count which sees Super Cycle wave (b) as complete but have been unable to find a solution that makes sense. My conclusion at this time is Silver needs to move higher, at least to 21.062, if this wave count is correct.
DAILY CHART
Click chart to enlarge.
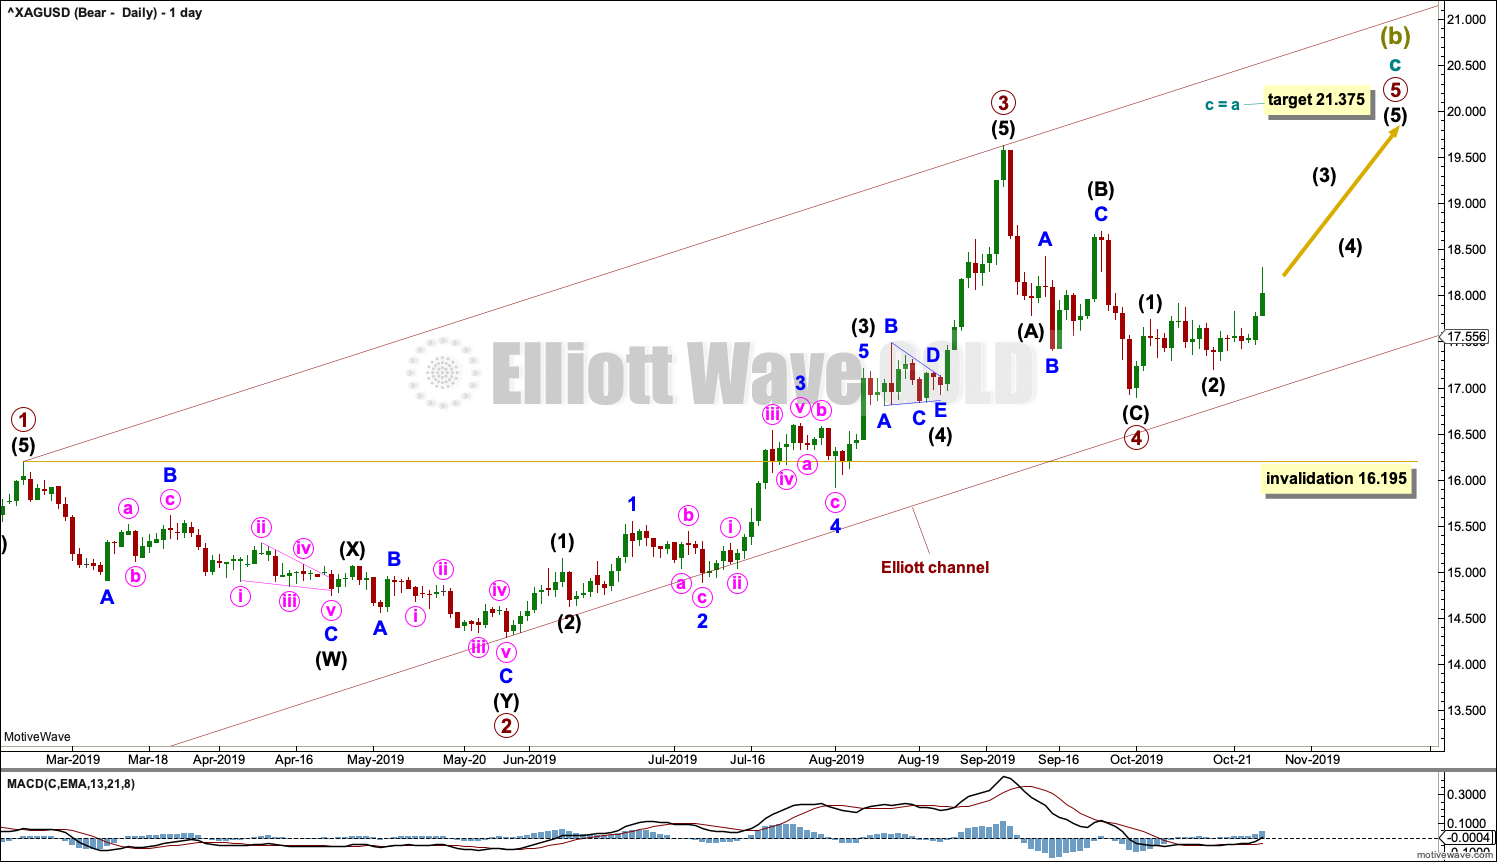
Cycle wave C may be subdividing as an impulse. Within the impulse, primary waves 1 to 4 may now be complete.
If it continues any further, then primary wave 4 may not move into primary wave 1 price territory below 16.195.
Primary wave 2 lasted 69 sessions and subdivided as a deep 0.82 double zigzag. If it is complete as labelled, then primary wave 4 may have exhibited some alternation as a single zigzag and more shallow at 0.51 of primary wave 3.
Primary wave 4 may be more brief than primary wave 2; fourth waves for Silver tend to be more brief than counterpart second waves.
Primary wave 5 must subdivide as a five wave structure.
BULLISH WAVE COUNT
WEEKLY CHART
Click chart to enlarge.
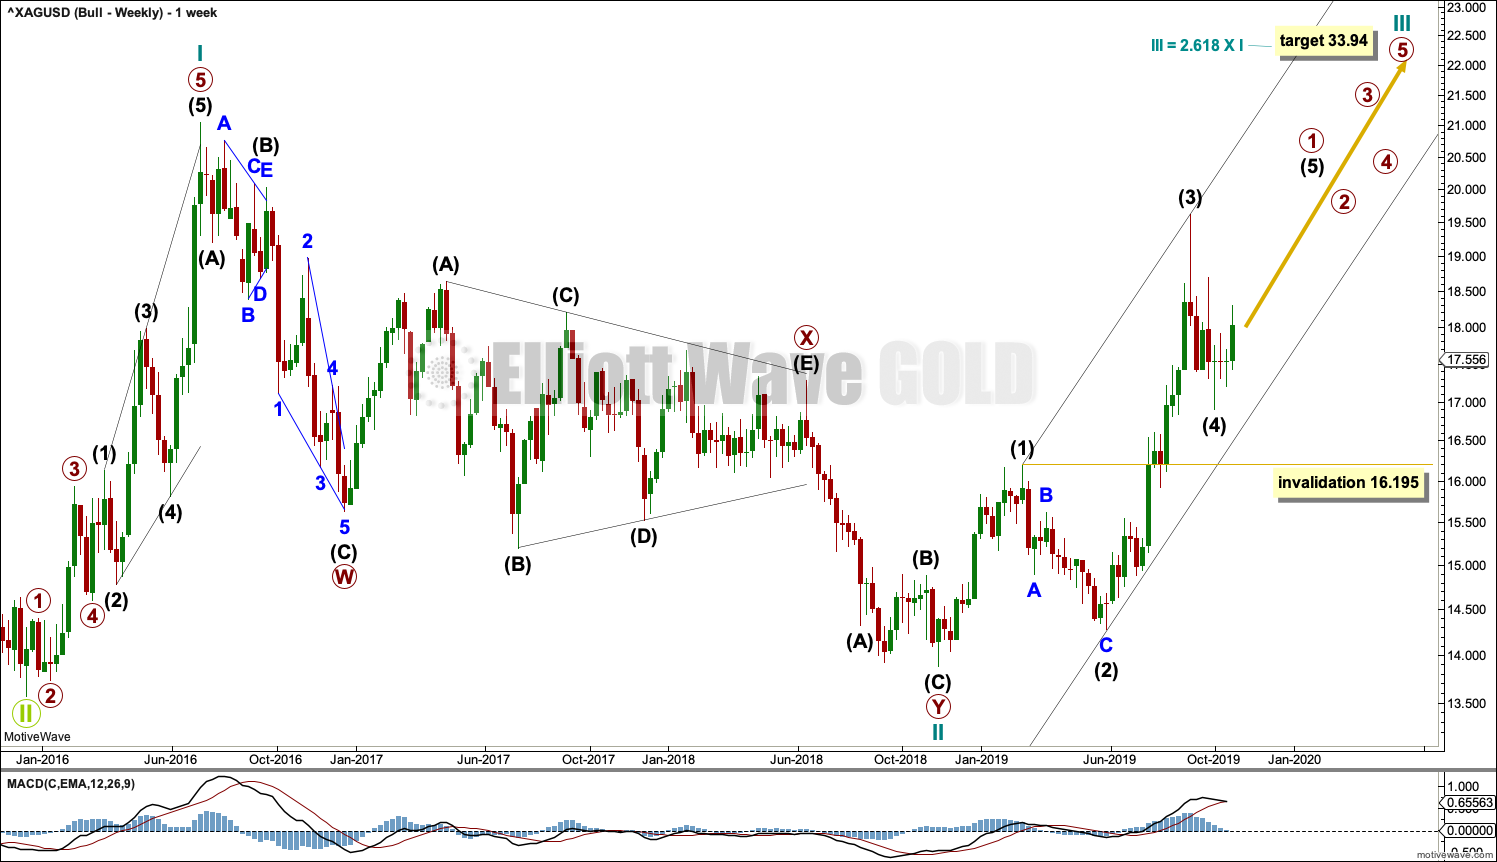
This bullish Elliott wave count sees a new bull market beginning for Silver at the low in December 2015.
A new bull market should begin with a five wave structure upwards. This is labelled cycle wave I.
Following five steps forward should be three steps back. This is labelled cycle wave II. The Elliott wave corrective structure of cycle wave II is labelled as a double zigzag, which is a fairly common structure.
Cycle wave III may only subdivide as an impulse. The degree of labelling within cycle wave III is this week moved down one degree considering how far away the target is. Within cycle wave III, only primary wave 1 may be unfolding. Within primary wave 1, intermediate wave (4) may not move into intermediate wave (1) price territory below 16.195.
Cycle wave III must move beyond the end of cycle wave I above 21.062. Cycle wave III must move far enough above this point to allow room for cycle wave IV to unfold and remain above cycle wave I price territory.
DAILY CHART
Click chart to enlarge.
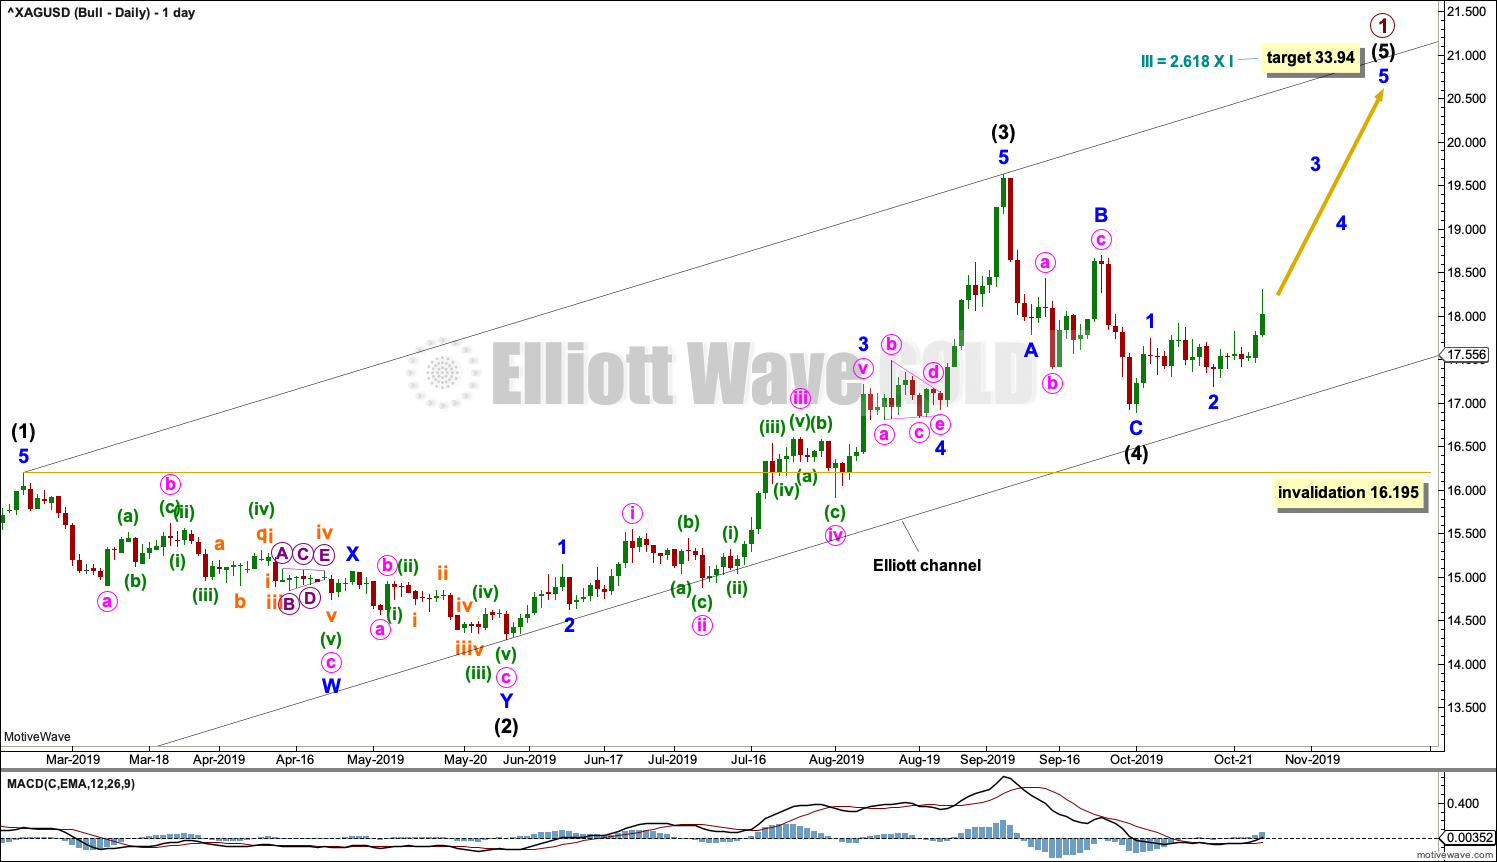
Both Elliott wave counts now expect a fourth wave has completed and a fifth wave has begun. At this stage, both bull and bear wave counts are the same for the short to mid term. The targets for the next upwards movement are different.
TECHNICAL ANALYSIS
WEEKLY CHART
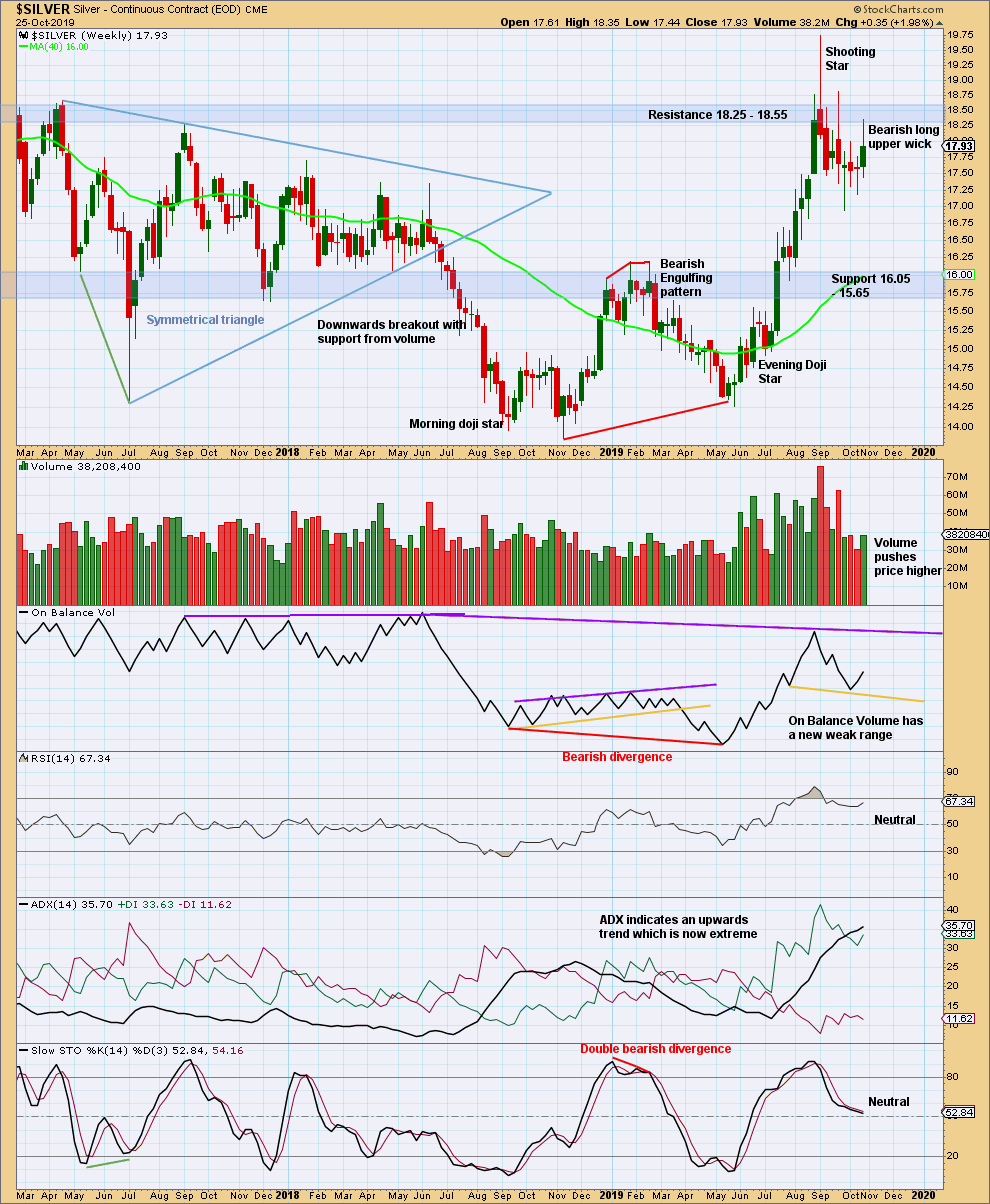
Click chart to enlarge. Chart courtesy of StockCharts.com.
Silver is back within a strong area of resistance and support, identified by blue shaded areas. Volume suggests more upwards movement next week, but the long upper wick suggests a small pullback may unfold first.
The upwards trend has reached extreme. Silver may have finished an upwards swing, or it may yet test resistance again. An upwards breakout has not yet occurred.
DAILY CHART
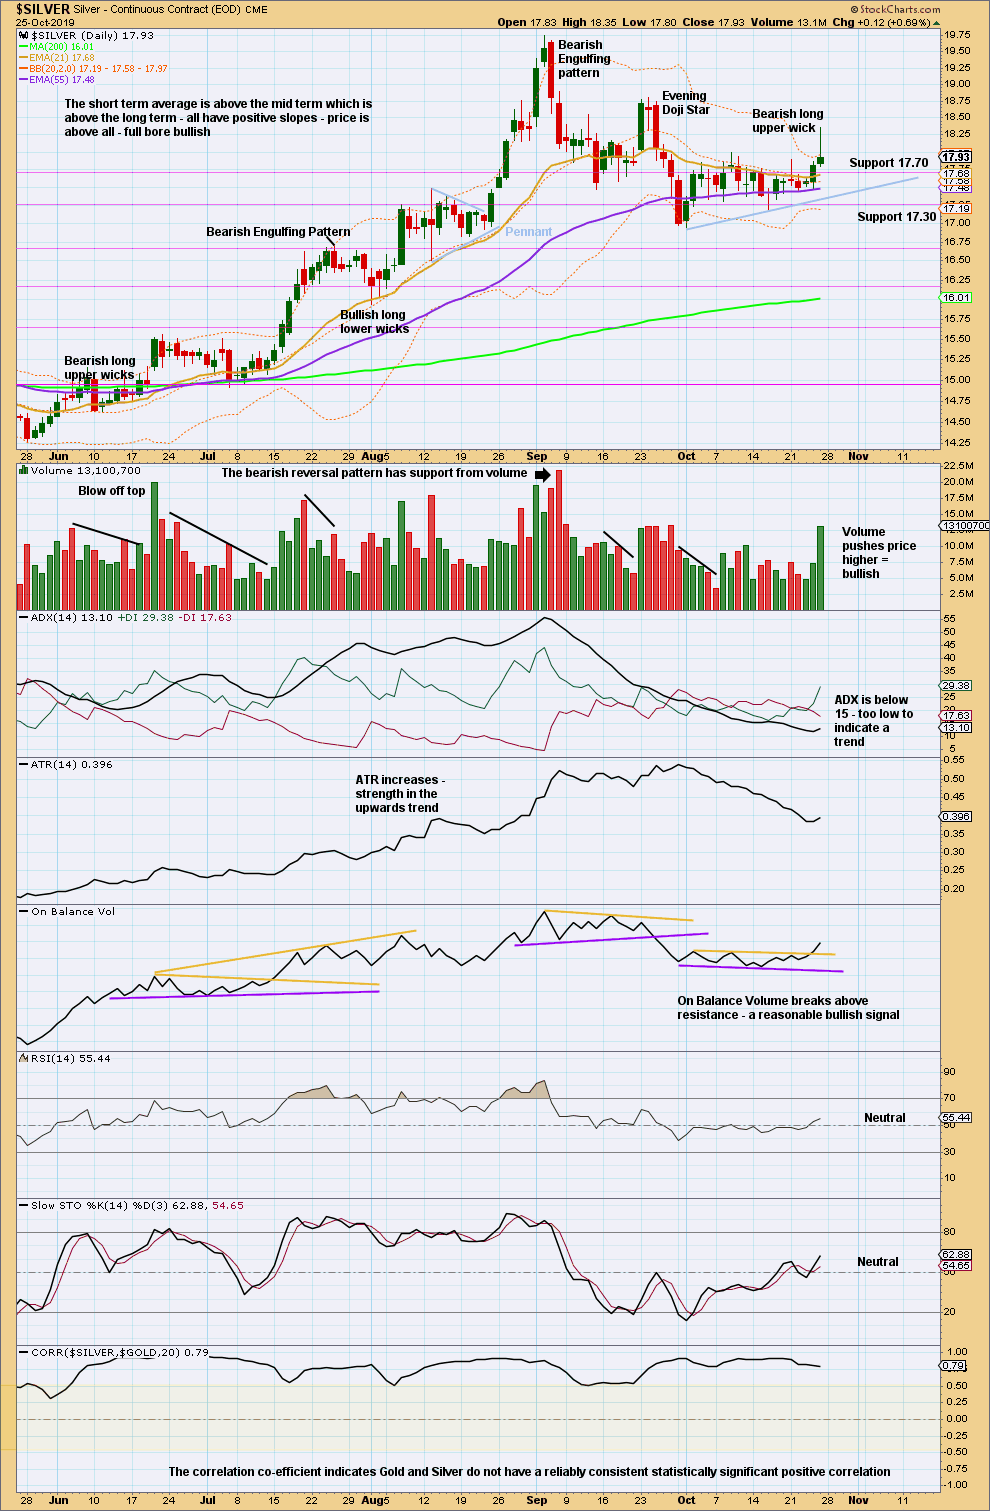
Click chart to enlarge. Chart courtesy of StockCharts.com.
The pennant pattern failed, so it is removed from the chart.
The short-term picture is contradictory. The long upper wick suggests a pullback next week, but volume and On Balance Volume suggest upwards movement.
Published @ 09:09 p.m. EST on October 26, 2019.
—
Careful risk management protects your trading account(s).
Follow my two Golden Rules:
1. Always trade with stops.
2. Risk only 1-5% of equity on any one trade.
—
New updates to this analysis are in bold.
I’m pretty much all-in long silver futures and options. Looking for min $21-$22 soon, then, if it keeps going, low 30s by early spring next year.
If it stalls in the low 20s and USD rebounds, then we may be in the bearish scenario.
Good luck, mate.
I’m long too … Working out if we are bull or bear will be the challenge (if we get to that point)
Quite fancy going long silver and flicking to short gold, if we are bearish