
GOLD: Elliott Wave and Technical Analysis | Charts – December 23, 2019
Last analysis expected for the very short term a very little upwards movement to find resistance at the upper edge of a channel. Price remains within the channel and On Balance Volume remains below resistance.
Summary: The downwards trend may resume to new lows. The Elliott wave target is at 1,348.
A target calculated from the triangle is about 1,437.
For the very short term, a new swing high above 1,514.29 would add some confidence in a more bullish outlook. The target would then be at 1,567, 1,635 or 1,693.
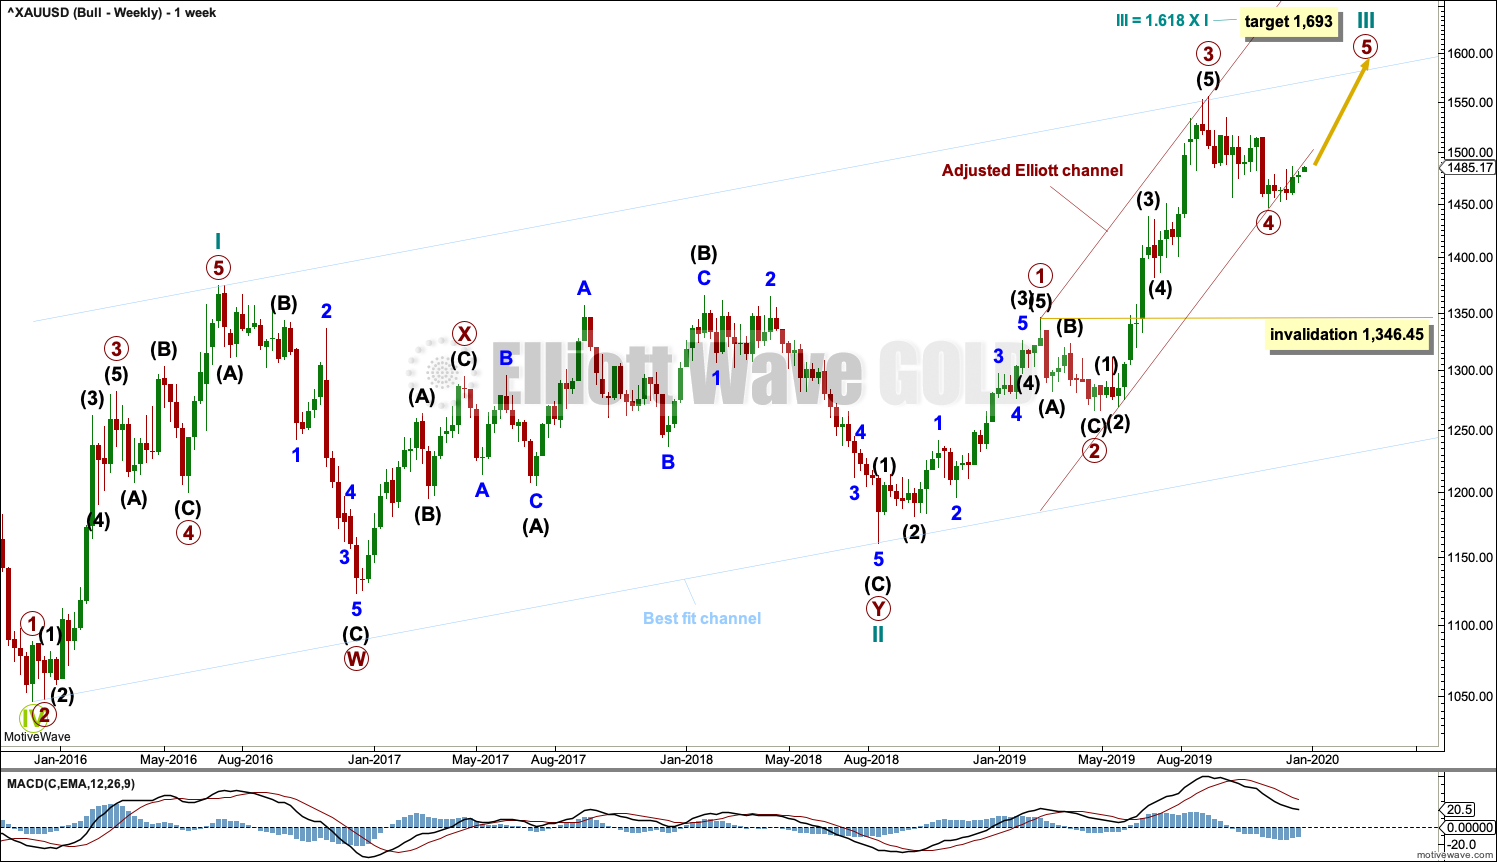
For the bigger picture, the bearish Elliott wave count expects a new downwards trend to last one to several years has begun. The alternate bearish wave count looks at the possibility that one final high to 1,559 is required first.
The bullish Elliott wave count expects a primary degree fourth wave has completed and the upwards trend has resumed.
Grand SuperCycle analysis is here.
Monthly charts were last updated here.
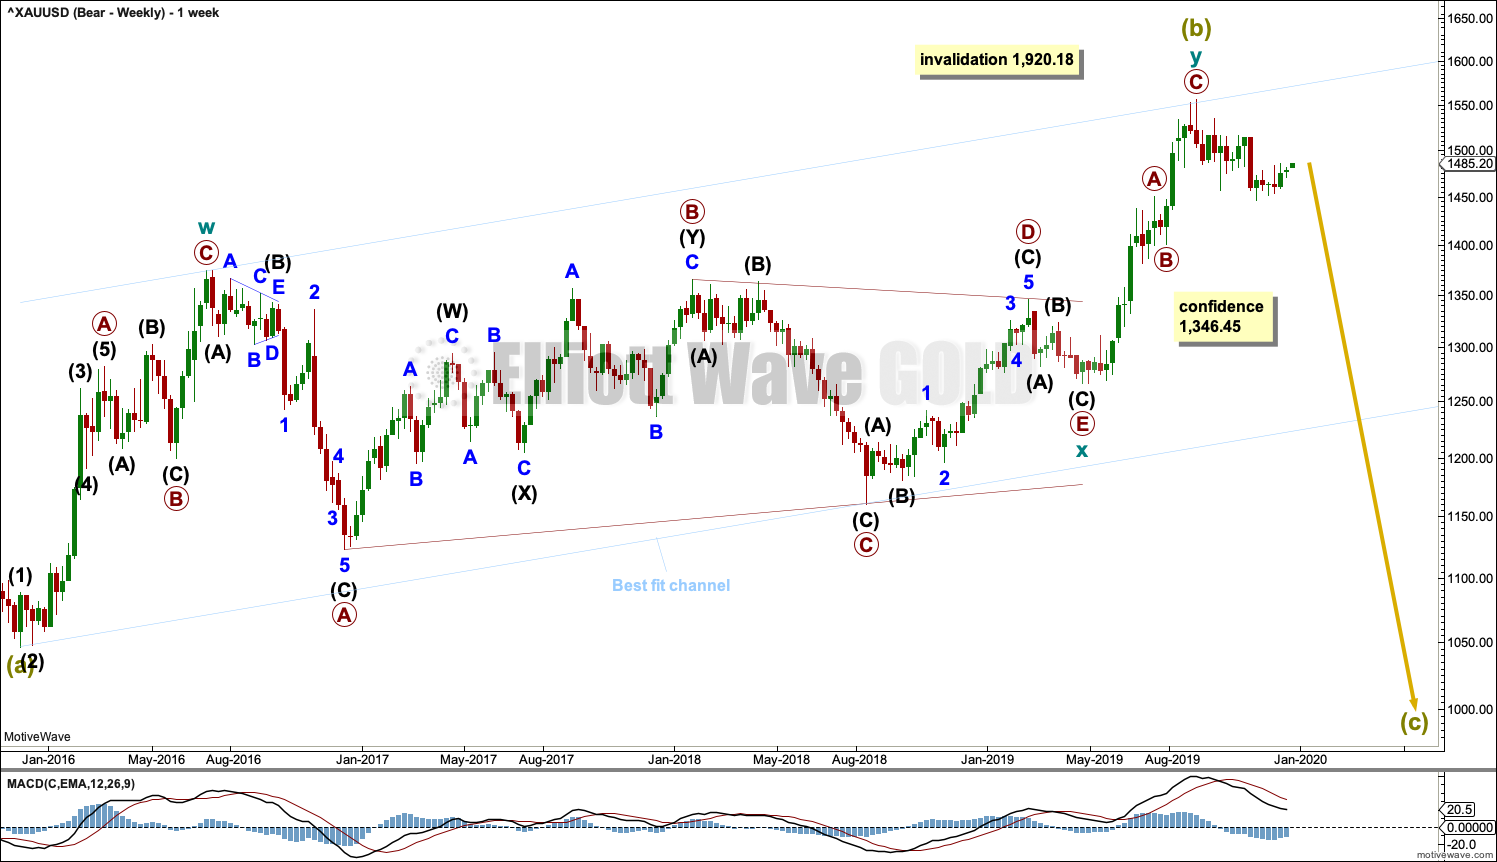
BEARISH ELLIOTT WAVE COUNT
WEEKLY CHART
Click chart to enlarge.
It is possible that Super Cycle wave (b) is complete as a double zigzag.
The first zigzag in the double is labelled cycle wave w. The double is joined by a three in the opposite direction, a triangle labelled cycle wave x. The second zigzag in the double is labelled cycle wave y.
The purpose of the second zigzag in a double is to deepen the correction. Cycle wave y has achieved this purpose.
A new low below 1,346.45 would add strong confidence to this wave count. At that stage, the bullish Elliott wave count would be invalidated. At that stage, targets for Super Cycle wave (c) would be calculated.
A wide best fit channel is added in light blue. This channel contains all of Super Cycle wave (b) and may provide resistance and support. Copy this channel over to daily charts. Along the way down, the lower edge of the channel may provide support and in turn initiate a bounce.
Super Cycle wave (c) must subdivide as a five wave structure, most likely an impulse. It may last several years. It would be very likely to make new lows below the end of Super Cycle wave (a) at 1,046.27 to avoid a truncation.
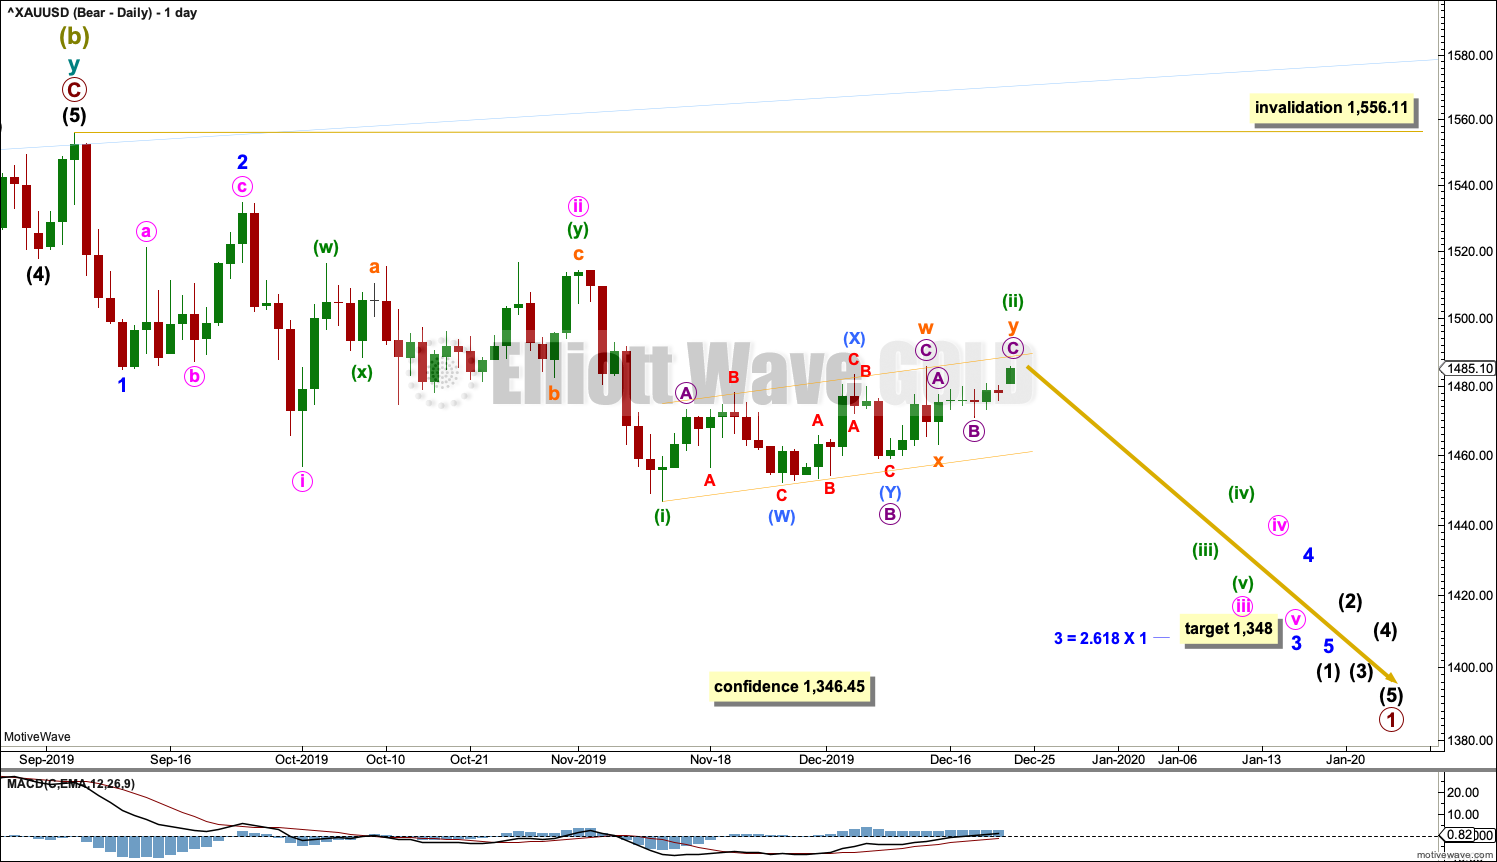
DAILY CHART
Click chart to enlarge.
Classic analysis now reasonably supports this wave count.
Cycle wave y may be a complete zigzag. Within both of primary waves A and C, there is good proportion between intermediate waves (2) and (4). Within both of primary waves A and C, there is good alternation in structure of intermediate waves (2) and (4).
Within cycle wave y, there is no Fibonacci Ratio between primary waves A and C.
If there has been a trend change at Super Cycle degree, then a five down needs to develop on the daily and weekly charts. So far that is incomplete. It will be labelled intermediate wave (1).
Typically, Gold begins new trends slowly with overlapping first and second waves, and then momentum builds through the middle of the third wave and may explode at the end of third waves. So far this overlapping movement from the last high in September looks typical for this market.
Draw a best fit channel about minuette wave (ii) to contain all of this bounce. When this channel is breached by downwards movement, then that shall provide indication that a third wave down is underway. Expect any bounces to find resistance at the upper edge while price remains within the channel.
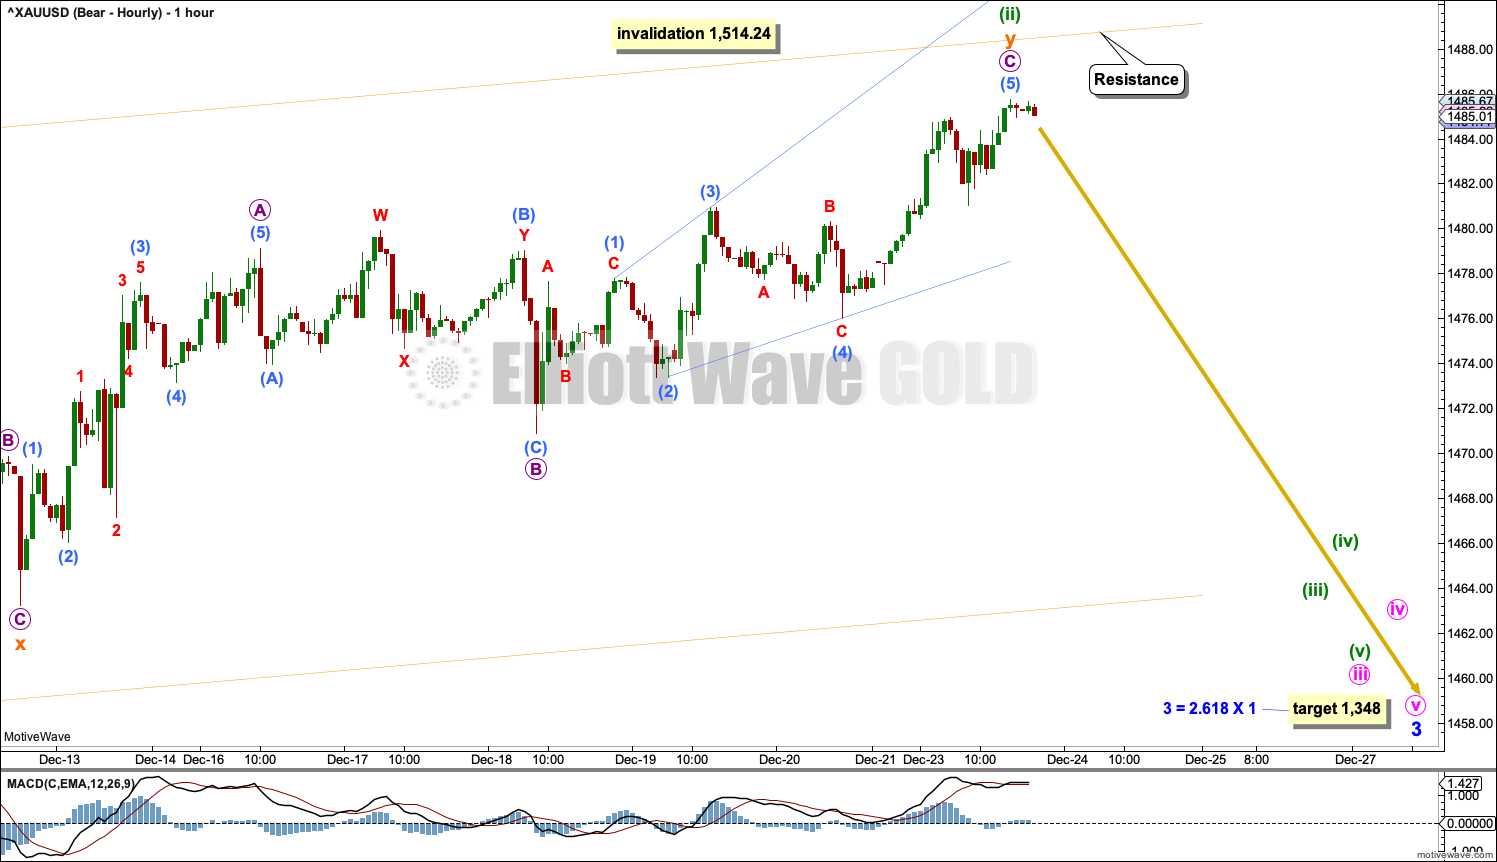
HOURLY CHART
Click chart to enlarge.
This hourly chart begins at the low labelled subminuette wave x, which may be seen on the daily chart. The short-term structure for minuette wave (ii) is labelled as an incomplete double zigzag.
The second zigzag in the double is labelled subminuette wave y. Subminuette wave y now be a complete structure. Within subminuette wave y, micro wave C is now an ending expanding diagonal that meets all rules. If sub-micro wave (5) of the diagonal continues any higher, it may find strong resistance at the orange channel.
When the narrow orange channel about minuette wave (ii) is breached by downwards movement, that may be taken as an indication that a third wave at multiple degrees has begun. Expect downwards momentum to then increase. On the way down, look for a possible bounce at the lower edge of the channel. If price slices through the channel without a bounce, look for the possibility of a throwback (which may be brief) to test resistance.
The invalidation point will remain the same while price remains within the channel.
Minuette wave (ii) may not move beyond the start of minuette wave (i) above 1,514.24.
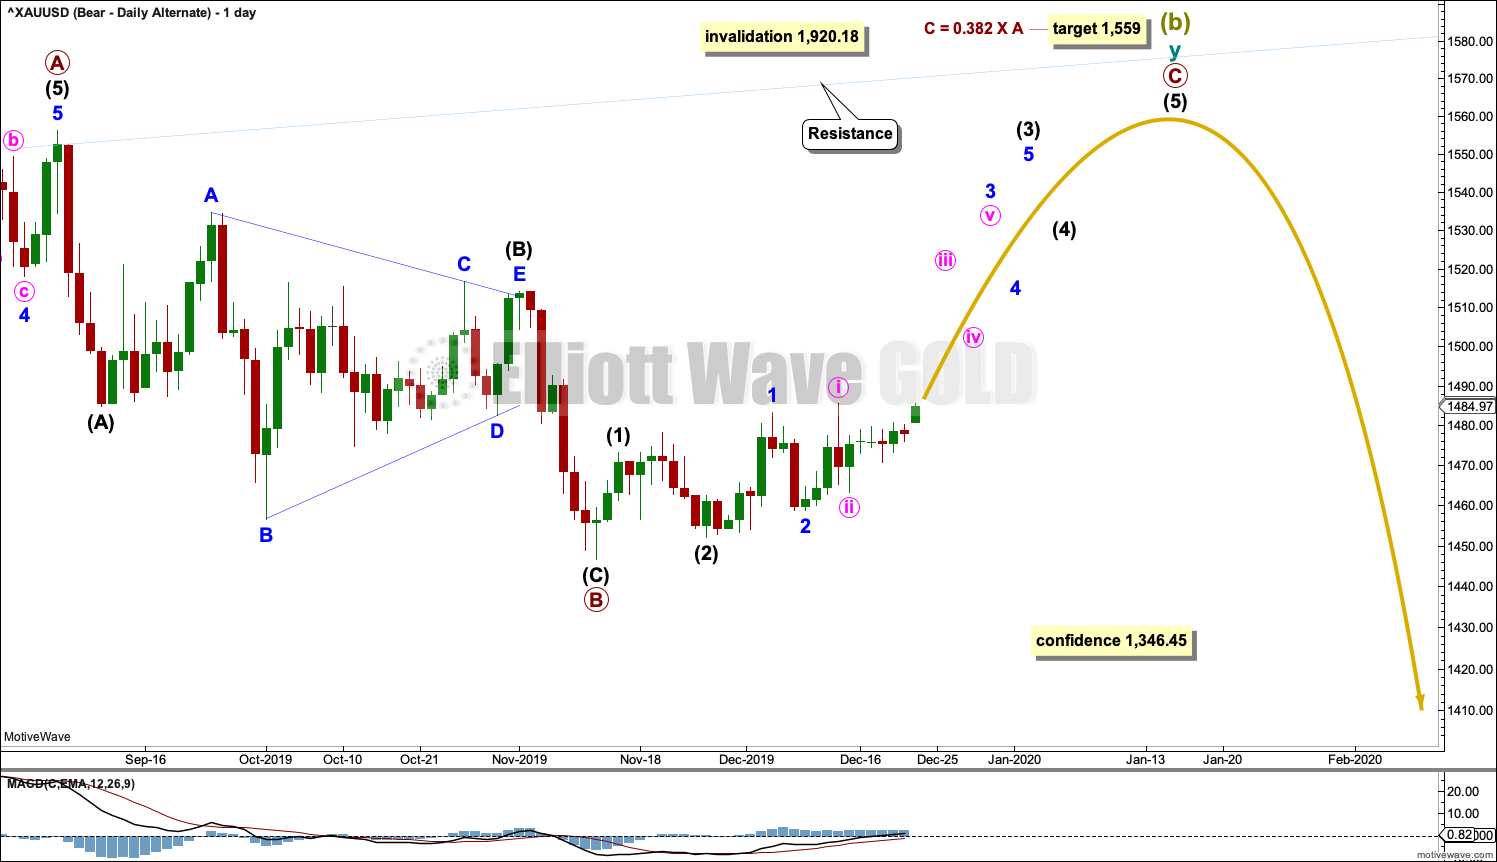
ALTERNATE DAILY CHART
Click chart to enlarge.
It is possible that the double zigzag for Super Cycle wave (b) may be incomplete and may yet require one more high.
Within cycle wave y, primary wave A may have been over at the last high.
Primary wave B may be complete as a single zigzag. Within the zigzag, intermediate wave (C) is just 3.56 short of equality in length with intermediate wave (A). Intermediate wave (B) is a running contracting triangle.
It is possible for this wave count that primary wave B could continue lower as a double zigzag. Primary wave B may not move beyond the start of primary wave A below 1,266.61.
A new low now below 1,446.68 would see primary wave B relabelled as a double zigzag, continuing lower.
Primary wave C would be expected to find strong resistance and end at the upper edge of the blue best fit channel copied over from the weekly chart.
BULLISH ELLIOTT WAVE COUNT
WEEKLY CHART
Click chart to enlarge.
This wave count sees the the bear market complete at the last major low for Gold in November 2015.
If Gold is in a new bull market, then it should begin with a five wave structure upwards on the weekly chart. However, the biggest problem with this wave count is the structure labelled cycle wave I because this wave count must see it as a five wave structure, but it looks more like a three wave structure.
Commodities often exhibit swift strong fifth waves that force the fourth wave corrections coming just prior and just after to be more brief and shallow than their counterpart second waves. It is unusual for a commodity to exhibit a quick second wave and a more time consuming fourth wave, and this is how cycle wave I is labelled. This wave count still suffers from this very substantial problem, which is one reason why the bearish wave count is preferred because it has a better fit in terms of Elliott wave structure.
Cycle wave II subdivides well as a double combination: zigzag – X – expanded flat.
Cycle wave III may have begun. Within cycle wave III, primary waves 1 and 2 may now be complete. Primary wave 3 has now moved above the end of primary wave 1 meeting a core Elliott wave rule. It has now moved far enough to allow room for primary wave 4 to unfold and remain above primary wave 1 price territory. Primary wave 4 may not move into primary wave 1 price territory below 1,346.45.
Cycle wave III so far for this wave count would have been underway now for 71 weeks. It exhibits some support from volume and increasing ATR. This wave count has some support from classic technical analysis.
The channel drawn about cycle wave III is an adjusted Elliott channel. The lower edge is pulled lower.
Add the wide best fit channel to weekly and daily charts.
DAILY CHART
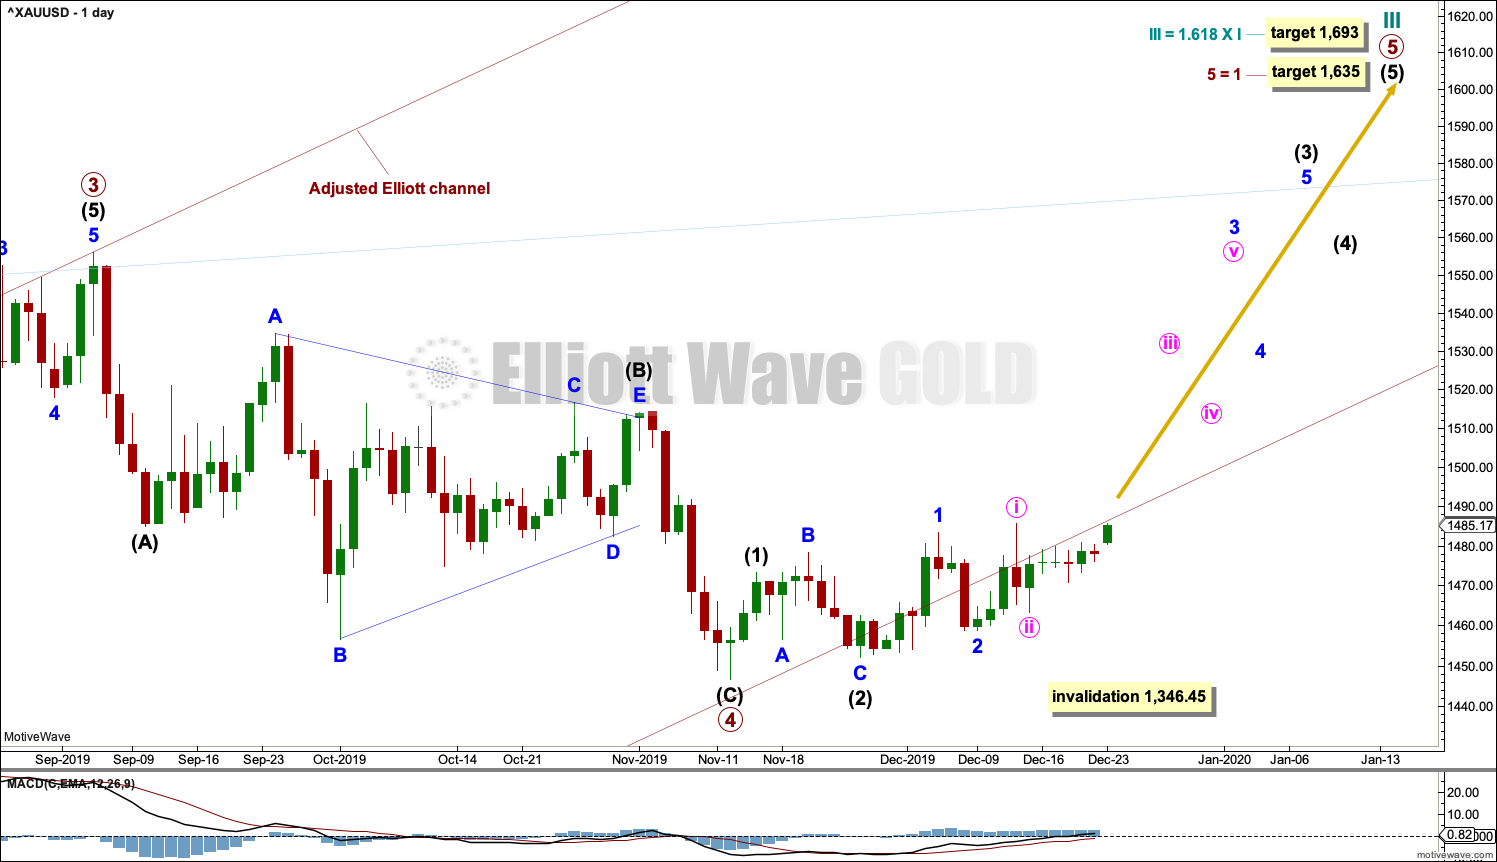
Click chart to enlarge.
Primary wave 4 may be complete as a single zigzag. Primary wave 4 may have lasted 49 sessions, just six more than primary wave 2, which lasted 43 sessions. The proportion remains very good for this part of the wave count.
A target for cycle wave III is calculated also now at primary degree. If price reaches the first target and keeps rising, then the second higher target may be used.
If it continues any further, then primary wave 4 may not move into primary wave 1 price territory below 1,346.45.
If primary wave 4 is a single zigzag, then there is no alternation in structure with the single zigzag of primary wave 2. There is some alternation within the structures: primary wave 2 as a zigzag has intermediate wave (B) as a zigzag, while intermediate wave (B) within the zigzag of primary wave 4 is a triangle. Primary wave 2 is shallow at 0.43 the length of primary wave 1, and primary wave 4 is close to the same at 0.38 the length of primary wave 3. There is inadequate alternation in depth.
HOURLY CHART
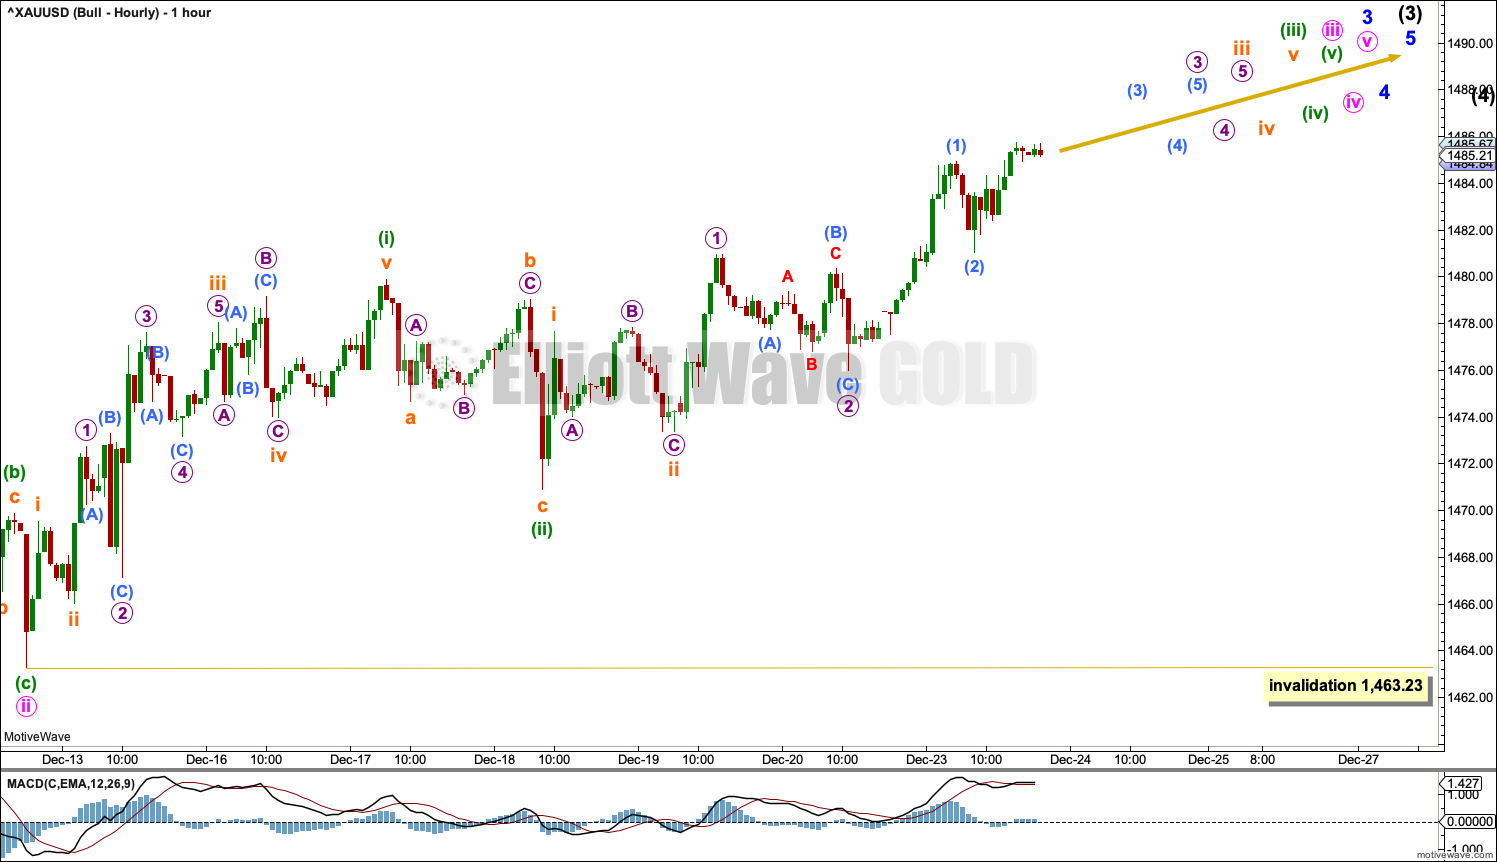
Click chart to enlarge.
This hourly chart now focuses on movement from the end movement from the low of minute wave ii, which is now labelled on the daily chart.
Within intermediate wave (1) of primary wave 5, there may now be seven completed overlapping first and second waves. This wave count expects an upwards breakout when the middle of a third wave arrives, which should have support from volume and should exhibit increased momentum.
Minuette wave (ii) may not move beyond the start of minuette wave (i) below 1,463.23.
TECHNICAL ANALYSIS
WEEKLY CHART
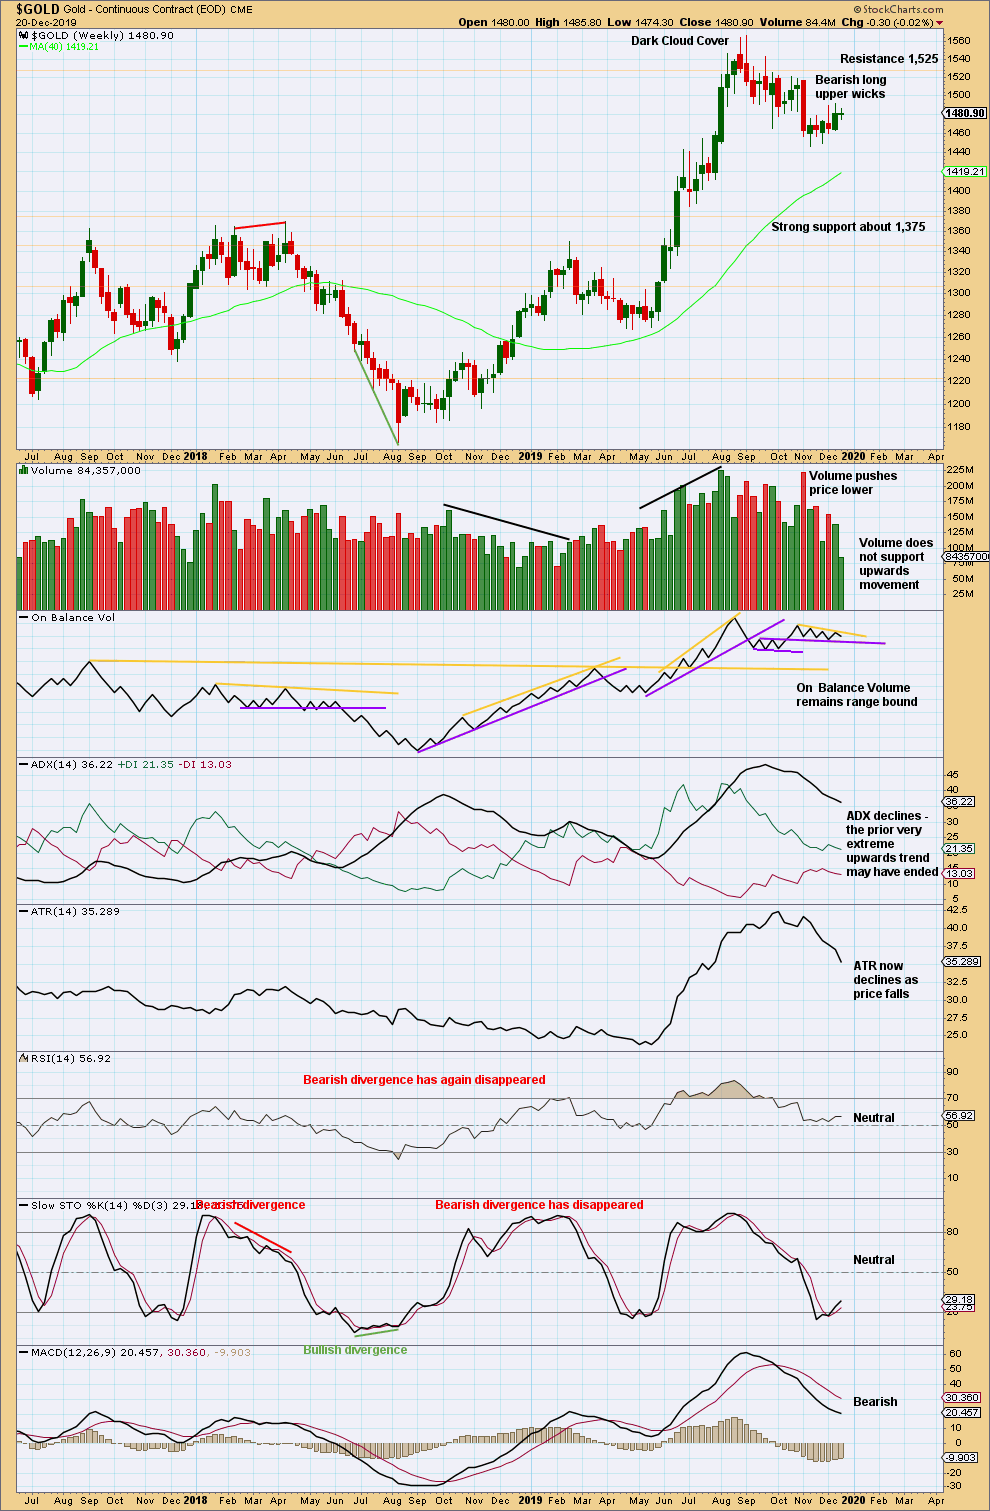
Click chart to enlarge. Chart courtesy of StockCharts.com.
When trends reach very extreme, candlestick reversal patterns should be given weight. The Dark Cloud Cover bearish reversal pattern is given more bearish weight from the long upper wick.
A very strong downwards week with strong support from volume seven weeks ago supports a bearish view.
Since the high in early September, volume offers more support to downwards movement than upwards. The last six weeks of choppy overlapping upwards movement are unconvincing as a new trend and look more like a counter trend movement.
DAILY CHART
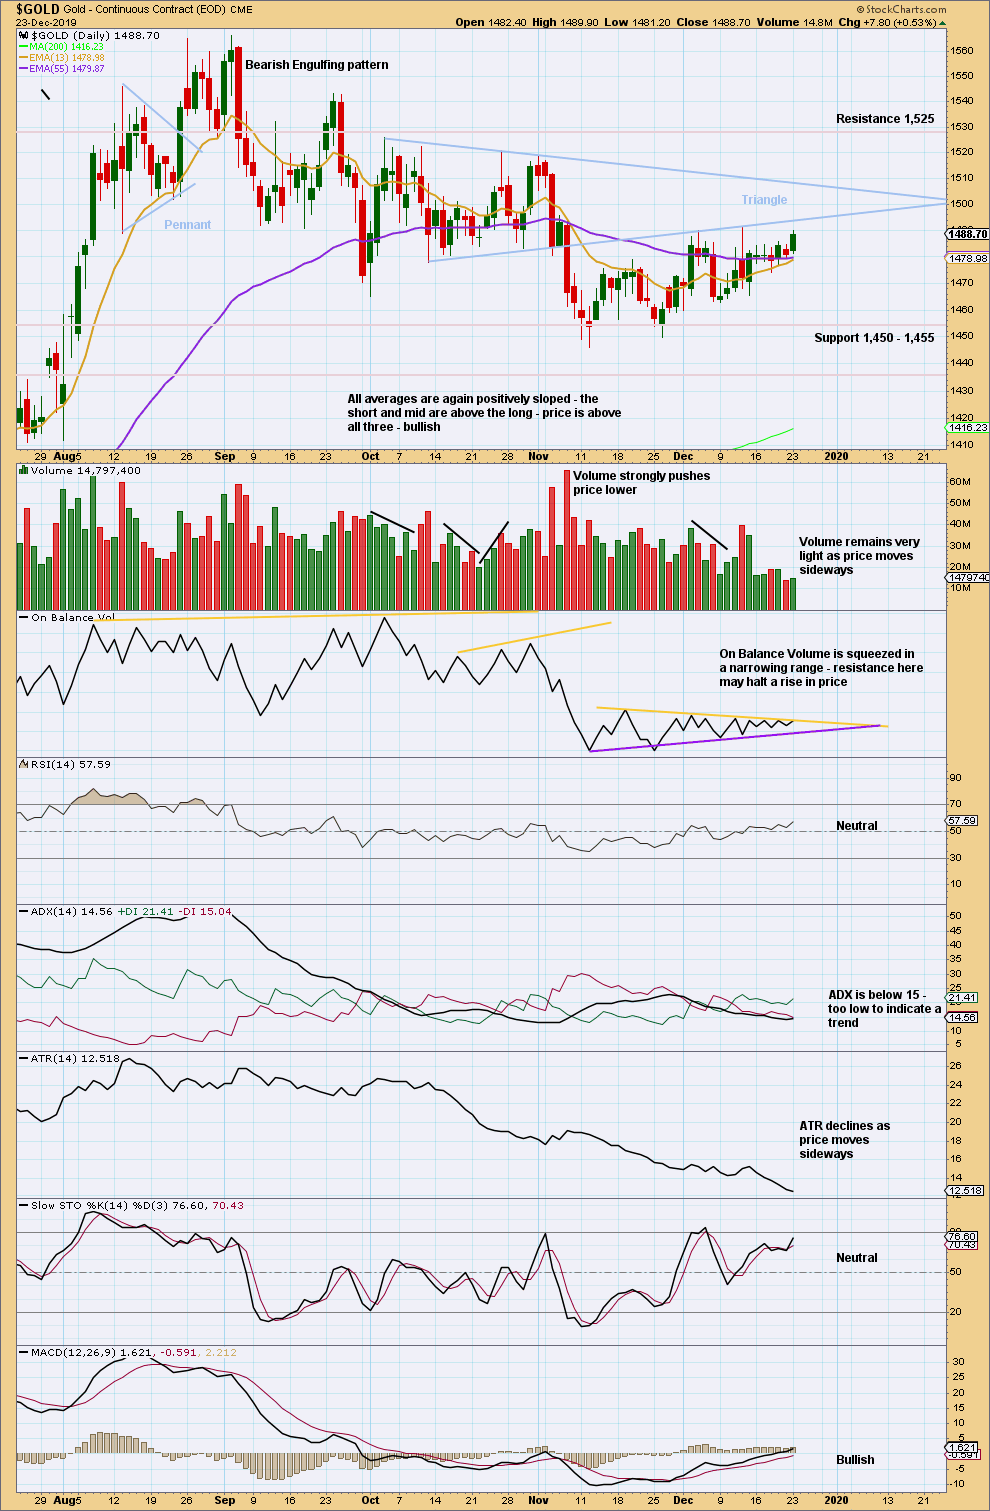
Click chart to enlarge. Chart courtesy of StockCharts.com.
Since the last high on the 4th of September, there is now a series of three swing lows and swing highs.
The lower triangle trend line is today adjusted to better show where recent highs have found resistance. This makes a difference to the target calculation. After a breakout from the triangle, the target is to be about 1,437.
The downwards breakout from the triangle had strong support from volume pushing price lower, so confidence may be had in the breakout. Now three back tests of resistance at the lower triangle trend line have completed; resistance has successfully held there.
Price has been moving higher since the 12th of November making a series of short-term highs, but On Balance Volume has not been making corresponding short-term highs. This upwards movement looks weak in terms of On Balance Volume, volume and range. This still looks like a counter trend movement.
On Balance Volume is again at resistance.
GDX WEEKLY CHART
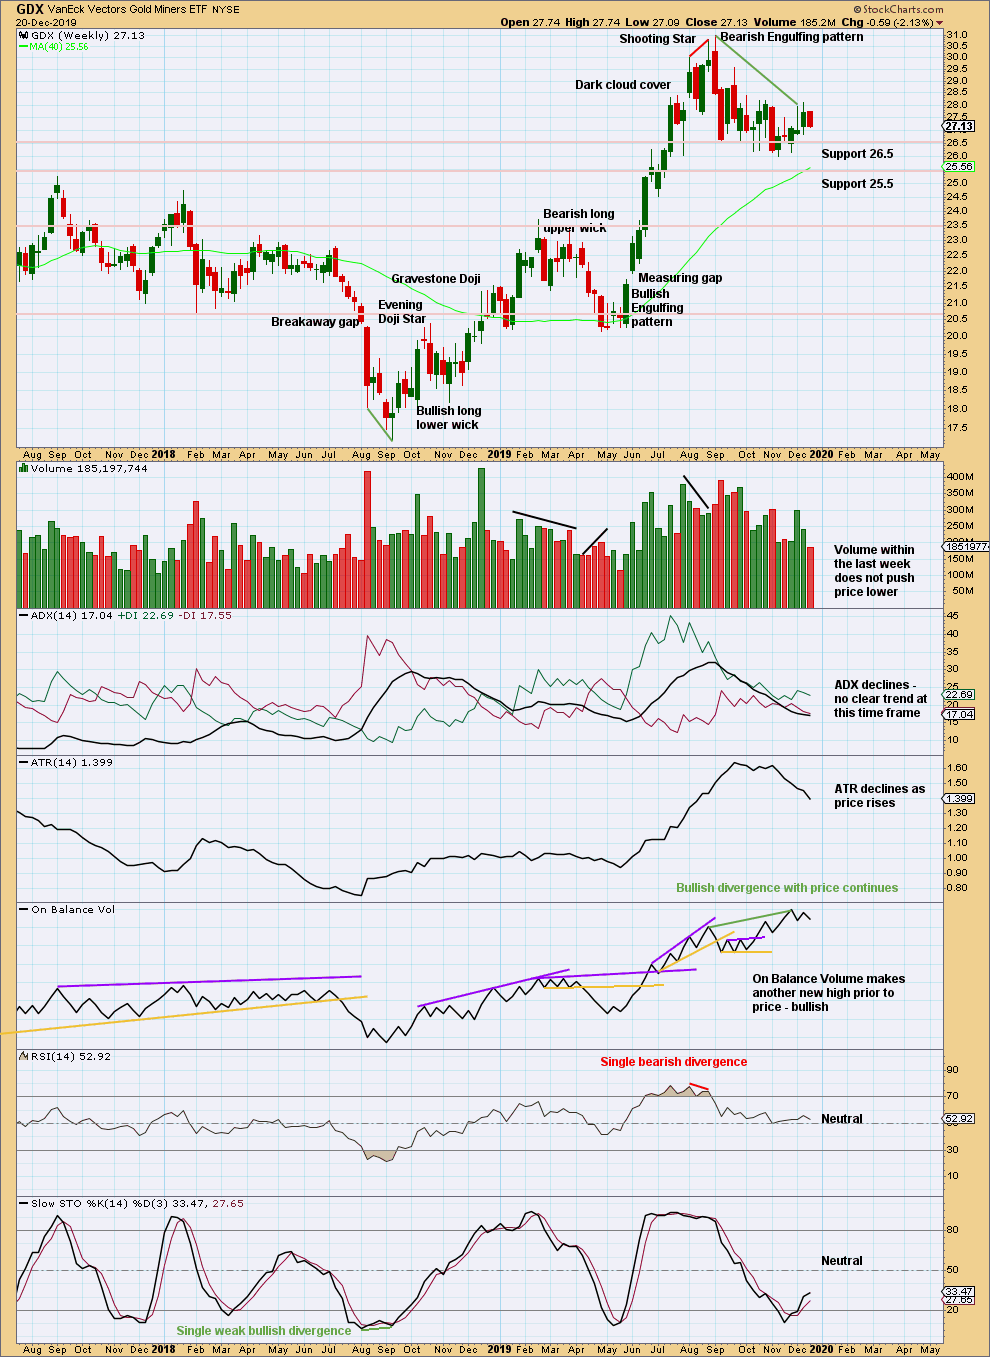
Click chart to enlarge. Chart courtesy of StockCharts.com.
GDX, like Gold, often begins a new trend slowly with overlapping and flat or declining ATR. From the last major high at 30.96 a few weeks ago, there has been a strong Bearish Engulfing pattern and strong downwards weeks with greater range and volume than upwards weeks. GDX may have had a trend change. However, bullish divergence between price and On Balance Volume is strong and persistent; it contradicts the view of a trend change.
The short term after last week is inconclusive. Volume has not pushed price lower.
GDX DAILY CHART
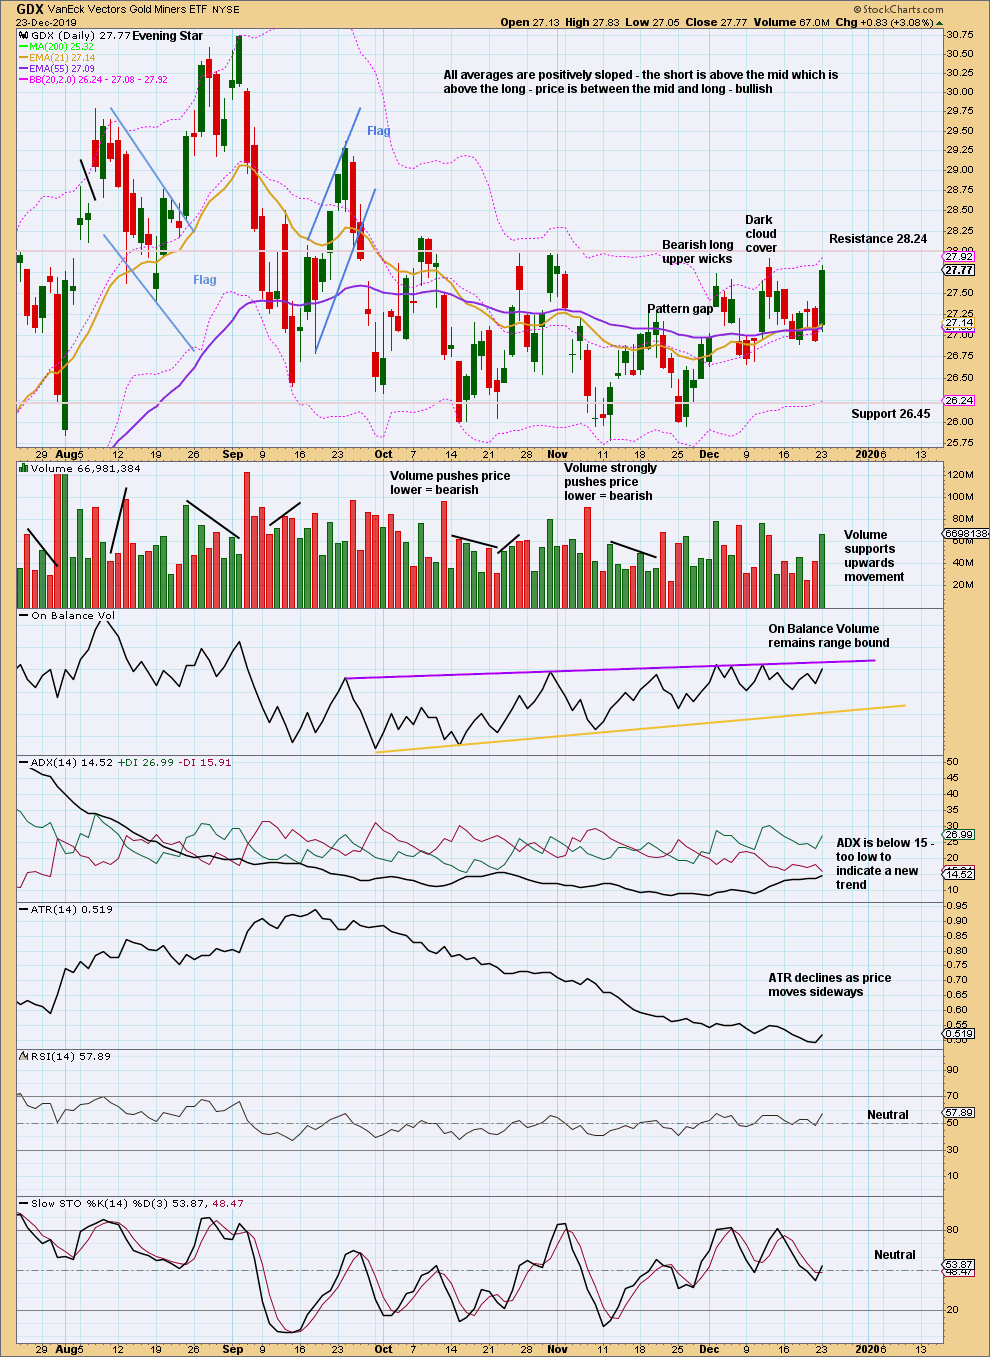
Click chart to enlarge. Chart courtesy of StockCharts.com.
GDX has made a new swing low. There is now a series of four lower swing highs and four lower swing lows from the high on the 4th of September. It looks like GDX may have had a trend change. This view should remain dominant while the last swing high at 28.18 on the 31st of October remains intact.
Published @ 08:39 p.m. EST.
—
Careful risk management protects your trading account(s).
Follow my two Golden Rules:
1. Always trade with stops.
2. Risk only 1-5% of equity on any one trade.
—
New updates to this analysis are in bold.
This will now be the main wave count.
First target 1,559. If this target is wrong it may not be quite high enough. Expect strong resistance again at the upper edge of the big blue channel
The old ‘preferred’ count is still alive though, just not preferred ?
Correct. This upwards move began with weakness, but there is now enough strength in it to expect it may continue further.
Overall the count is still bearish, but now one final high expected.
There are a few things that concern me about the bull argument
1. Commercials keep shorting on the way up. They have shown they have deep pockets and when price turns against them by moving up they will increase their short position
2. Gold and silver outside upper Bollinger bands
3. Rsi, stochastics getting overbought
4. Gold and silver have been up this year so little reason to sell right now. When the new year comes might have traders lock in on their profit and sell. They don’t want to do that right now because they will have to pay taxes on gains. Waiting to next year will allow them to wait until April 2021 to pay taxes on gains.
Decided to jump in on the pull back. Hoping to see silver push through to the 20.00 range.
Silver and gold starting a corrective move. Might be an entry opportunity coming.
Any short term targets for the bullish move up?
1,522 for intermediate (3) to reach 2.618 X intermediate (1)
Gold chats been looking so bullish , it’s taken its time to build but I’m in good profit now. 👍
Looks like an upwards breakout is in play. Lara will likely be changing the alternate daily to the main.
Gold, Silver, and GDX have clearly broken their down trendlines
yes, I will have to switch the alternate bear daily chart to the main now
This strong upwards move also comes with a strong bullish signal from On Balance Volume
The main count in silver just invalidated on zag-usd (Barchart). Looks like new highs are I likely. Merry Christmas Everyone!
I have the high for 24th December at 17.617, and the invalidation point at 18.306.
You are correct, silver just did what it should not do. Perhaps Santa will put rocks in it’s socks. Merry Christmas Lara!
Also, a very Merry Christmas to you too Andrew