
GOLD: Elliott Wave and Technical Analysis | Charts – December 27, 2019
Last analysis expected more upwards movement, which is how the week has ended.
Summary: The main wave count now expects overall upwards movement for a few weeks to either end about 1,559 or to find resistance again at the upper edge of the blue channel on weekly and daily charts. A short-term target at 1,522 may see a pullback or consolidation develop.
The bullish Elliott wave count expects a primary degree fourth wave has completed and the upwards trend has resumed.
Grand SuperCycle analysis is here.
Monthly charts were last updated here.
BEARISH ELLIOTT WAVE COUNT
WEEKLY CHART
Click chart to enlarge.
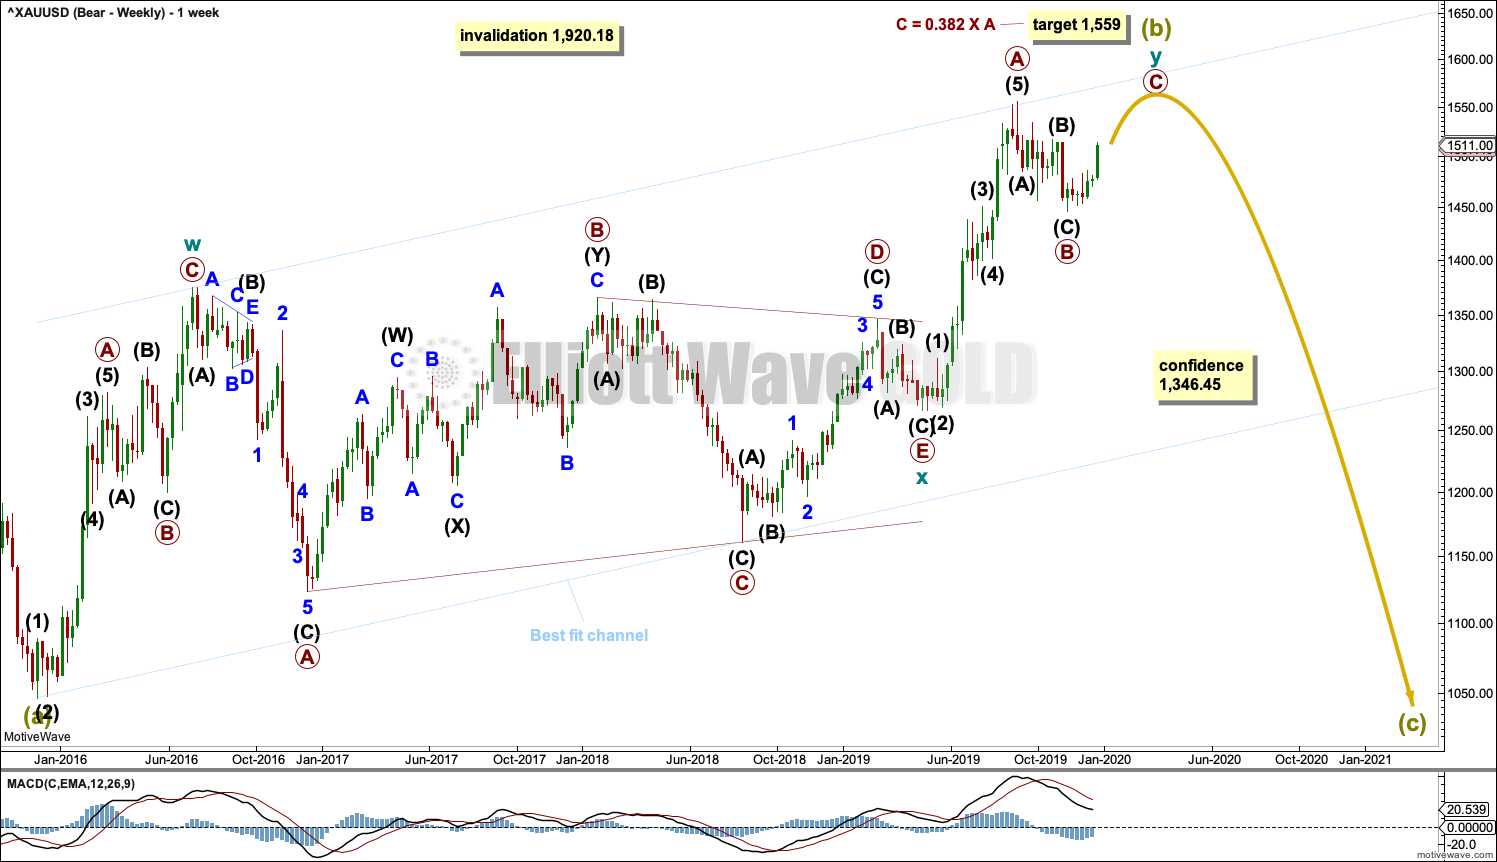
Super Cycle wave (b) may still be an incomplete double zigzag, requiring one more high.
The first zigzag in the double is labelled cycle wave w. The double is joined by a three in the opposite direction, a triangle labelled cycle wave x. The second zigzag in the double is labelled cycle wave y.
The purpose of the second zigzag in a double is to deepen the correction. Cycle wave y has achieved this purpose.
After the structure of cycle wave y may be complete, then a new low below 1,346.45 would add strong confidence to this wave count. At that stage, the bullish Elliott wave count would be invalidated. At that stage, targets for Super Cycle wave (c) would be calculated.
A wide best fit channel is added in light blue. This channel contains all of Super Cycle wave (b) and may provide resistance and support. Copy this channel over to daily charts. If the target is wrong, it may not be quite high enough. Upwards movement may end if price comes up to touch the upper edge of the channel.
DAILY CHART
Click chart to enlarge.
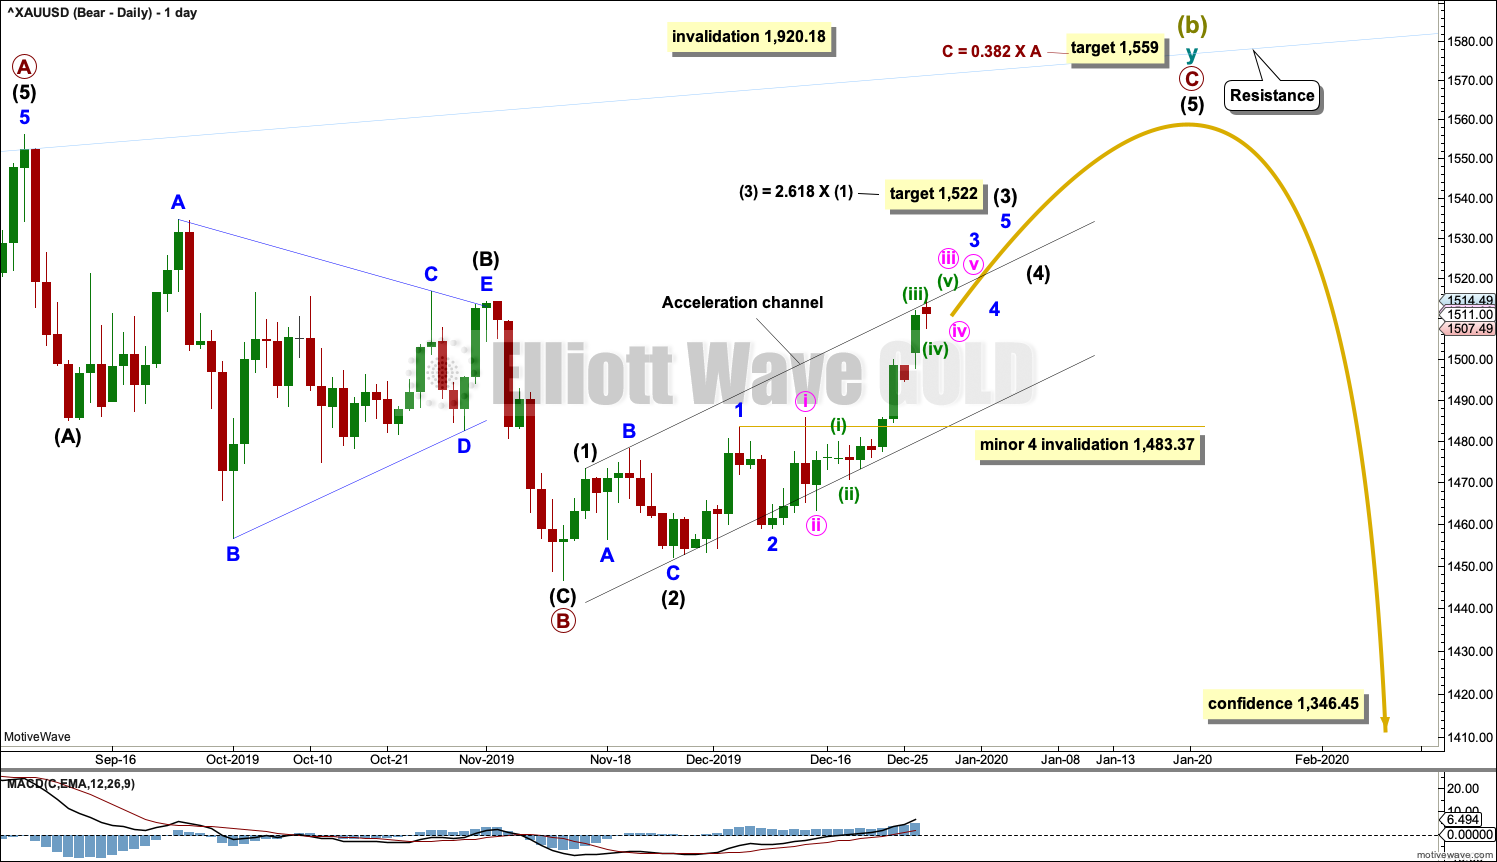
It is possible that the double zigzag for Super Cycle wave (b) may be incomplete and may yet require one more high.
Within cycle wave y, primary wave A may have been over at the last high.
Primary wave B may be complete as a single zigzag. Within the zigzag, intermediate wave (C) is just 3.56 short of equality in length with intermediate wave (A). Intermediate wave (B) is a running contracting triangle.
Primary wave C would be expected to find strong resistance and end at the upper edge of the blue best fit channel copied over from the weekly chart.
Primary wave C must subdivide as a five wave structure. Within primary wave C, so far intermediate waves (1) and (2) may be complete. Intermediate wave (3) may only subdivide as an impulse. The middle of the impulse may be complete. Minor wave 4 may not move into minor wave 1 price territory below 1,483.37.
One or both of minute wave v and minor wave 5 may end with blow off tops. A further increase in upwards momentum may develop from here.
HOURLY CHART
Click chart to enlarge.
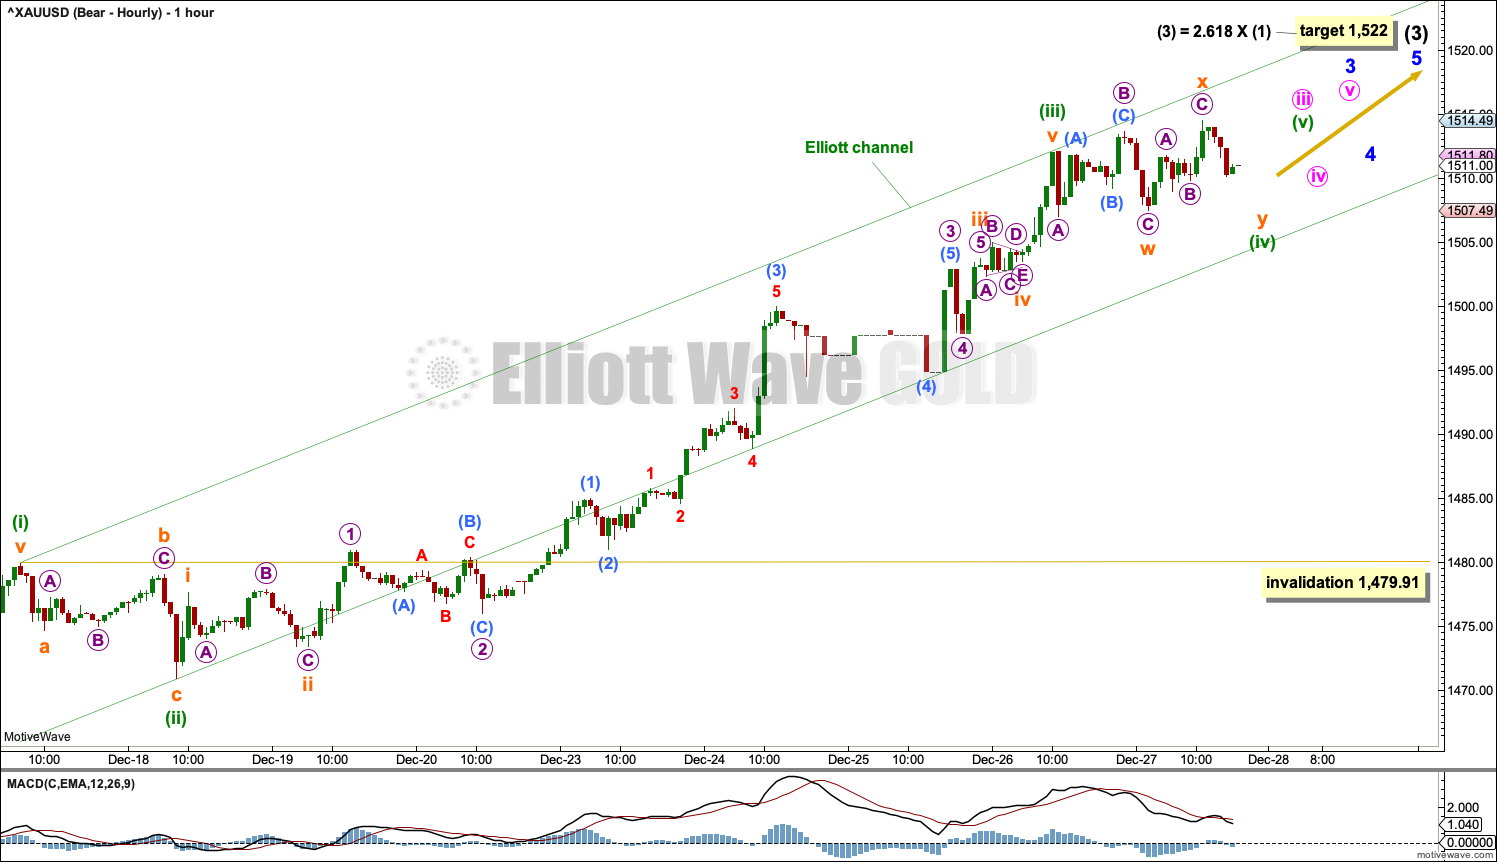
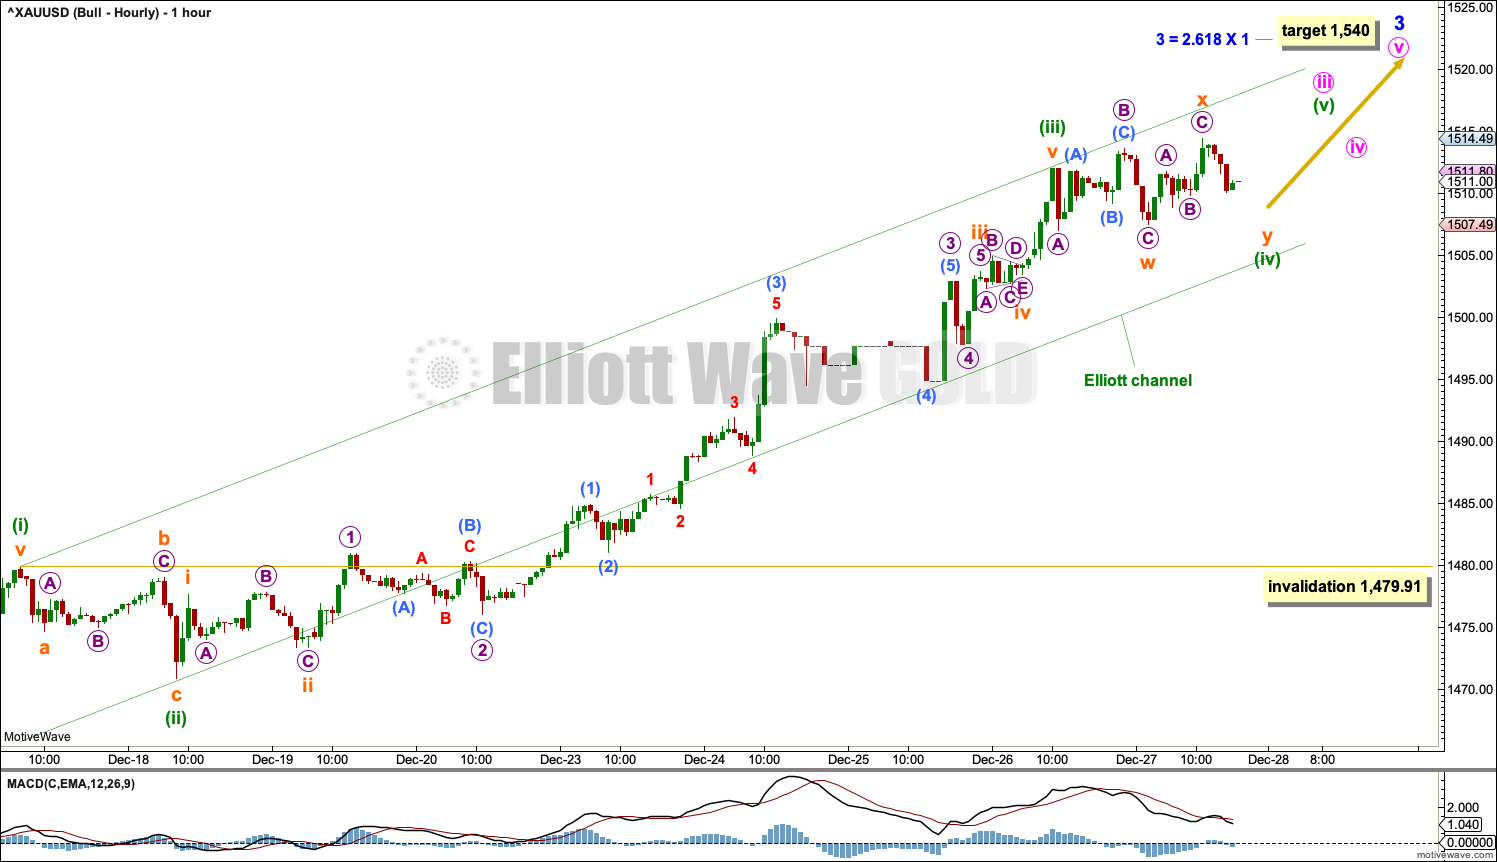
The hourly chart begins at the high labelled minuette wave (i), which may also be seen on the daily chart.
Within the middle of the impulse, minuette wave (iv) may not move into minuette wave (i) price territory below 1,479.91.
Draw an Elliott channel about the middle of this third wave. Draw the first trend line from the ends of minuette waves (i) to (iii), then place a parallel copy on the end of minuette wave (ii). The lower edge of this channel may provide support for minuette wave (iv).
BULLISH ELLIOTT WAVE COUNT
WEEKLY CHART
Click chart to enlarge.
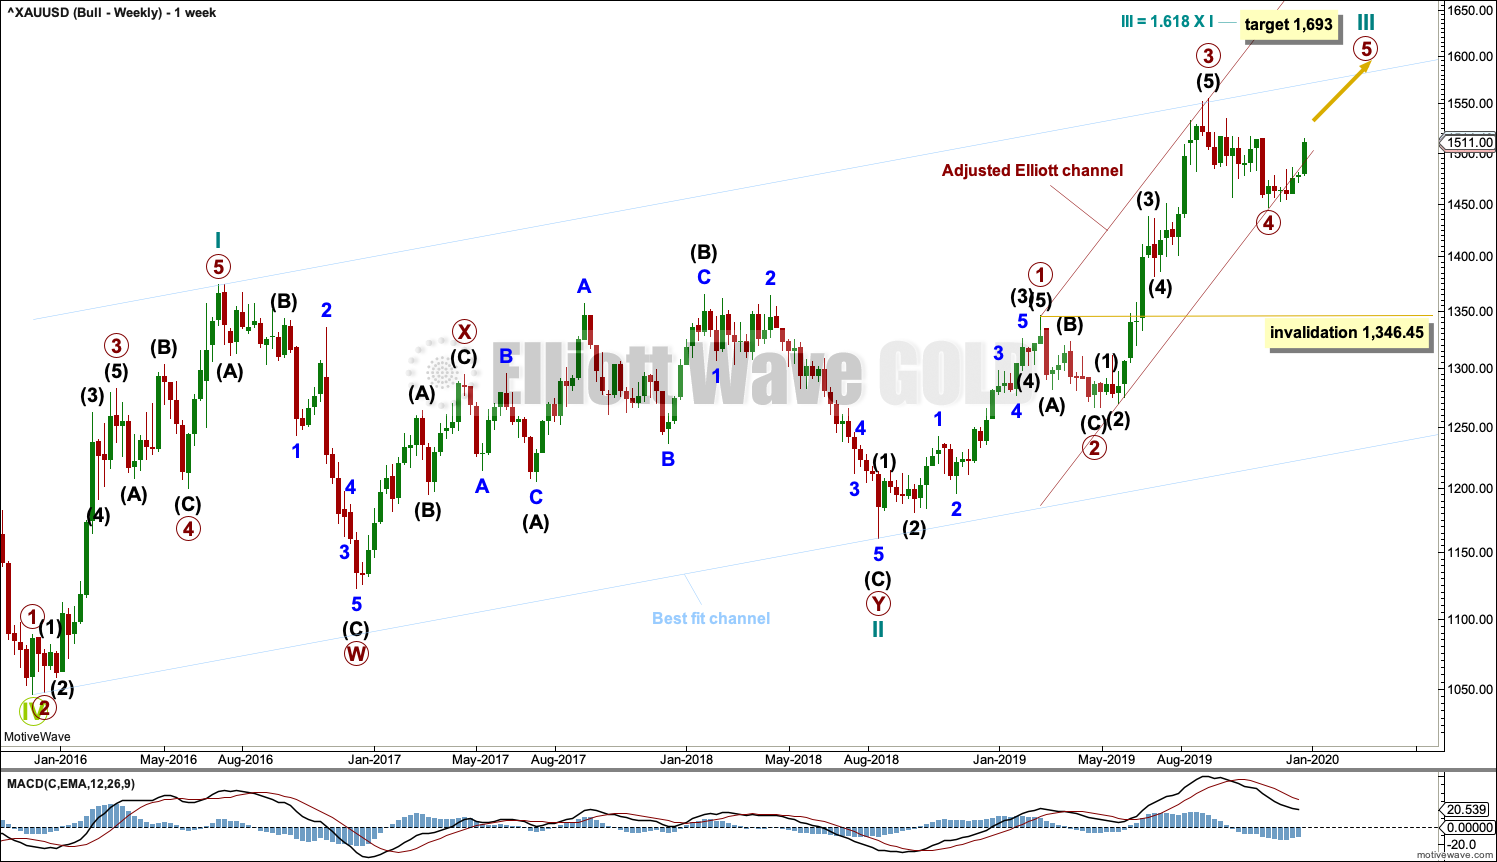
This wave count sees the the bear market complete at the last major low for Gold in November 2015.
If Gold is in a new bull market, then it should begin with a five wave structure upwards on the weekly chart. However, the biggest problem with this wave count is the structure labelled cycle wave I because this wave count must see it as a five wave structure, but it looks more like a three wave structure.
Commodities often exhibit swift strong fifth waves that force the fourth wave corrections coming just prior and just after to be more brief and shallow than their counterpart second waves. It is unusual for a commodity to exhibit a quick second wave and a more time consuming fourth wave, and this is how cycle wave I is labelled. This wave count still suffers from this very substantial problem, which is one reason why the bearish wave count is preferred because it has a better fit in terms of Elliott wave structure.
Cycle wave II subdivides well as a double combination: zigzag – X – expanded flat.
Cycle wave III may have begun. Within cycle wave III, primary waves 1 and 2 may now be complete. Primary wave 3 has now moved above the end of primary wave 1 meeting a core Elliott wave rule. It has now moved far enough to allow room for primary wave 4 to unfold and remain above primary wave 1 price territory. Primary wave 4 may not move into primary wave 1 price territory below 1,346.45.
Cycle wave III so far for this wave count would have been underway now for 71 weeks. It exhibits some support from volume and increasing ATR. This wave count has some support from classic technical analysis.
The channel drawn about cycle wave III is an adjusted Elliott channel. The lower edge is pulled lower.
Add the wide best fit channel to weekly and daily charts.
DAILY CHART
Click chart to enlarge.
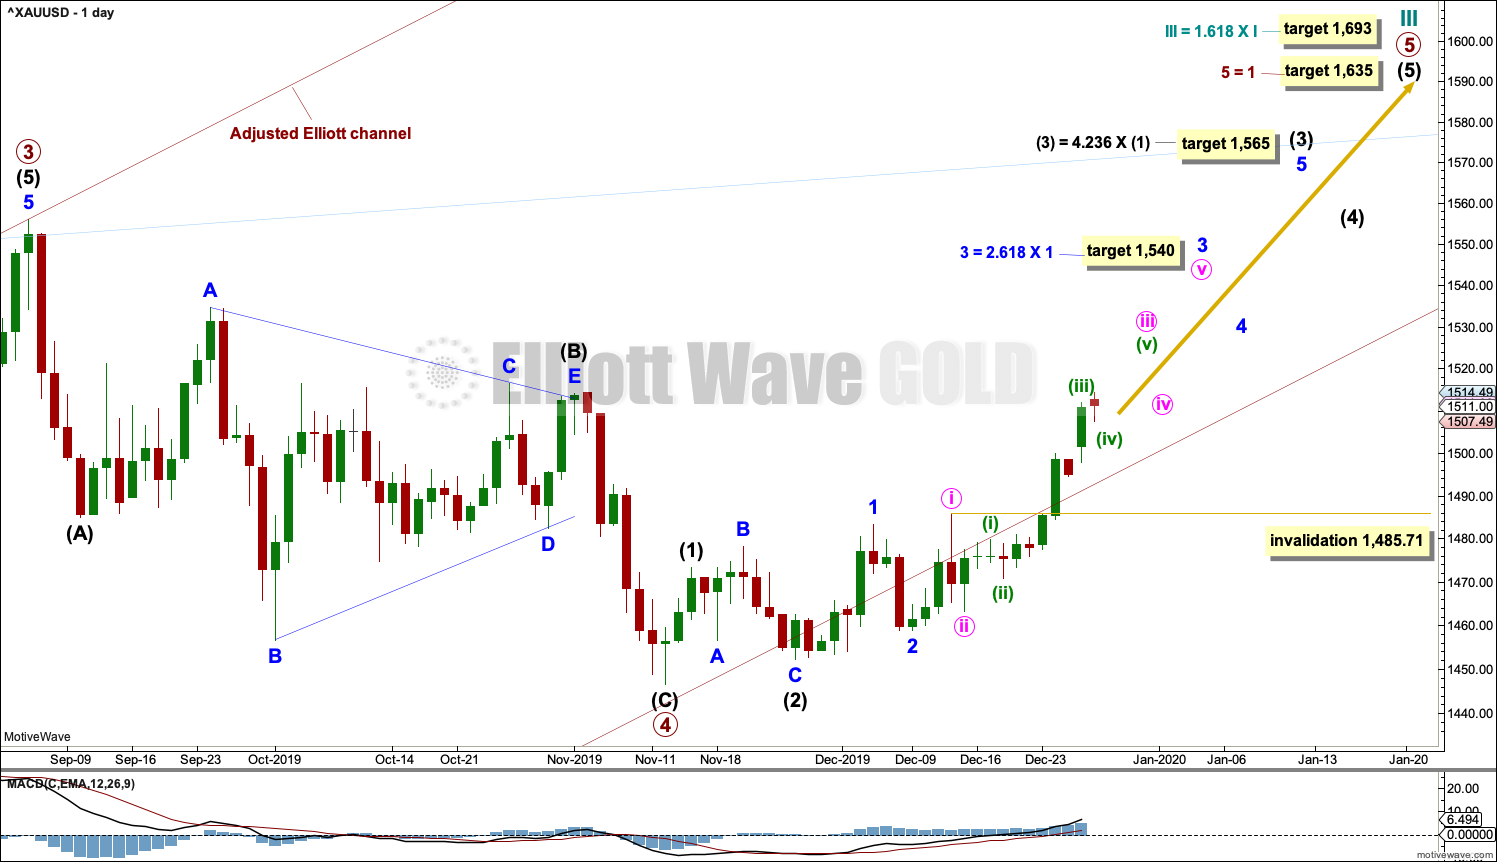
Primary wave 4 may be complete as a single zigzag. Primary wave 4 may have lasted 49 sessions, just six more than primary wave 2, which lasted 43 sessions. The proportion remains very good for this part of the wave count.
A target for cycle wave III is calculated also now at primary degree. If price reaches the first target and keeps rising, then the second higher target may be used.
Primary wave 5 may only subdivide as a five wave structure, most likely an impulse. Within primary wave 5, intermediate wave (3) may only subdivide as an impulse.
Within the impulse of intermediate wave (3), minute wave iv may not move into minute wave i price territory below 1,485.71.
At this stage, this bullish Elliott wave count is essentially the same as the main bearish Elliott wave count in that both expect more upwards movement to new highs. The structure unfolding is the same, the degree of labelling is the same, and for the short term hourly charts are the same. Targets are different.
HOURLY CHART
Click chart to enlarge.
Hourly charts for the main bearish and this bullish wave count are the same, with the exception of targets which are different.
TECHNICAL ANALYSIS
WEEKLY CHART
Click chart to enlarge. Chart courtesy of StockCharts.com.
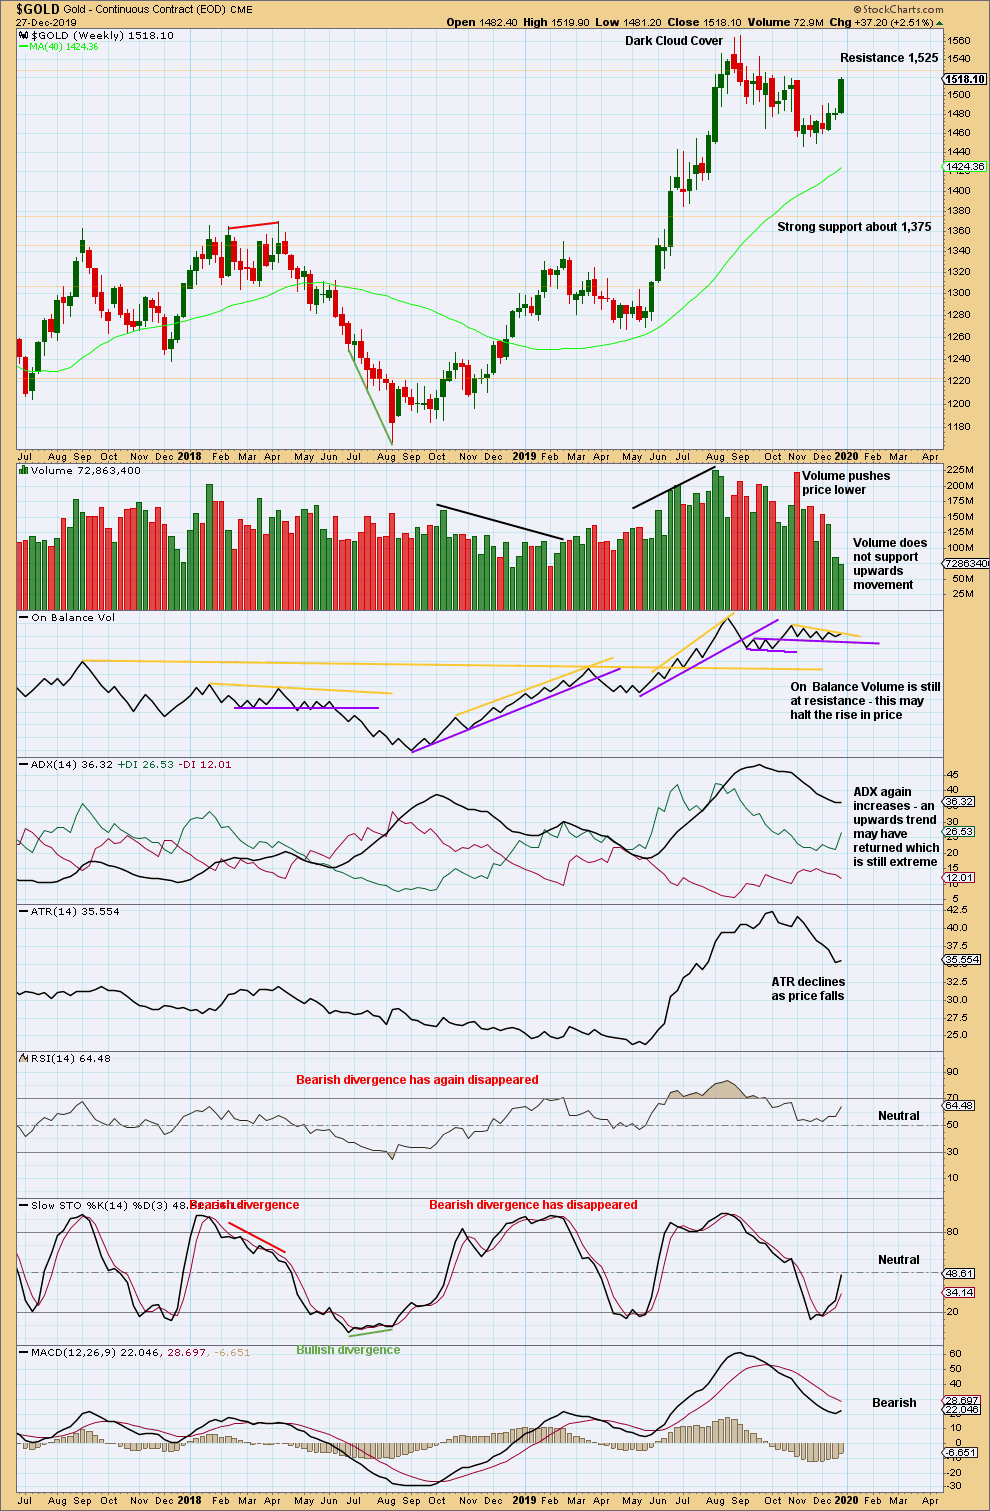
This week saw price move strongly higher, but it did so on very weak volume. On Balance Volume remains constrained. This upwards movement may continue further, but it may be relatively limited.
DAILY CHART
Click chart to enlarge. Chart courtesy of StockCharts.com.
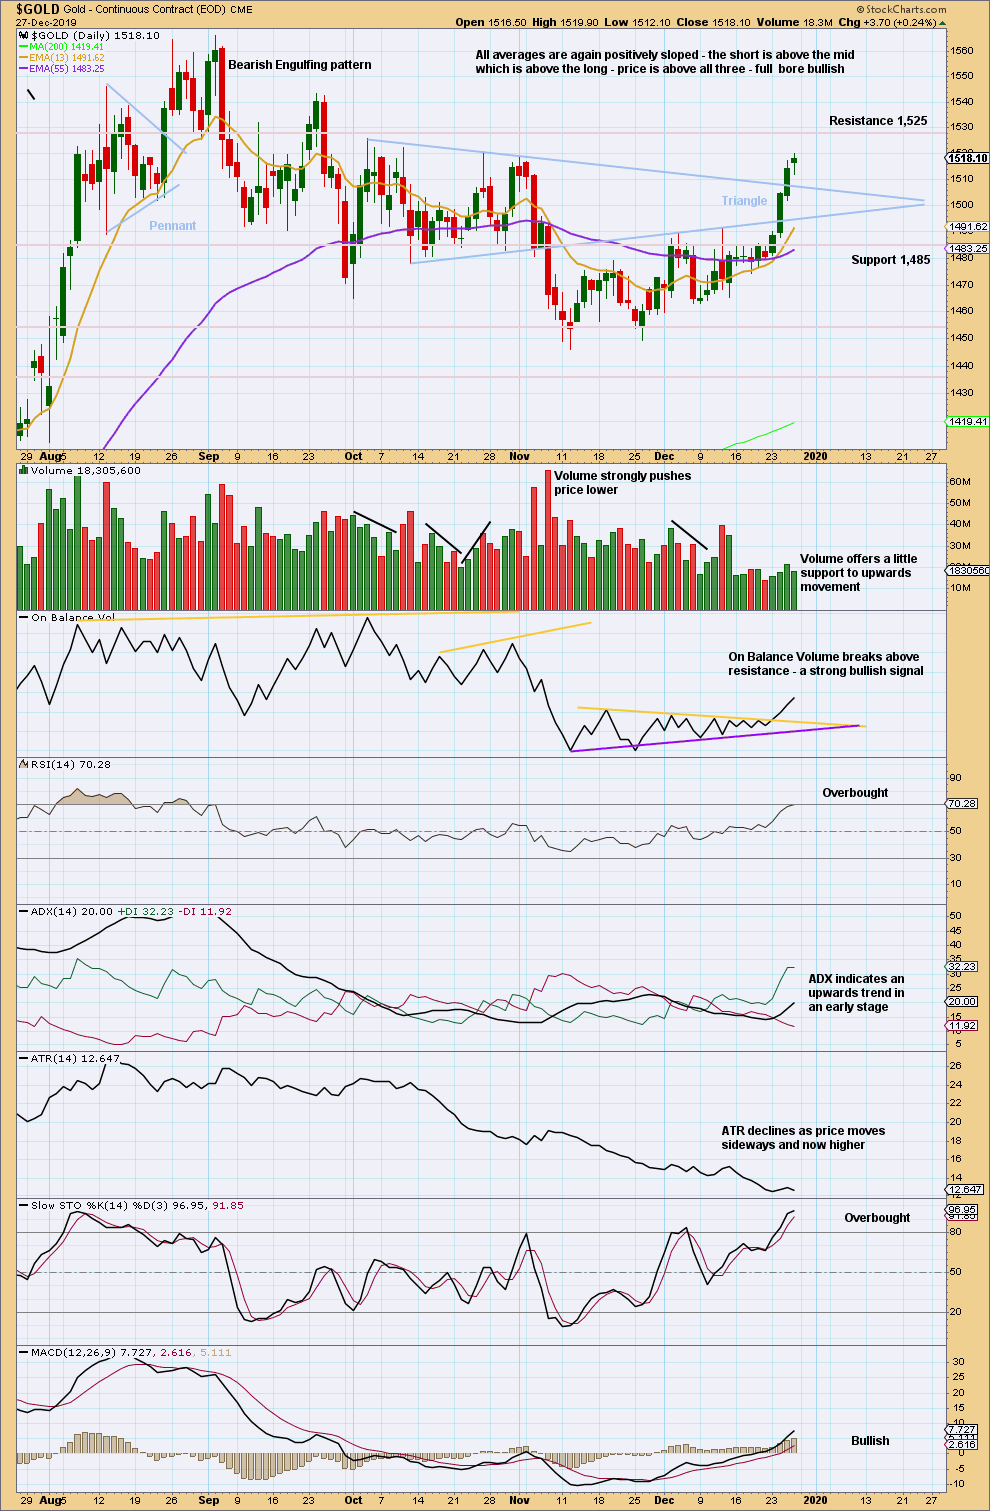
Since the last high on the 4th of September, there was a series of three swing lows and swing highs. The last swing high at 1,519 on the 1st of November has now been breached; the downwards trend from the 4th of September may have ended.
The signal from On Balance Volume is strong because the trend line breached was tested multiple times, had a shallow slope and was long held.
Upwards movement this week has come with overall weak volume and declining ATR. With the data in hand at this time, this movement is weak.
GDX WEEKLY CHART
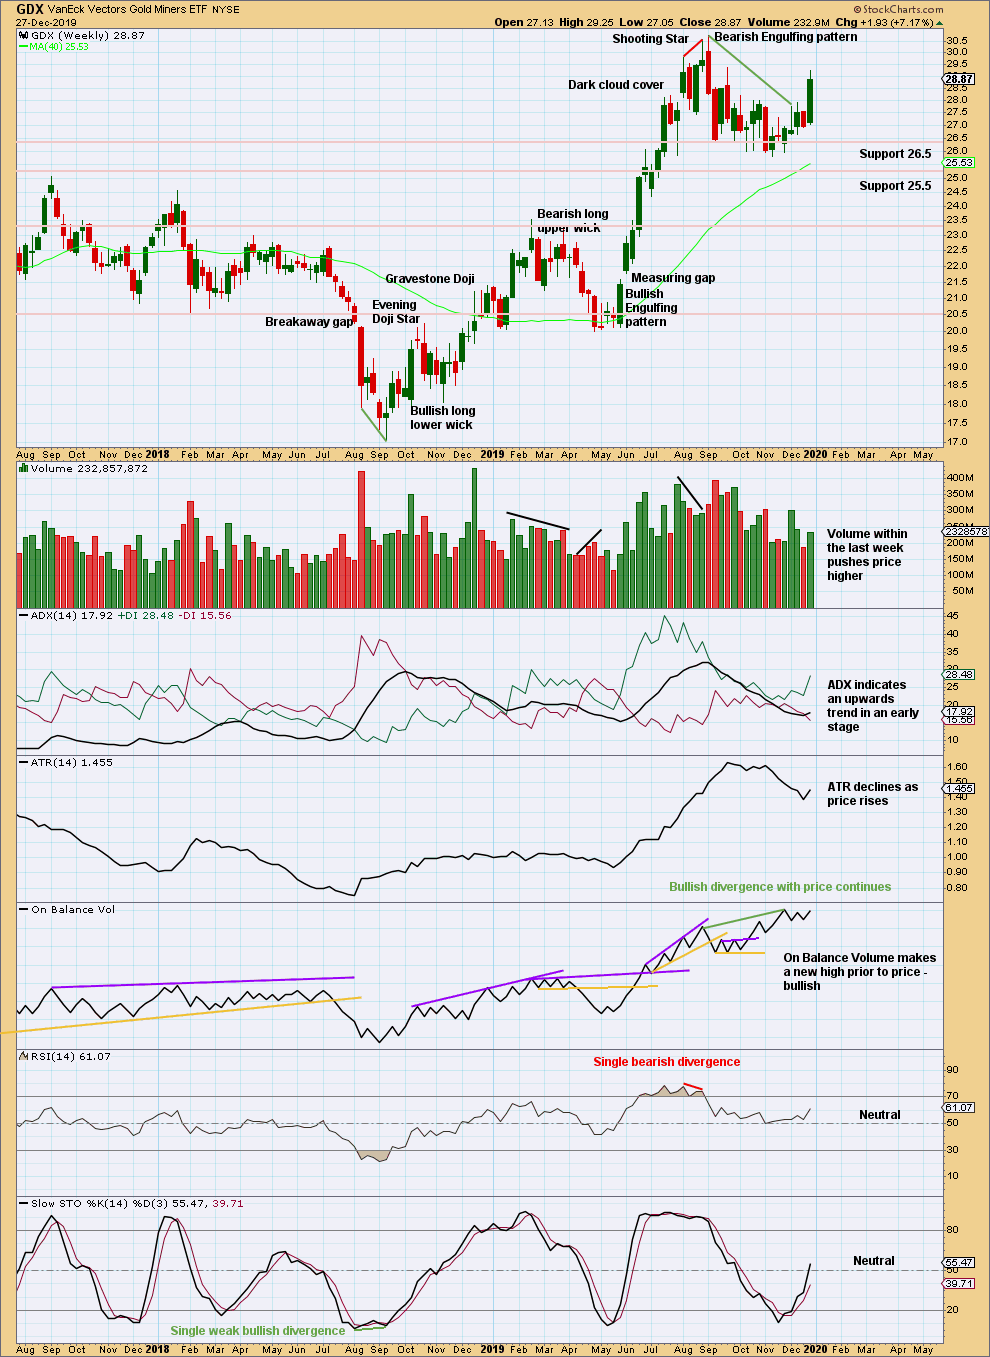
Click chart to enlarge. Chart courtesy of StockCharts.com.
GDX looks more clearly bullish than Gold at this point. There is room for an upwards trend to again continue to new highs. However, this trend did start slowly with weak volume and overall there is some decline in volume. On Balance Volume remains bullish.
GDX DAILY CHART
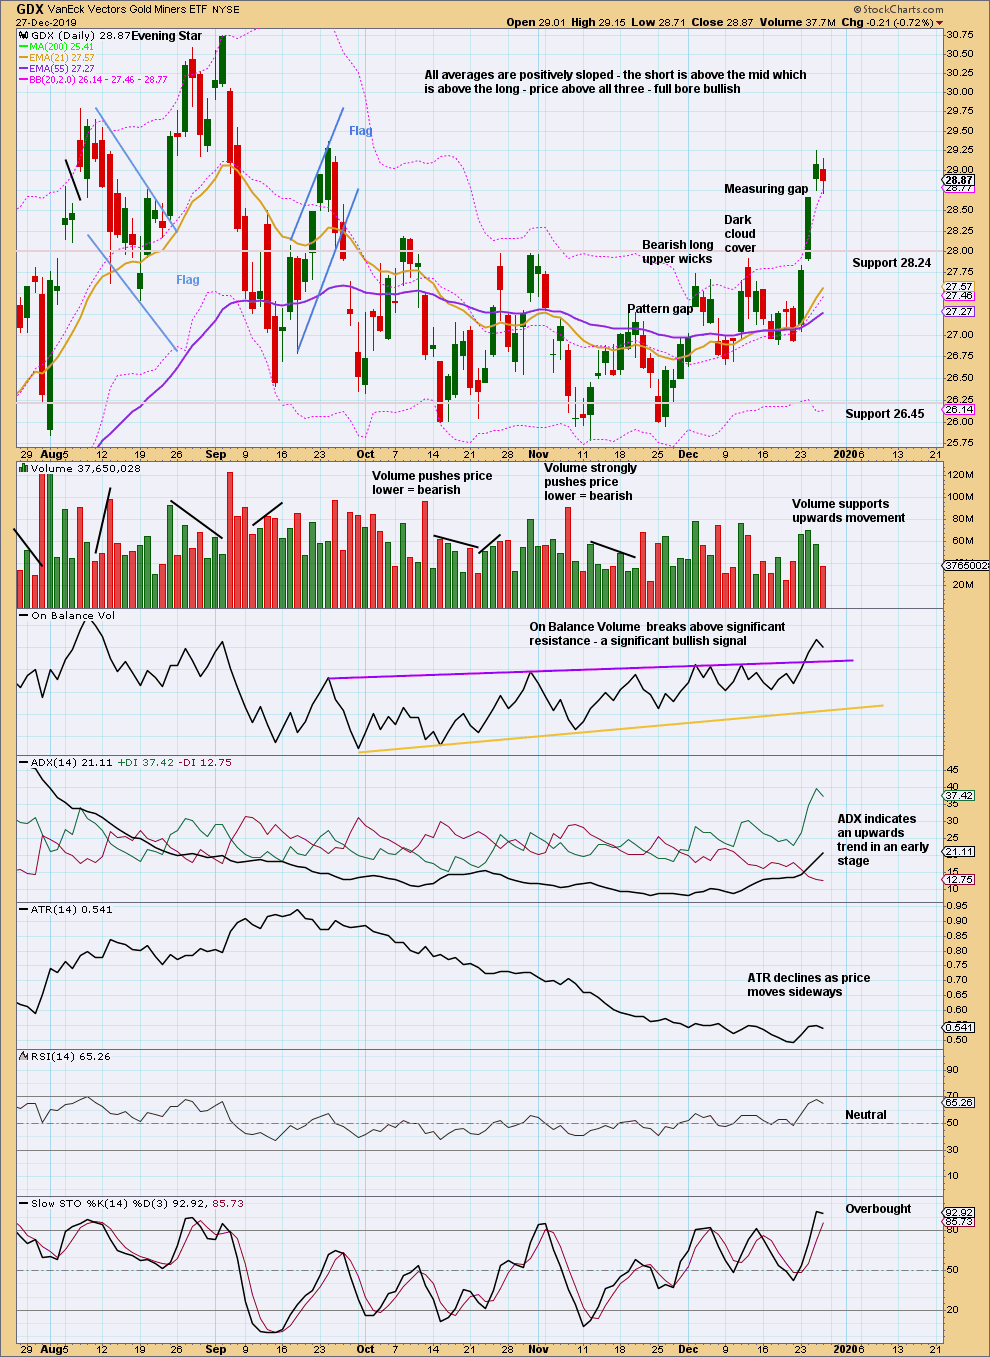
Click chart to enlarge. Chart courtesy of StockCharts.com.
The last swing high at 28.18 on the 31st of October was breached on the 24th of December. At that stage, the series of swing lows and swing highs was broken and a trend change was more likely.
A short-term target calculated from the measuring gap is at 29.52. The gap remains open.
Published @ 08:33 p.m. EST.
—
Careful risk management protects your trading account(s).
Follow my two Golden Rules:
1. Always trade with stops.
2. Risk only 1-5% of equity on any one trade.
—
New updates to this analysis are in bold.
That’s more like it.
The invalidation point moves up to the end of minute i. Minute iii now looks over, minute iv may be relatively brief and shallow and may not move into minute i price territory.
Gold can’t seem to break out. Wonder if another pull back is in the cards.
Zebra. I’m thinking the same. Perhaps the new year will tell us the direction. There could be a few traders willing to sell near the high of last year to lock in on gains and avoid taxes in New year. The fact the speculators added another 20 k contracts to their bullish stance and stand about where the last high was reached tells me we may be close to a reversal and perhaps a c wave down. I think we are in a b up right now. Up Volume not impressive.
Sounds nice – have a good time …
Let’s hope 2020 is a bit kinder to us (on the charts)
Hi everybody. This is the last analysis for 2019, we’ll be in a new decade with the next one!
I’ll be doing a lot of travelling in 2020. I’ve already started, I’m in Wellington this morning on my way to Christchurch today. We’re on a big South Island road trip, hunting for good waves in some of our best surf spots.
I’ve planned everything so that there will be no interruption to your analysis nor should anything be published too late.
I can’t help it, I may have to share a few pics of this beautiful country with you along the way.