
SILVER: Elliott Wave and Technical Analysis | Charts – December 27, 2019
Upwards movement for the week suggests an alternate Elliott wave count may be more likely.
Summary: The target for upwards movement to end is now at 21.375
ELLIOTT WAVE COUNTS
Last updated monthly charts may be found here.
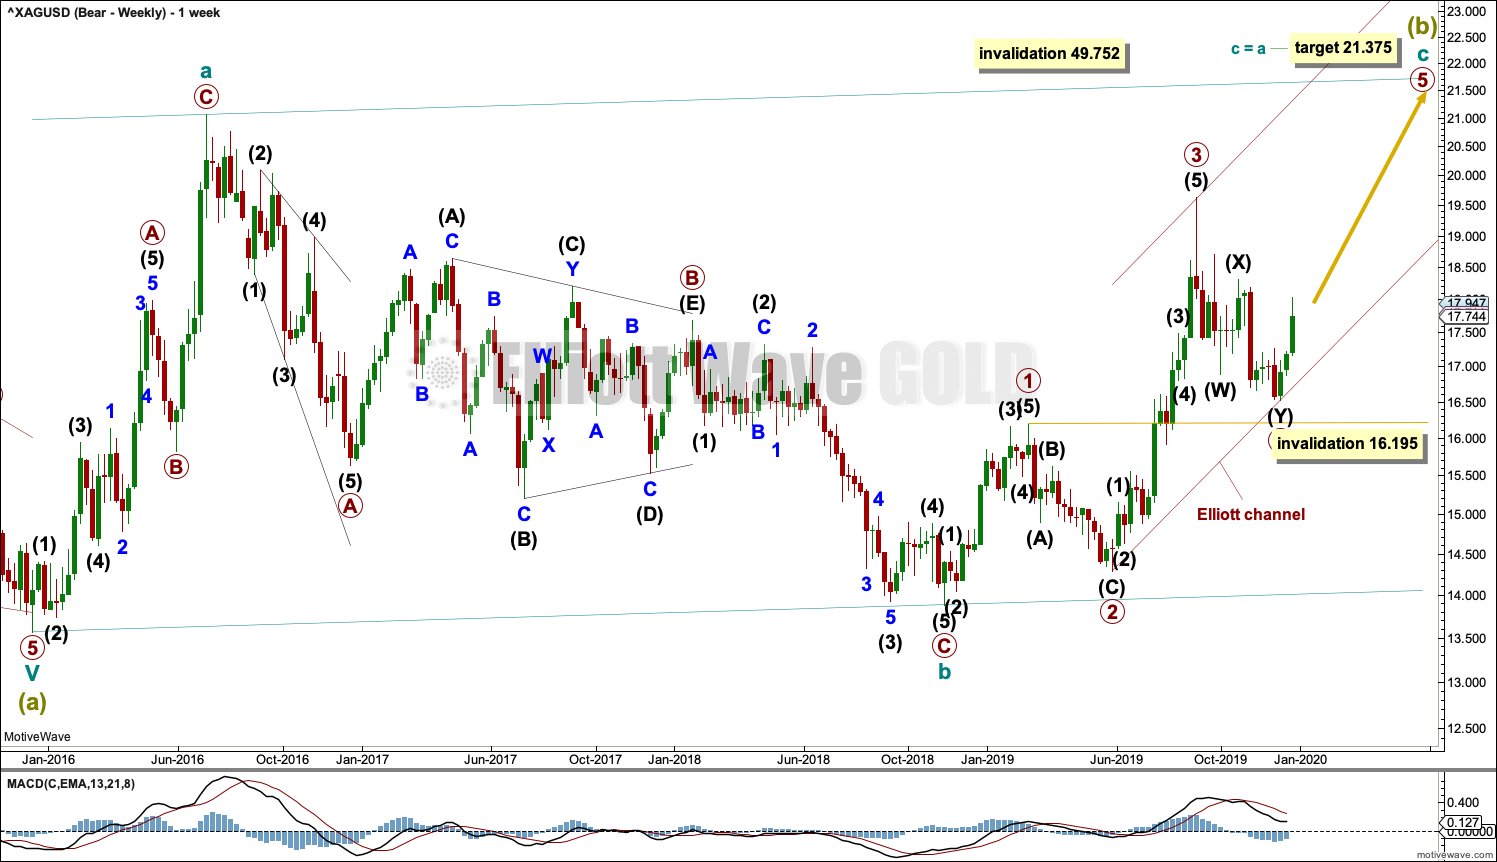
BEARISH WAVE COUNT
WEEKLY CHART
Click chart to enlarge.
Last week’s main wave count is discarded. This is again the main wave count.
Super Cycle wave (b) may be an incomplete regular flat correction.
Within the regular flat correction, cycle wave a subdivides well as a zigzag and cycle wave b subdivides well as a zigzag, which is a 0.96 correction of cycle wave a.
Cycle wave c must complete as a five wave structure. Within cycle wave c, primary waves 1 through to 4 may be complete. If it continues any further, then primary wave 4 may not move into primary wave 1 price territory below 16.195.
Regular flat corrections often fit within parallel channels. Cycle wave c may end about resistance at the upper edge of the channel. The most common Fibonacci Ratio for cycle wave c within a regular flat would be equality in length with cycle wave a.
It would be extremely likely, for this wave count, for cycle wave c to move at least slightly above the end of cycle wave a at 21.062 to avoid a truncation.
Within cycle wave c, primary waves 1 and 3 both lasted 14 weeks, one longer than a Fibonacci 13. Primary wave 4 has now lasted 14 weeks.
DAILY CHART
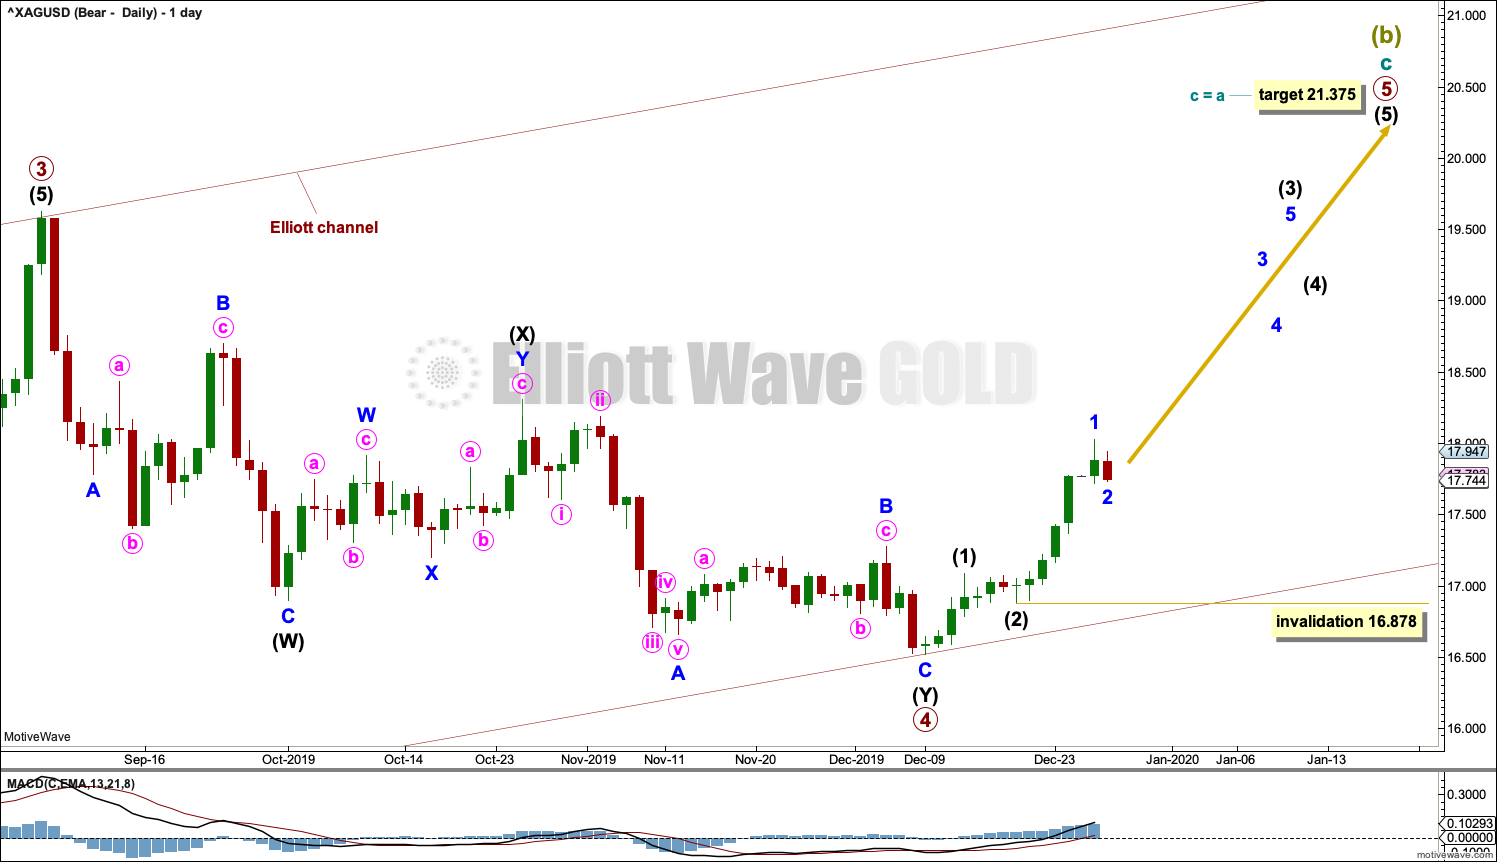
Click chart to enlarge.
Cycle wave C may be subdividing as an impulse. Within the impulse, primary waves 1 to 4 may be complete.
Primary wave 5 must subdivide as a five wave structure. Within primary wave 5, so far intermediate waves (1) and (2) may be complete.
Intermediate wave (3) may only subdivide as an impulse. Within intermediate wave (3) minor wave 1 may be complete. Minor wave 2 may not move beyond the start of minor wave 1 below 16.878.
BULLISH WAVE COUNT
WEEKLY CHART
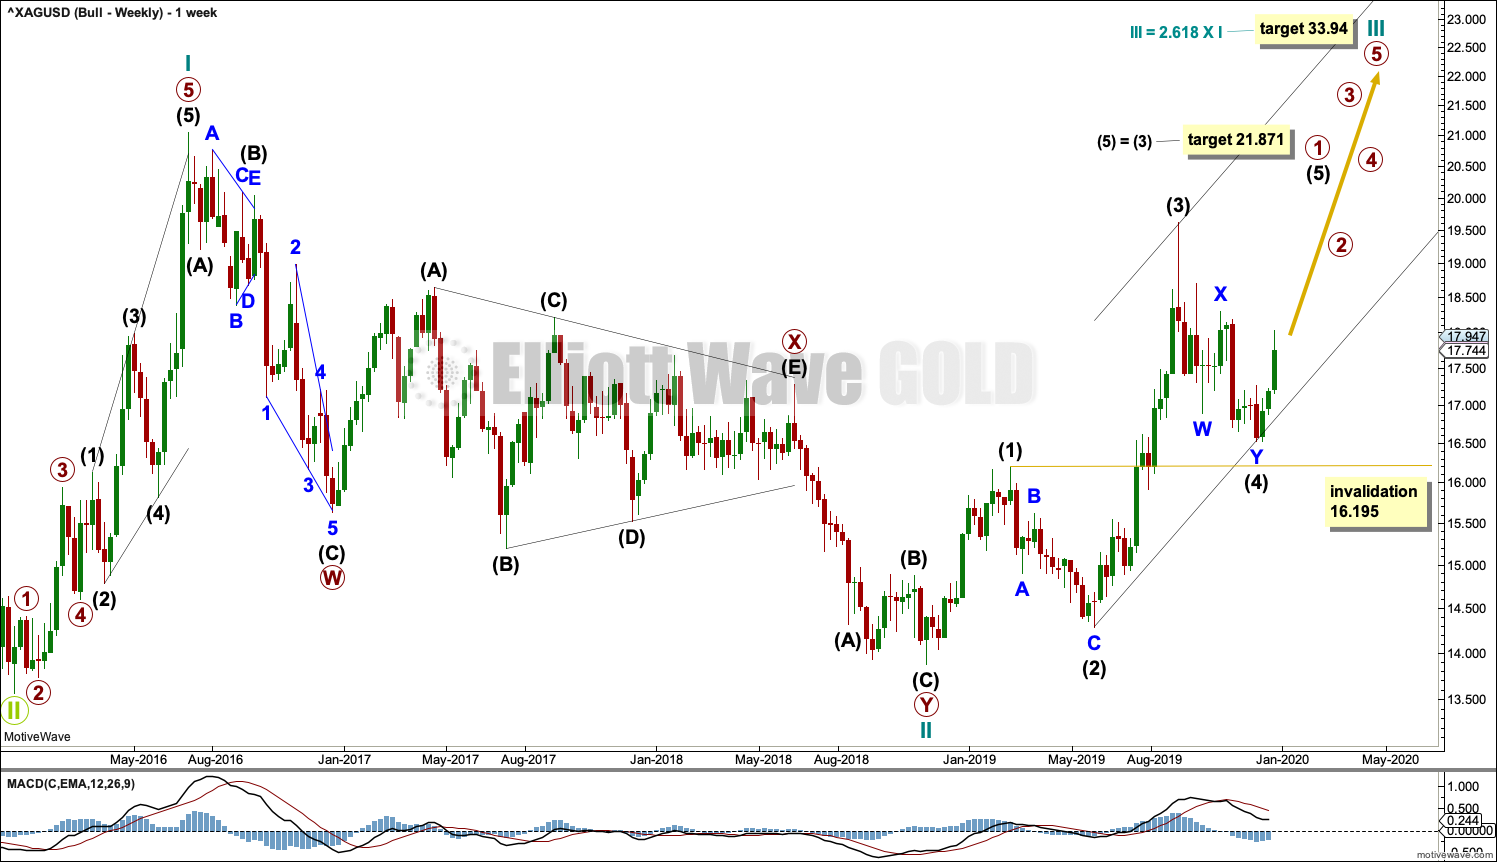
Click chart to enlarge.
This bullish Elliott wave count sees a new bull market beginning for Silver at the low in December 2015.
A new bull market should begin with a five wave structure upwards. This is labelled cycle wave I.
Following five steps forward should be three steps back. This is labelled cycle wave II. The Elliott wave corrective structure of cycle wave II is labelled as a double zigzag, which is a fairly common structure.
Cycle wave III may only subdivide as an impulse. Within cycle wave III, only primary wave 1 may be unfolding. Within primary wave 1, intermediate wave (4) may not move into intermediate wave (1) price territory below 16.195.
Cycle wave III must move beyond the end of cycle wave I above 21.062. Cycle wave III must move far enough above this point to allow room for cycle wave IV to unfold and remain above cycle wave I price territory.
DAILY CHART
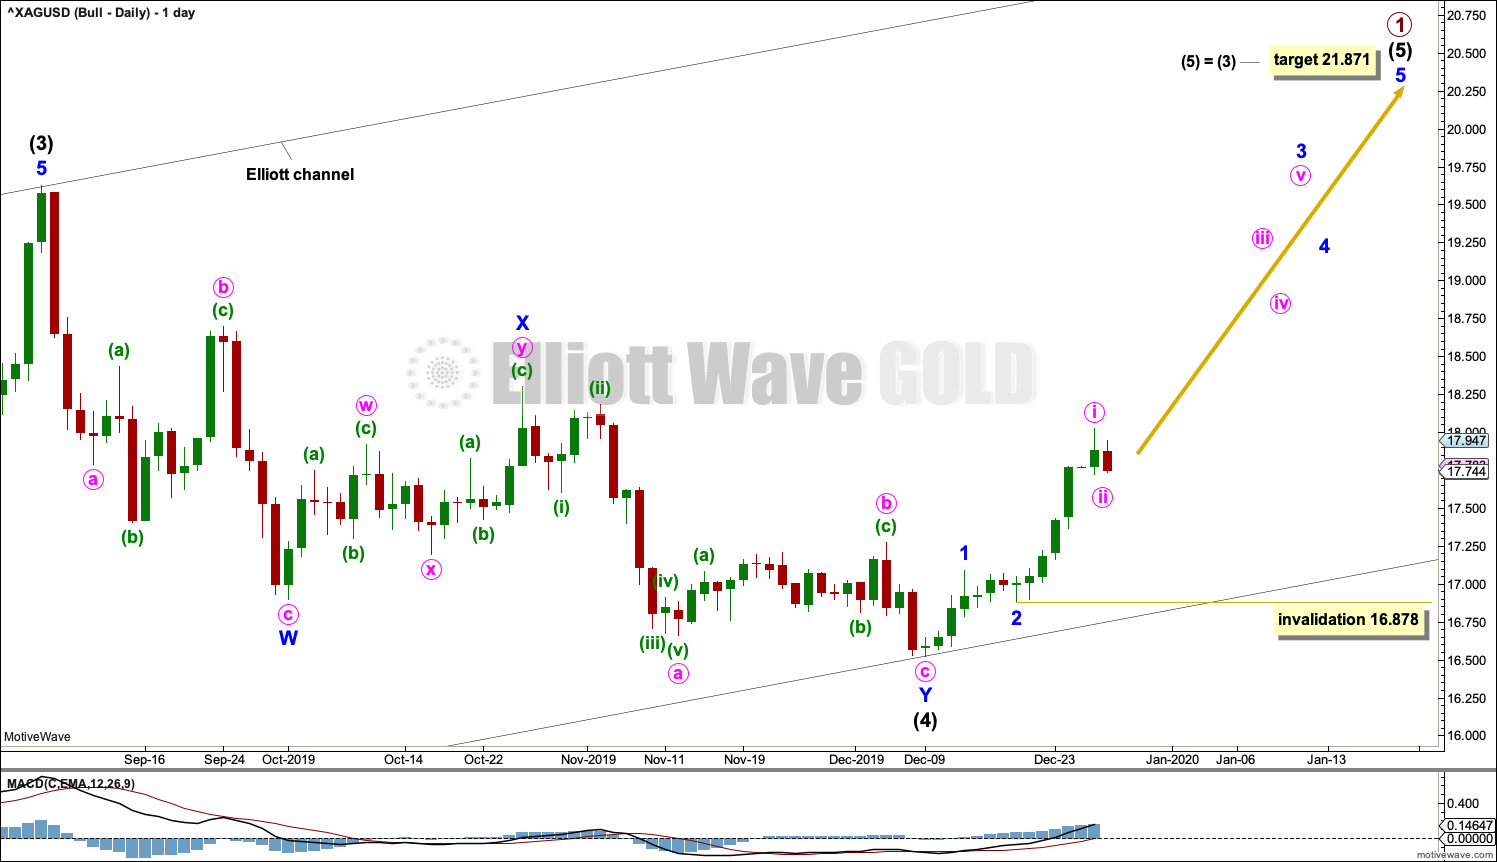
Click chart to enlarge.
Both this bullish Elliott wave count and the bearish Elliott wave count now expect a fourth wave has completed. The targets for the next upwards movement are different.
TECHNICAL ANALYSIS
WEEKLY CHART
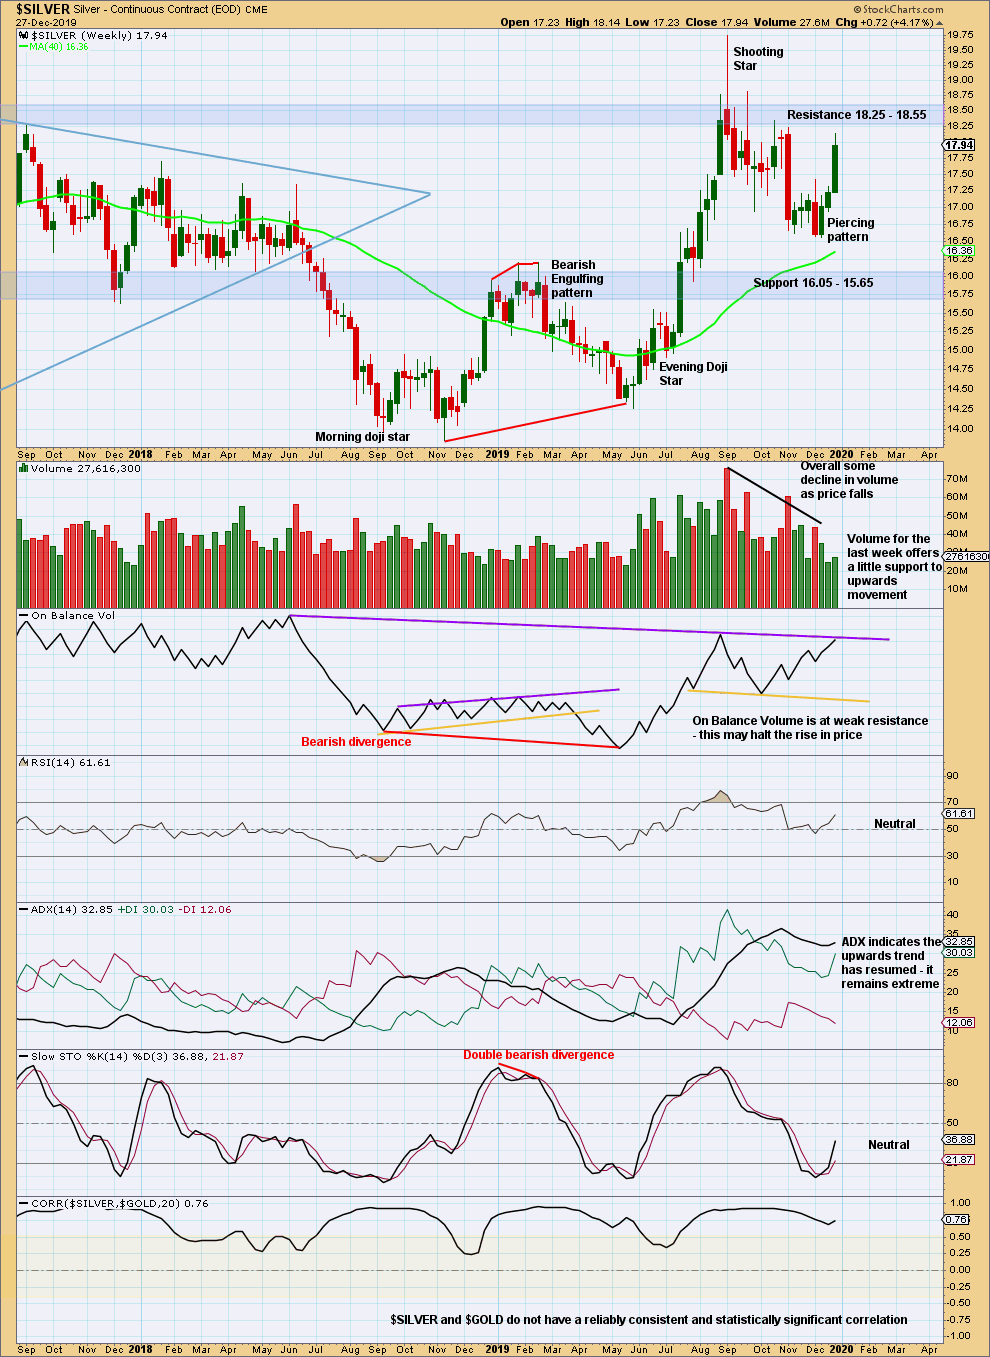
Click chart to enlarge. Chart courtesy of StockCharts.com.
Silver is back within a strong area of resistance and support, identified by blue shaded areas.
There is bearish divergence for On Balance Volume between last major lows and last major highs. On Balance Volume has not confirmed new highs for Silver, but has made a lower high for the early September swing high.
A strong upwards week has a very little support from volume, but overall volume is still declining as price moves sideways. The trend is again extreme and there is strong resistance above.
DAILY CHART
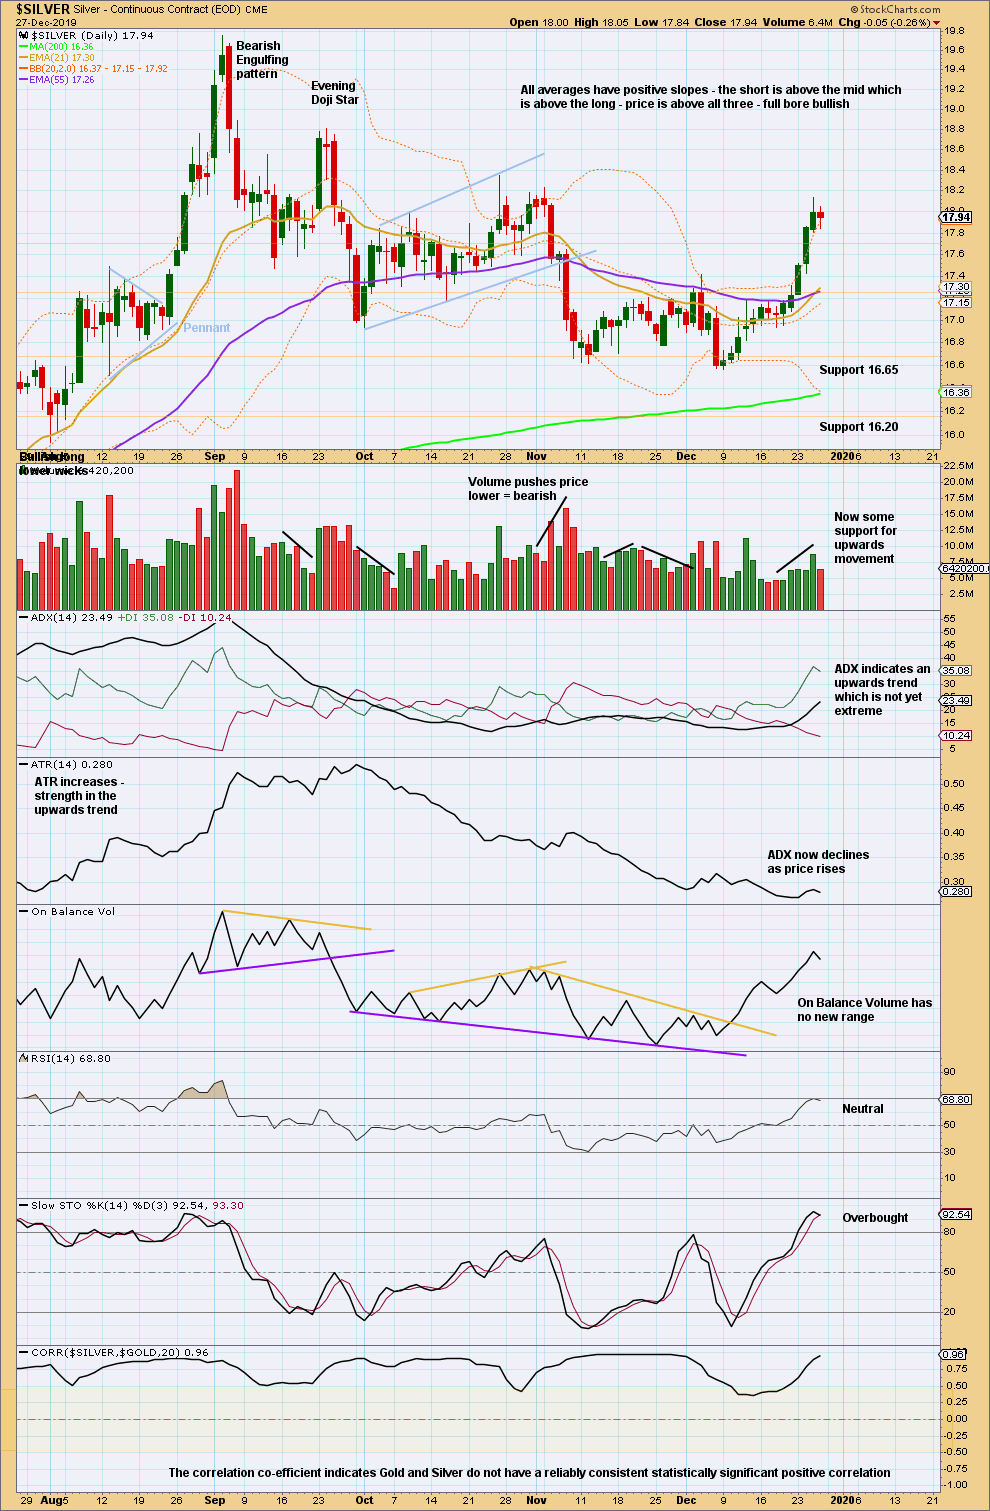
Click chart to enlarge. Chart courtesy of StockCharts.com.
Despite a weak beginning to this upwards movement with light volume and low range, the last swing high of the 4th of December has been exceeded. This breaks the pattern of a series of lower swing lows and lower swing highs. Silver may have had a trend change and ADX agrees. There is strong resistance above at 18.25 to 18.55 (weekly chart).
Published @ 01:18 p.m. EST on December 28, 2019.
—
Careful risk management protects your trading account(s).
Follow my two Golden Rules:
1. Always trade with stops.
2. Risk only 1-5% of equity on any one trade.
—
New updates to this analysis are in bold.
Agree
Nice to see gold and silver counts in alignment.
Silver still looking weak though ..
Can’t see them remain on the same count, unless we go bullish on both fronts.
However, as Lara has said many times … they don’t need to remain on the same count.