
GOLD: Elliott Wave and Technical Analysis | Charts – January 8, 2020
Today’s huge Bearish Engulfing candlestick with a long upper wick supports the main Elliott wave count.
Summary: A consolidation to last about two weeks and find support about the lower edge of the adjusted Elliott channel on daily charts is expected to have begun. Thereafter, more upwards movement may be a final thrust before a bear market resumes.
A bullish wave count expects a third wave is ending here or very soon. The target is 1,635 or 1,693.
A new alternate bearish wave count looks at the possibility that Gold has just seen a Super Cycle degree trend change. Confidence in this idea may be had with a new low below 1,473.36. Full and final confidence would be had if price makes a new low below 1,374.91.
Grand SuperCycle analysis is here.
Monthly charts were last updated here.
BEARISH ELLIOTT WAVE COUNT
WEEKLY CHART
Click chart to enlarge.
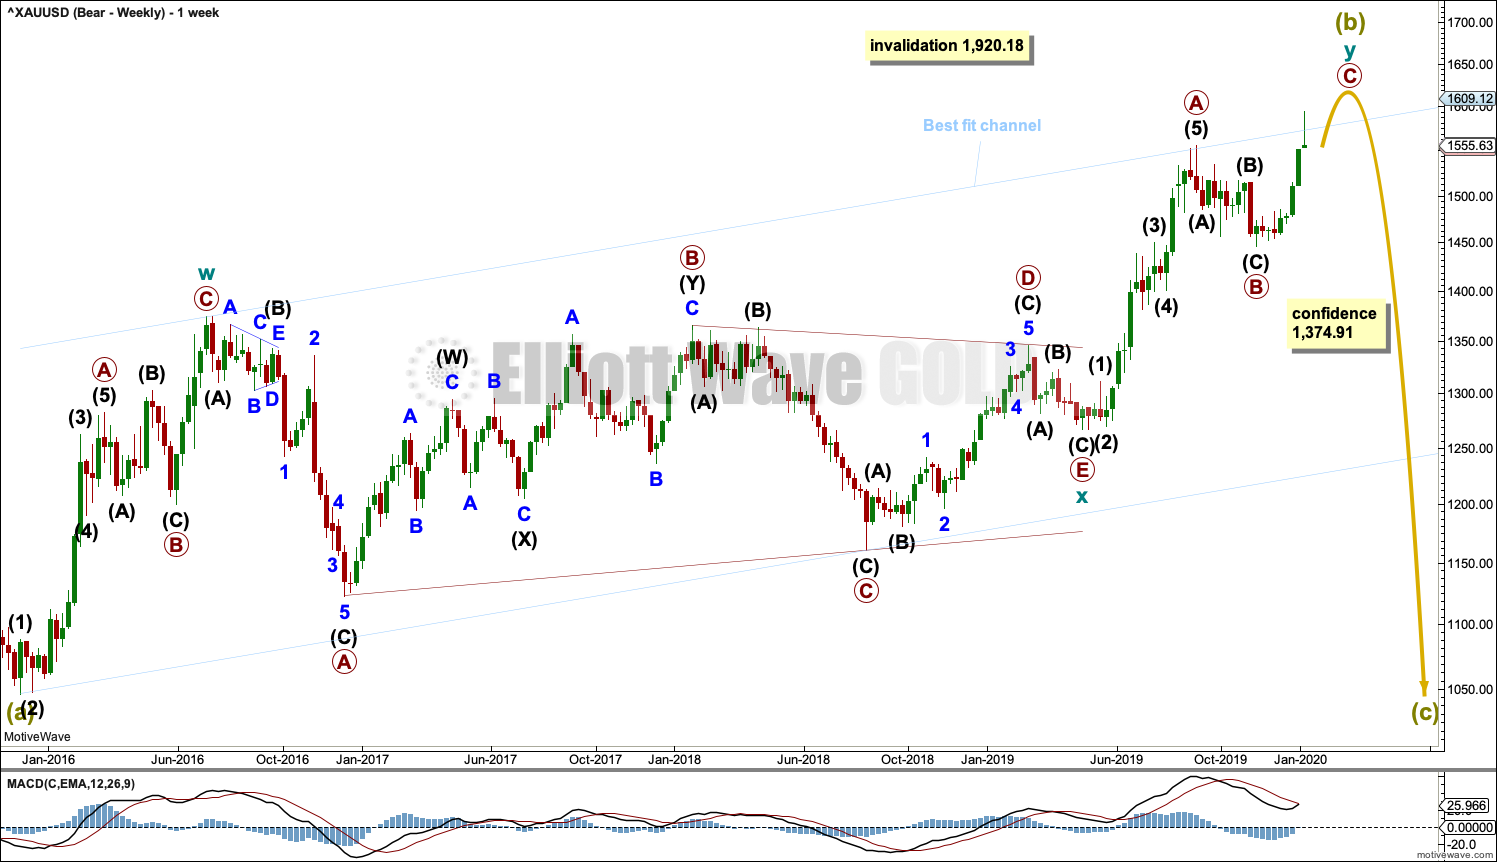
Super Cycle wave (b) may still be an incomplete double zigzag, requiring one more high.
The first zigzag in the double is labelled cycle wave w. The double is joined by a three in the opposite direction, a triangle labelled cycle wave x. The second zigzag in the double is labelled cycle wave y.
The purpose of the second zigzag in a double is to deepen the correction. Cycle wave y has achieved this purpose.
After the structure of cycle wave y may be complete, then a new low below 1,374.91 would add strong confidence to this wave count. At that stage, the bullish Elliott wave count would be invalidated. At that stage, targets for Super Cycle wave (c) would be calculated.
A wide best fit channel is added in light blue. Copy this channel over to daily charts. The upper edge of this channel was breached yesterday, but now price has returned strongly to within the channel.
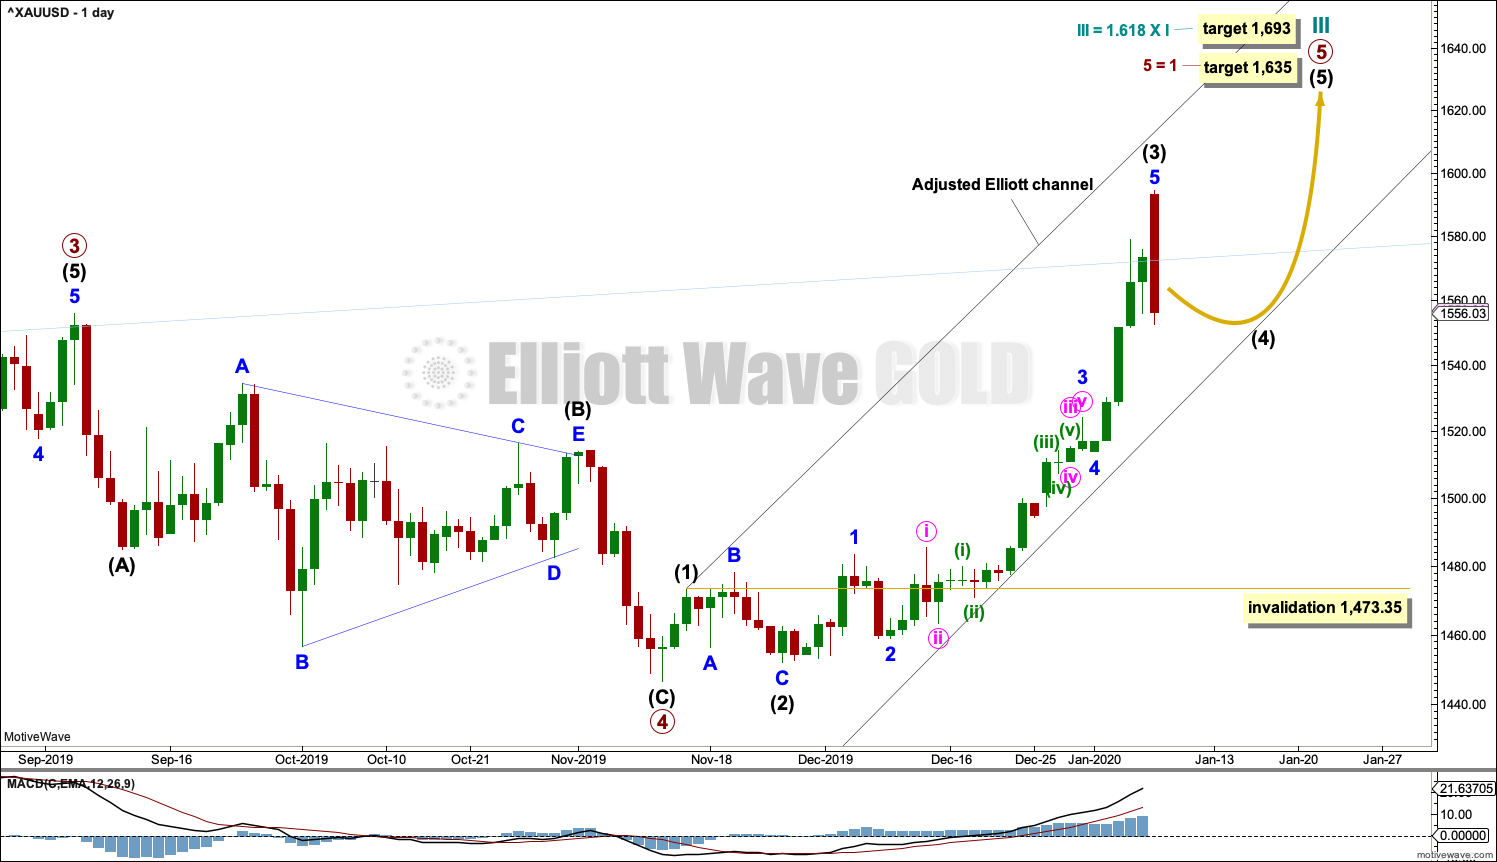
DAILY CHART
Click chart to enlarge.
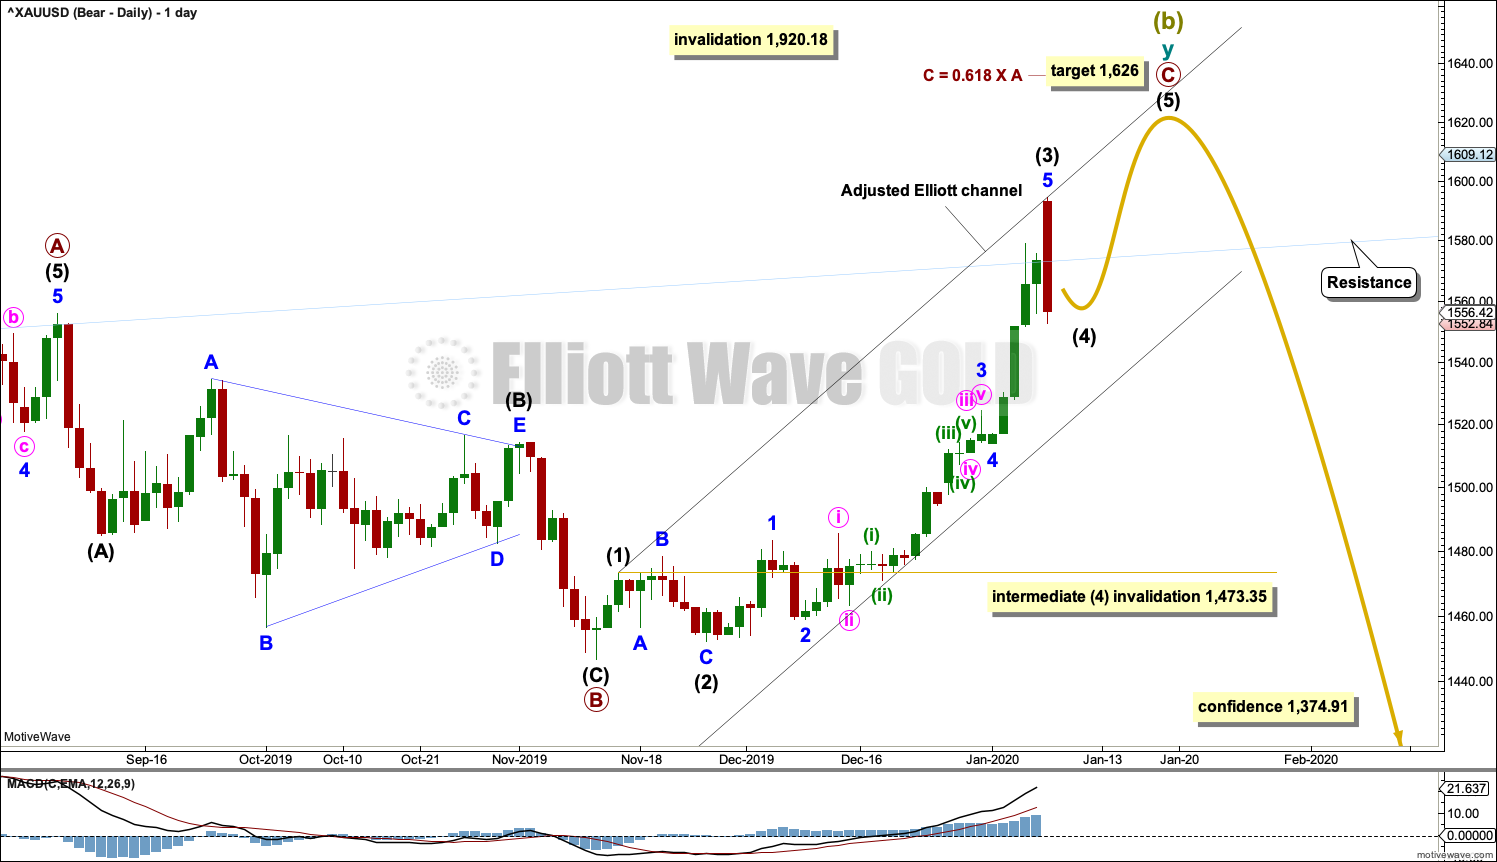
The double zigzag for Super Cycle wave (b) is incomplete.
Within cycle wave y, primary waves A and B are complete. Primary wave C must complete as a five wave structure. It is unfolding as an impulse. Within the impulse, intermediate waves (1) to (3) may now be complete.
Intermediate wave (2) was a deep 0.79 zigzag, which lasted 8 sessions. Given the guideline of alternation, intermediate wave (4) would least likely unfold as a zigzag and most likely unfold as either a flat, combination or triangle. Intermediate wave (4) would most likely be shallow. It may last about a Fibonacci 5 or 8 sessions.
Intermediate wave (4) may not move into intermediate wave (1) price territory below 1,473.35.
Drawn an Elliott channel about primary wave C and then pull the lower edge down to contain all of primary wave C. The lower edge may provide support to intermediate wave (4). Copy this channel over to hourly charts.
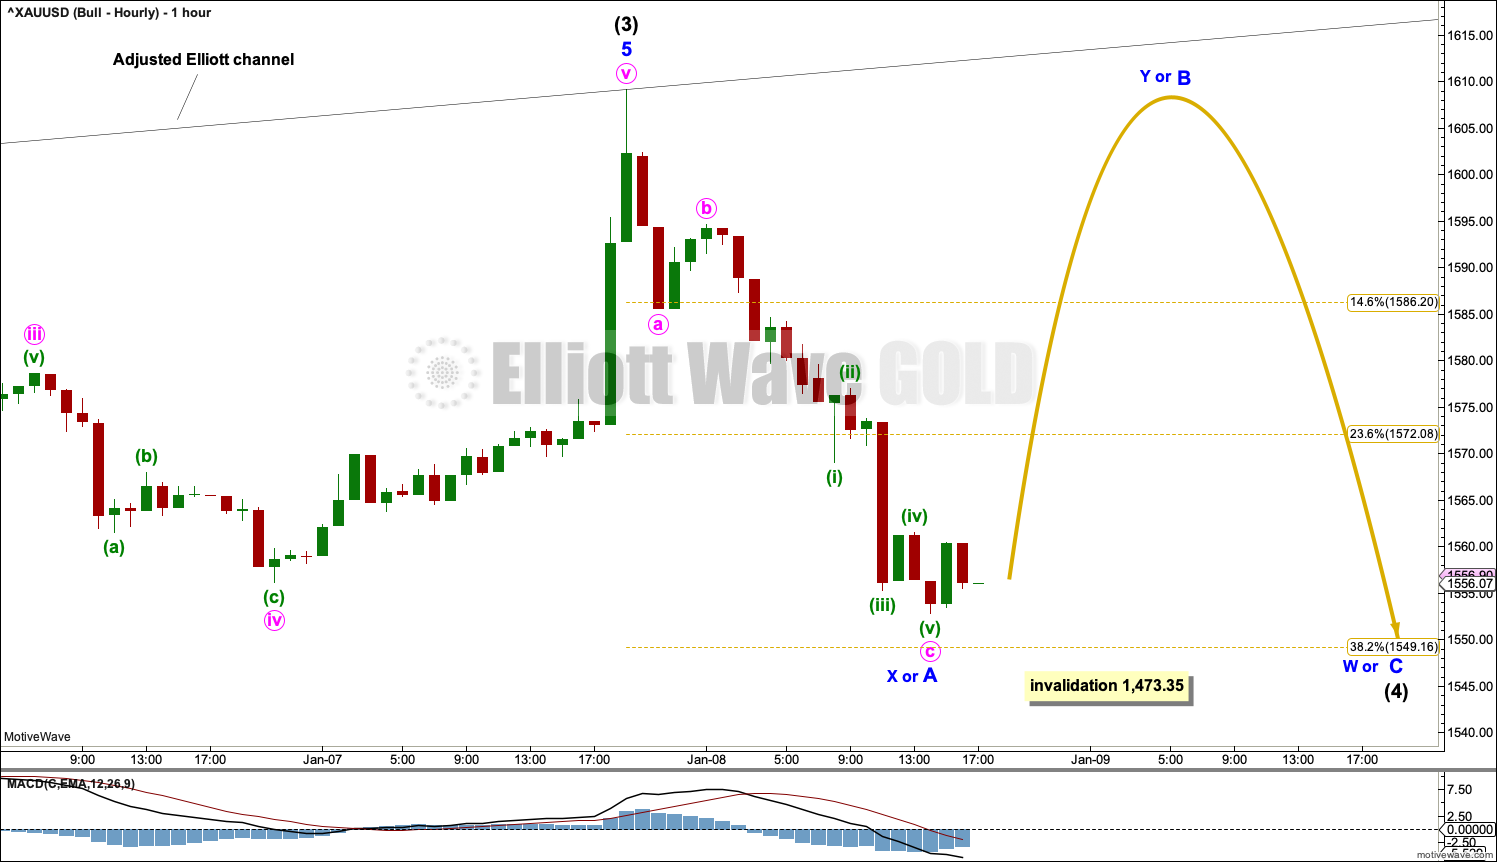
HOURLY CHART

Click chart to enlarge.
Intermediate wave (4) would most likely unfold as one of either a flat, combination or triangle. Within all these corrective structures, the first wave down would subdivide as a three, most likely a zigzag. This may now be complete and is labelled minor wave A or W.
If intermediate wave (4) unfolds as any one of an expanded flat, running triangle or combination, then within it minor wave B or X may make a new price extreme beyond the start of minor wave A or W.
At this stage, it is impossible to tell which of several structures intermediate wave (4) may be. Focus over the next few sessions will be not on identifying each swing within intermediate wave (4) but on identifying when it may be complete. This main wave count expects it to be followed by an upwards breakout to a new high with a target at 1,626.
ALTERNATE DAILY CHART
Click chart to enlarge.
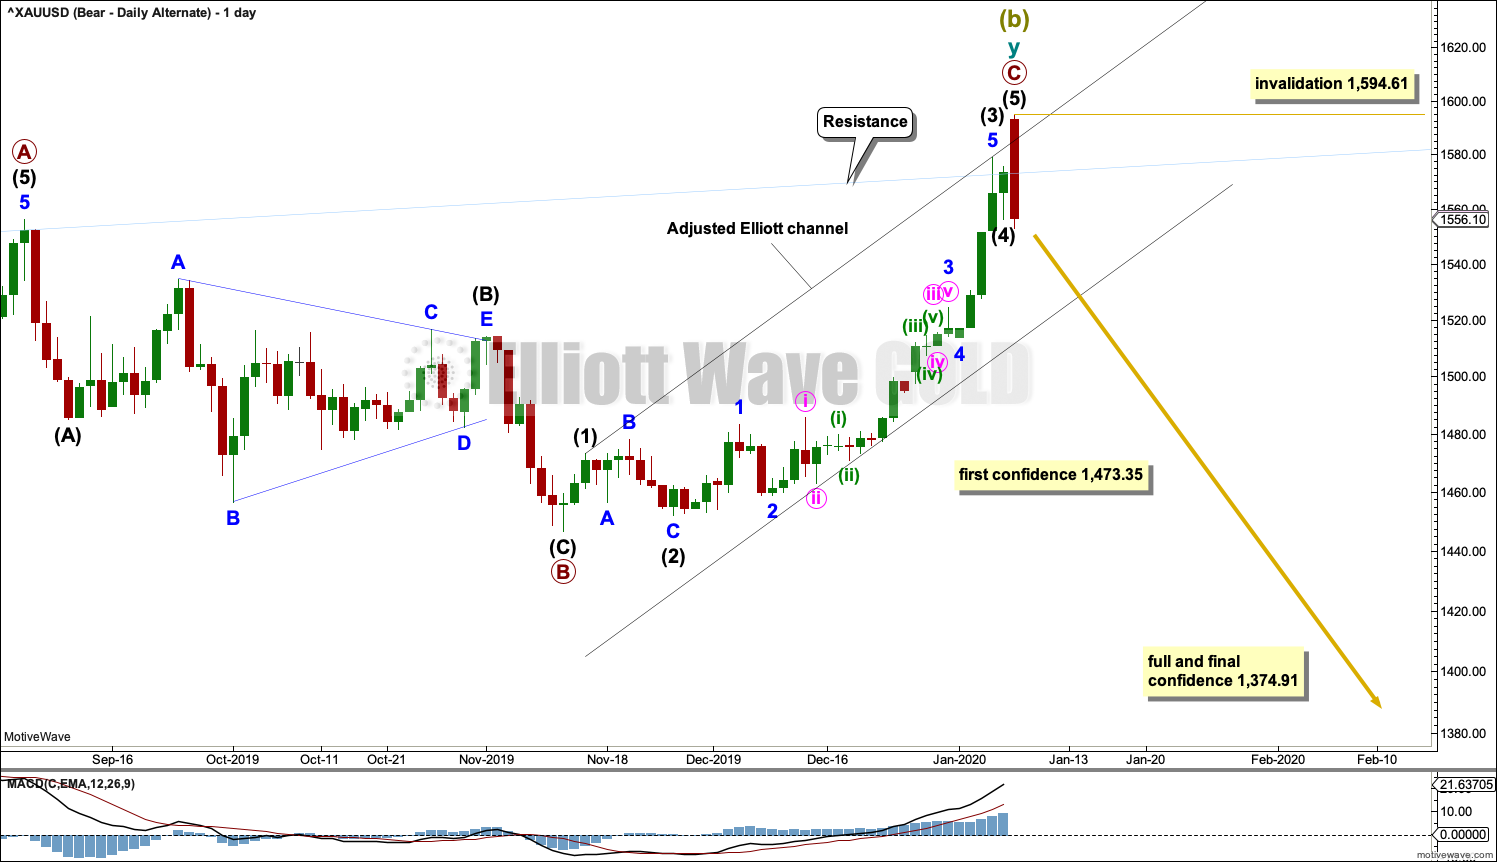
Alternatively, it is possible again that Super Cycle wave (b) may be complete and the bear market for Gold may have resumed in the last 24 hours.
A new low below 1,473.35 would invalidate the main bearish wave count and add some confidence in this alternate. Thereafter, a new low by any amount at any time frame below 1,374.91 would invalidate the bullish wave count below and add full and final confidence in this wave count. Targets for Super Cycle wave (c) would be calculated at that stage.
BULLISH ELLIOTT WAVE COUNT
WEEKLY CHART
Click chart to enlarge.
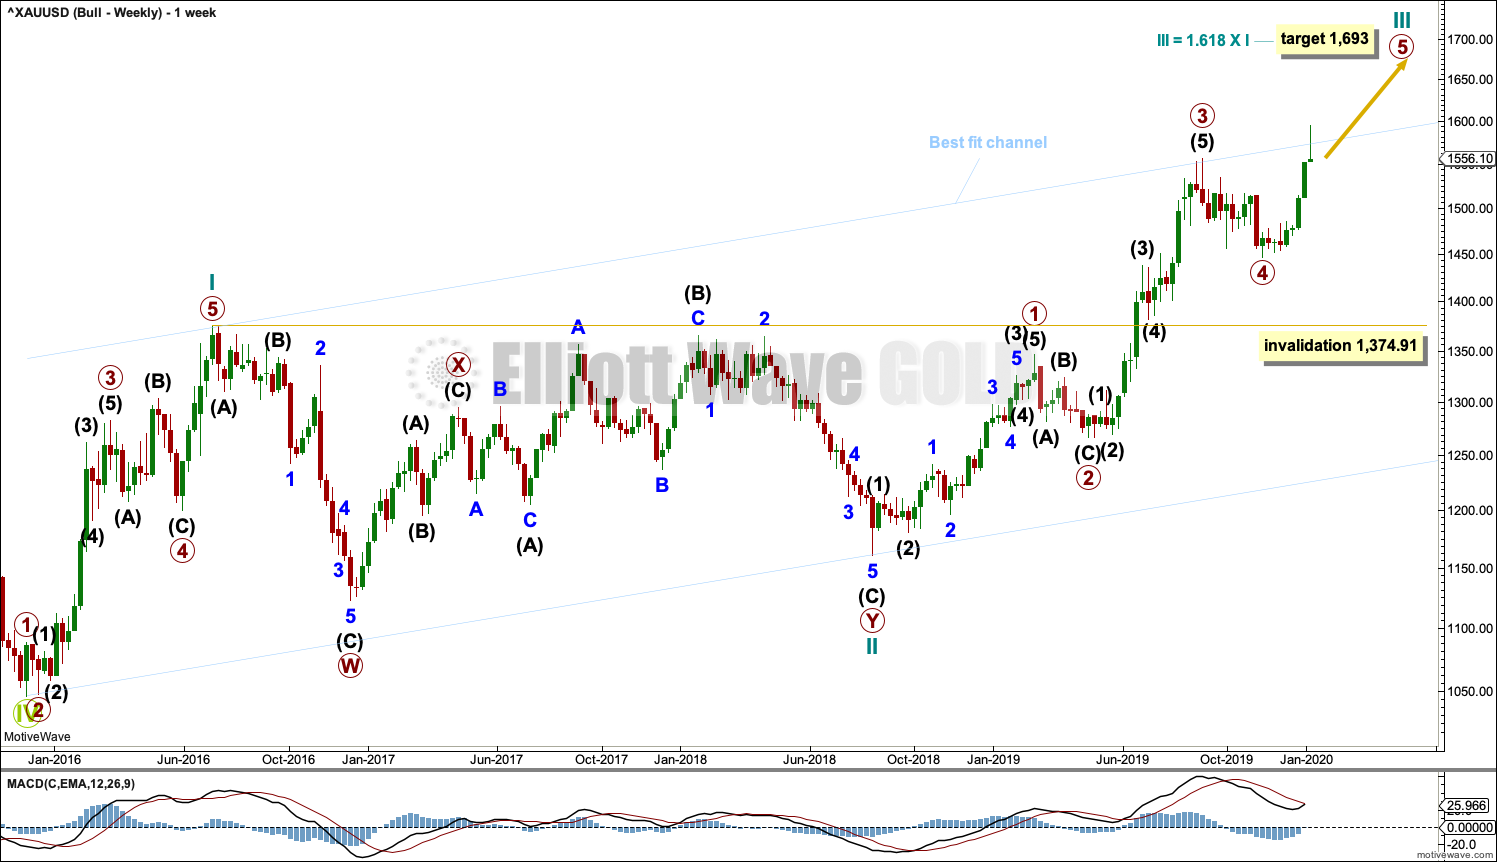
This wave count sees the the bear market complete at the last major low for Gold in November 2015.
If Gold is in a new bull market, then it should begin with a five wave structure upwards on the weekly chart. However, the biggest problem with this wave count is the structure labelled cycle wave I because this wave count must see it as a five wave structure, but it looks more like a three wave structure.
Commodities often exhibit swift strong fifth waves that force the fourth wave corrections coming just prior and just after to be more brief and shallow than their counterpart second waves. It is unusual for a commodity to exhibit a quick second wave and a more time consuming fourth wave, and this is how cycle wave I is labelled. This wave count still suffers from this very substantial problem, which is one reason why the bearish wave count is preferred because it has a better fit in terms of Elliott wave structure.
Cycle wave II subdivides well as a double combination: zigzag – X – expanded flat.
Cycle wave III may have begun. Within cycle wave III, primary waves 1 through to 4 may now be complete. Primary wave 5 may be complete at any stage now; this would complete the whole structure of cycle wave III. Cycle wave IV may not move into cycle wave I price territory below 1,374.91.
Add the wide best fit channel to weekly and daily charts.
DAILY CHART
Click chart to enlarge.
A target for cycle wave III is calculated also now at primary degree. If price reaches the first target and keeps rising, then the second higher target may be used.
Primary wave 5 may only subdivide as a five wave structure, most likely an impulse. Within primary wave 5, intermediate waves (1) through to (3) may now be complete. Intermediate wave (4) may not move into intermediate wave (1) price territory below 1,473.35.
Draw an Elliott channel about primary wave 5. Intermediate wave (4) may find support at the lower edge.
This wave count for the next few weeks remains essentially the same as the main bearish wave count. Both wave counts are seeing a fourth wave unfold, to then be followed by a final fifth wave up.
HOURLY CHART
Click chart to enlarge.
Hourly charts for the main bearish and this bullish wave count are the same.
TECHNICAL ANALYSIS
WEEKLY CHART
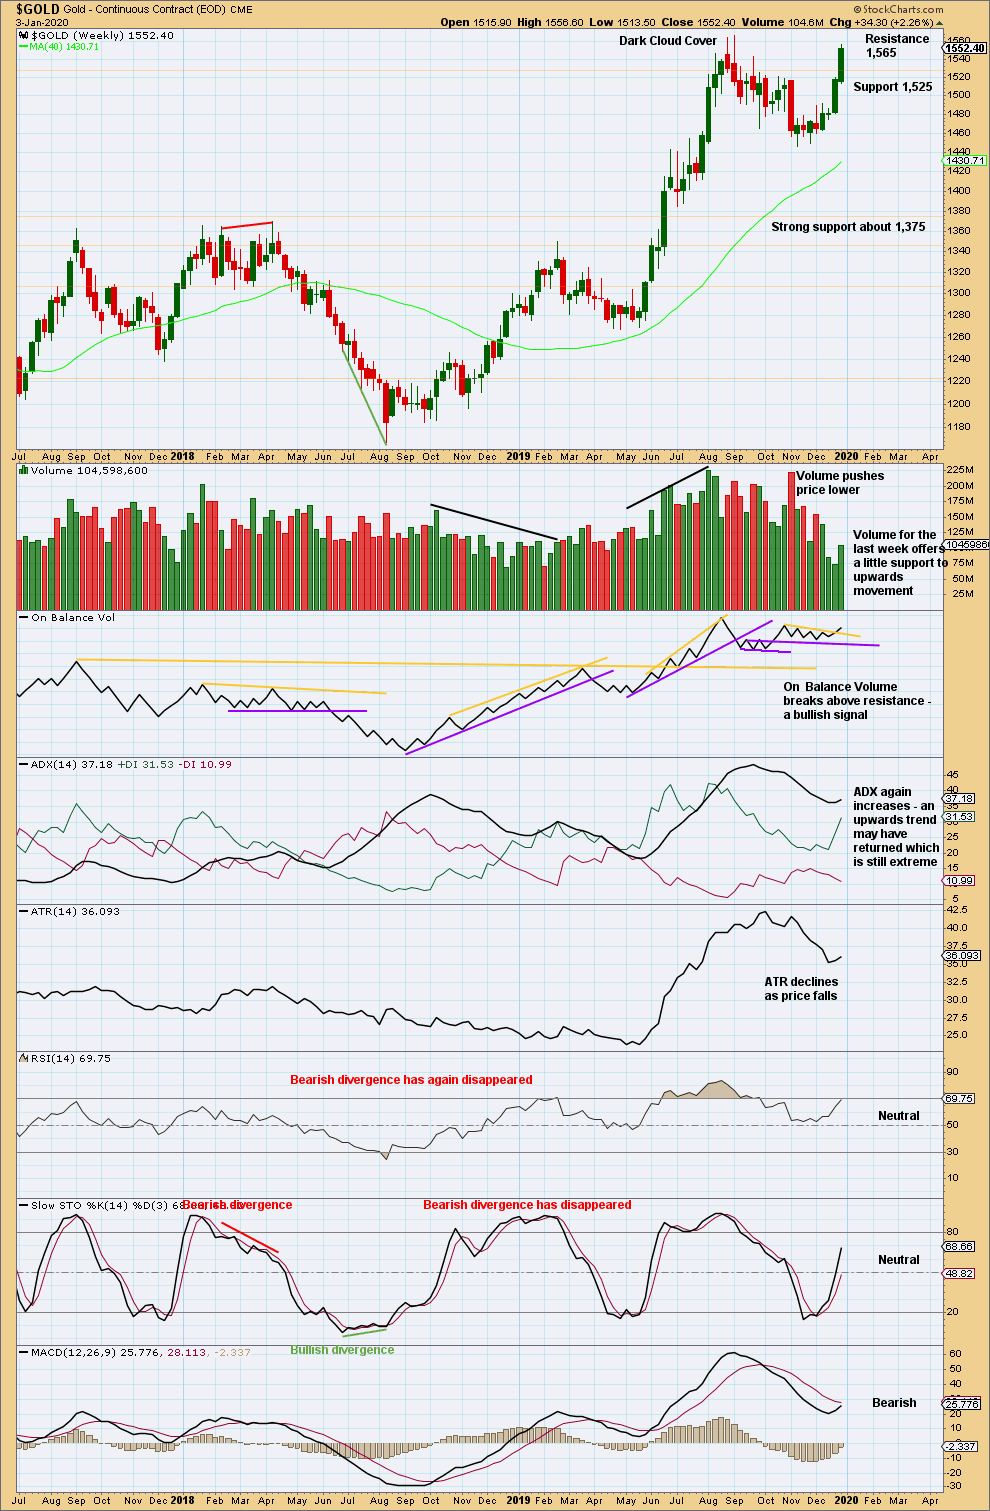
Click chart to enlarge. Chart courtesy of StockCharts.com.
Upwards movement continues. A bullish signal from On Balance Volume and some support last week from volume suggest upwards movement may continue further to resistance above at 1,565.
DAILY CHART
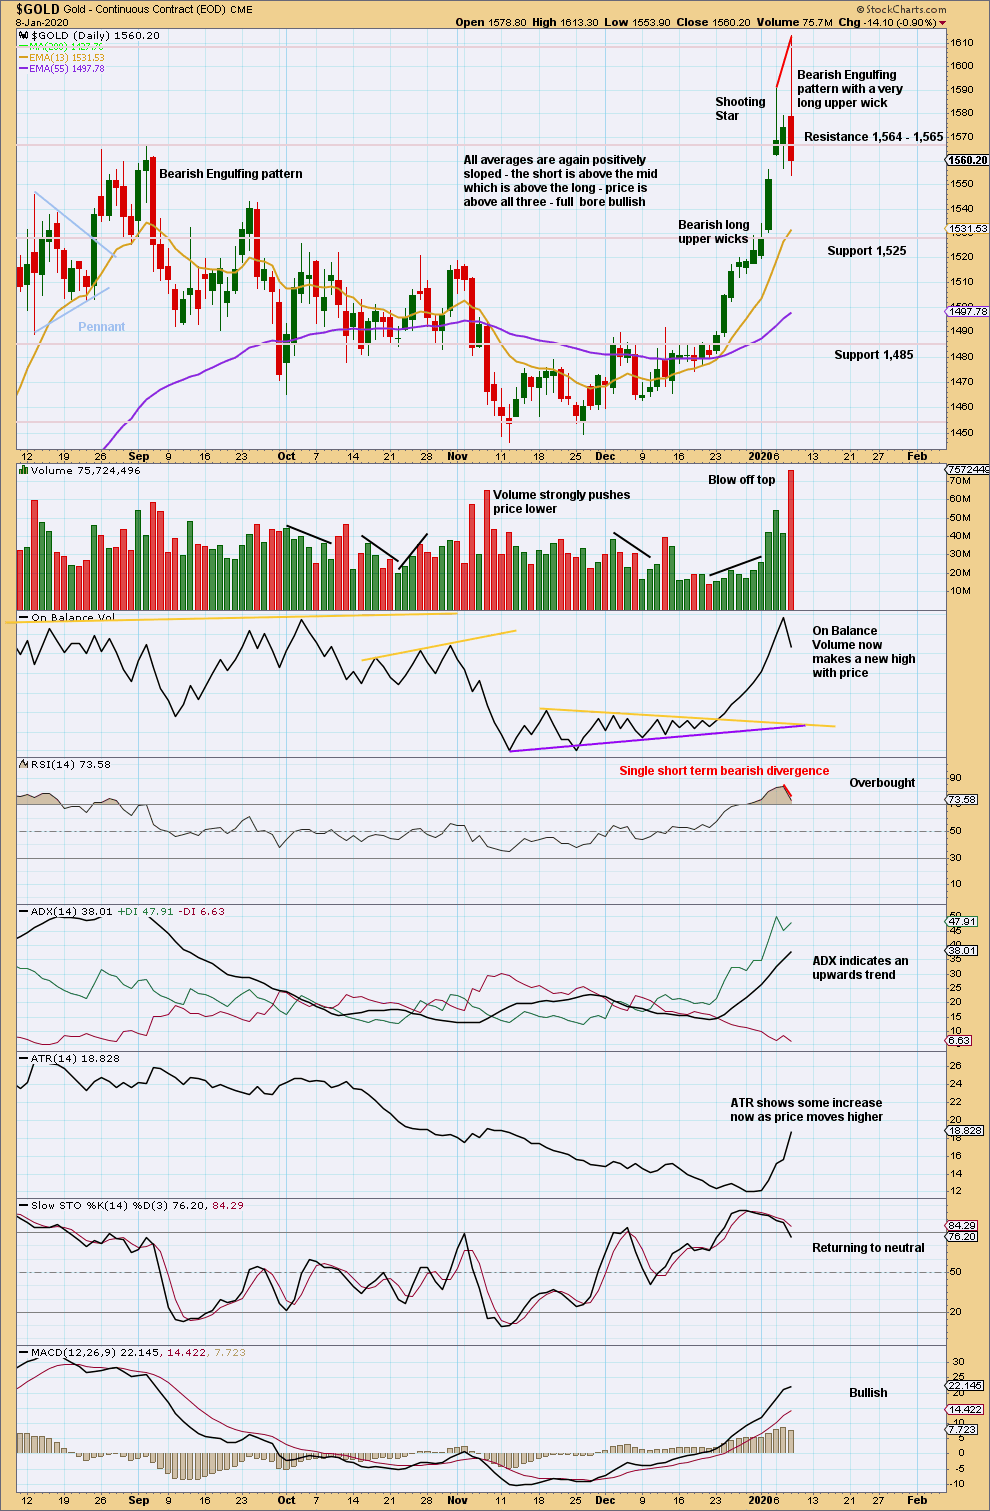
Click chart to enlarge. Chart courtesy of StockCharts.com.
Now two long upper wicks in the last three candlesticks along with a very strong Bearish Engulfing pattern strongly suggest a trend change here.
GDX WEEKLY CHART
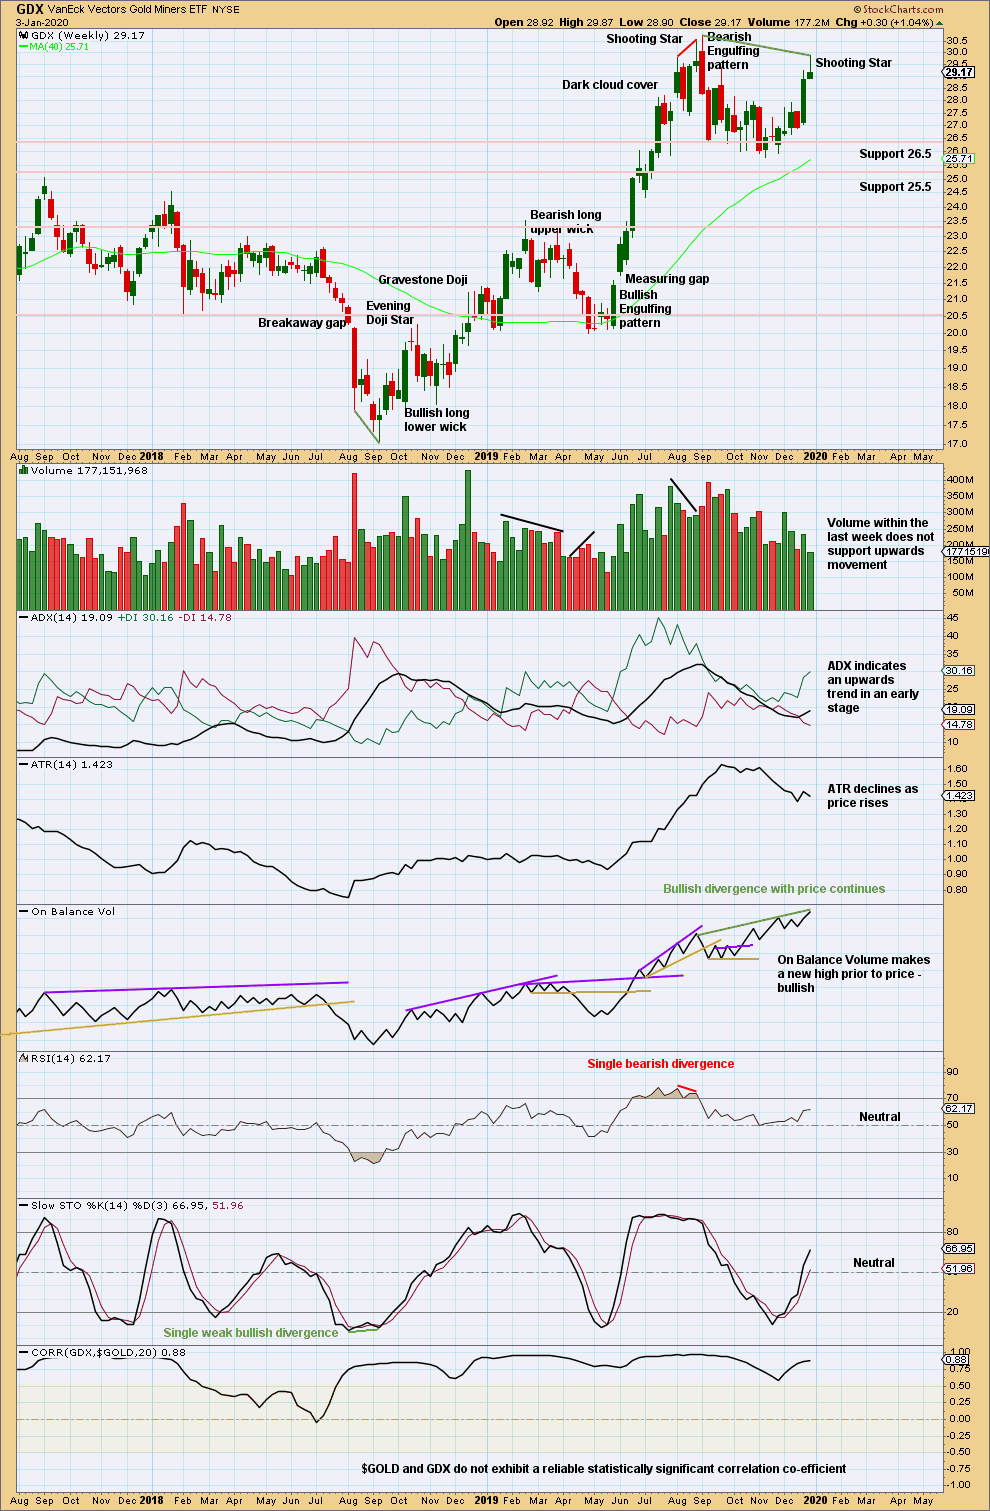
Click chart to enlarge. Chart courtesy of StockCharts.com.
A shooting star with declining volume last week suggests a consolidation may develop here for GDX.
Friday saw price move very strongly higher for Gold but overall lower for GDX. This is a perfect illustration of the lack of positive correlation between these two markets and why it is dangerous to assume that they must move in the same direction. The correlation co-efficient is added to the bottom of this chart to illustrate the data shows that any correlation that these two markets may have is unreliable.
GDX DAILY CHART
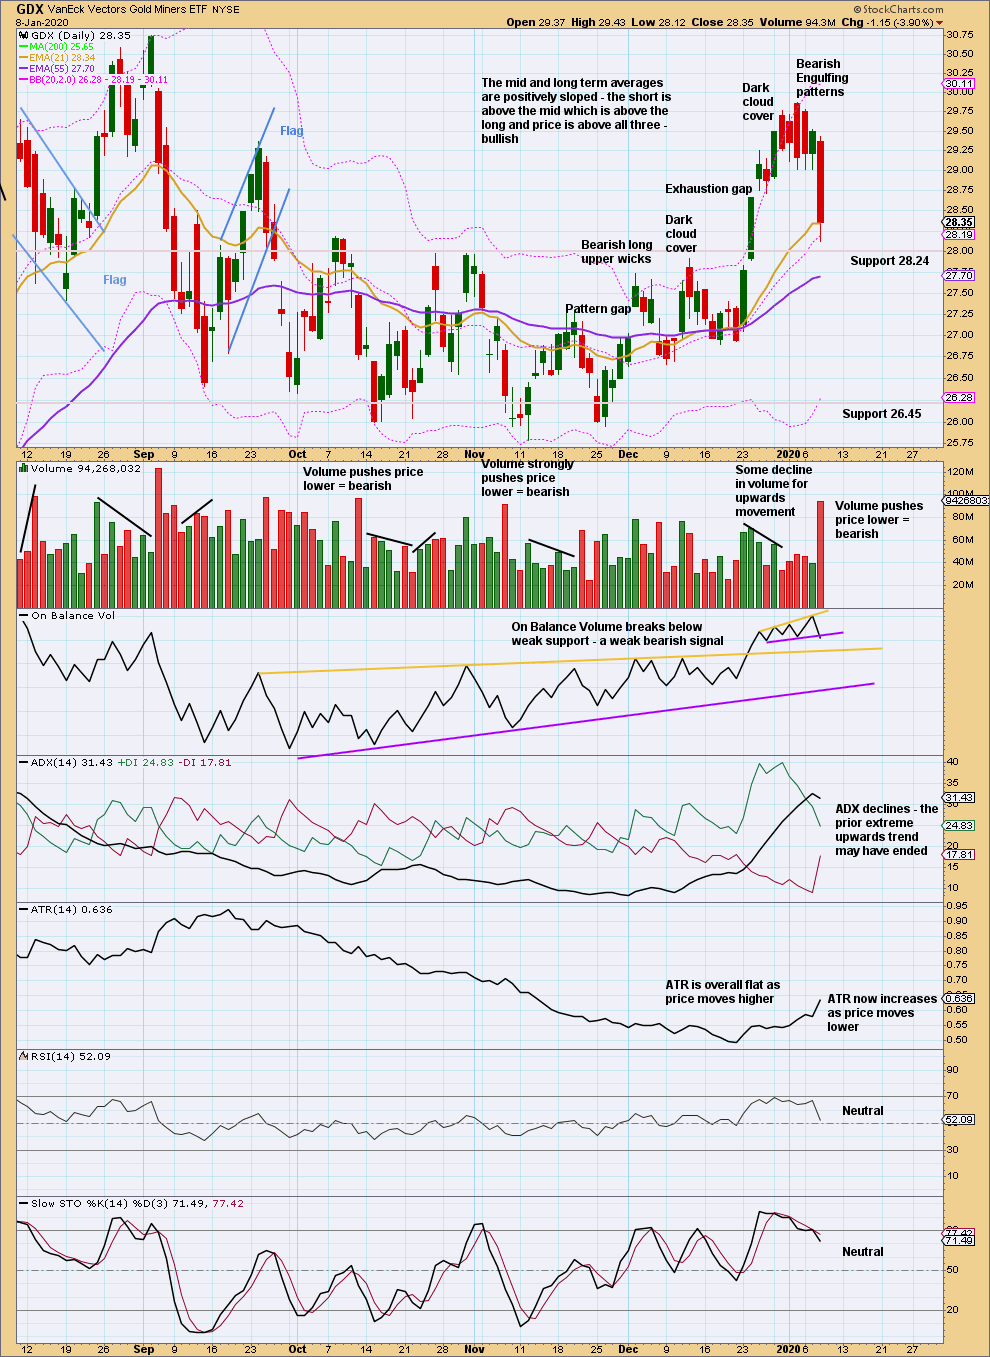
Click chart to enlarge. Chart courtesy of StockCharts.com.
A very strong bearish candlestick today after an extreme upwards trend, along with closure of the last gap (now renamed an exhaustion gap), a bearish signal from On Balance Volume and a strong push from volume today, strongly suggests GDX has found a high.
Published @ 06:18 p.m. EST.
—
Careful risk management protects your trading account(s).
Follow my two Golden Rules:
1. Always trade with stops.
2. Risk only 1-5% of equity on any one trade.
—
New updates to this analysis are in bold.
Hourly chart updated:
I have relabelled minor wave A, it has a good fit and looks right.
Intermediate (4) is essentially expected to be a wide ranging consolidation, with choppy overlapping swings from support to resistance and back again. To last a total of 5 or 8 sessions (Gold often exhibits Fibonacci durations) and be followed by a relatively short sharp upwards breakout, before a trend change.
Phew! That’s actually quite specific. That’s still my preferred / main wave count, it has support from classic TA and when I look at Super Cycle (b) on the monthly chart it still looks most likely to be incomplete at the low of December 2015.
Bear count will remain as main wave count ti it gets invalidated at 1923.
From bottom of 1045 in Dec 2015 in last four years gold has retraced 63% at $1600.
Gold yet may still go higher to +1880. That will leave sufficient space for it to drop to close below 1045 for cycle wave c to be = to cycle wave a below $1045 .
OR after 6- 7 years from 2015 gold may clear $1923 and new gold bull trend will be born.
I wonder what will be the target for gold once the bear wave count is discarded ?
Lara Clarity of your EW analysis is great and highly appreciated. Great work! Thanks.
Thank you Papudi.
A target for the bear count (if it turns out to be the correct count, price will tell us if it can make a new low below 1,374.91) would be reasonably below 1,046.27.
The surf today in the Catlins is HUGE and the wind is very strong, so no surf for me today. But we did get in a nice bush walk today. This is the rainforest in the deep South of the South Island, looking very Lord of the Rings.
Wonderfull landscape. I can see Mr. Frodo walking around. Enjoy!!
Beautiful pics of The Catlins, Tautuku Bay yesterday and The South Island rainforest. Luv it.
BTW – Happy New Year!! 🙂
🤩 Amazing
Hi Lara
So, if Gold has already started to turn bear again (alternative count) … Where does that leave Silver – is there a new alternative for that too ?
The alternate bear count for Gold would essentially require Gold and Silver to have highs separated by some weeks or months.