
GOLD: Elliott Wave and Technical Analysis | Charts – January 20, 2020
With markets in the USA closed today for Martin Luther King Jr. Day, the analysis remains the same.
Summary: A consolidation to last a Fibonacci 13 sessions (and so end on the 27th of January) and find support about the lower edge of the adjusted Elliott channel on daily charts is expected to be underway. Thereafter, more upwards movement may be a final thrust before a bear market resumes.
A bullish wave count expects a third wave is ending here or very soon. The target is 1,635 or 1,693.
An alternate bearish wave count looks at the possibility that Gold has just seen a Super Cycle degree trend change. Confidence in this idea may be had with a new low below 1,473.36. Full and final confidence would be had if price makes a new low below 1,374.91.
Grand SuperCycle analysis is here.
Monthly charts were last updated here.
BEARISH ELLIOTT WAVE COUNT
WEEKLY CHART
Click chart to enlarge.
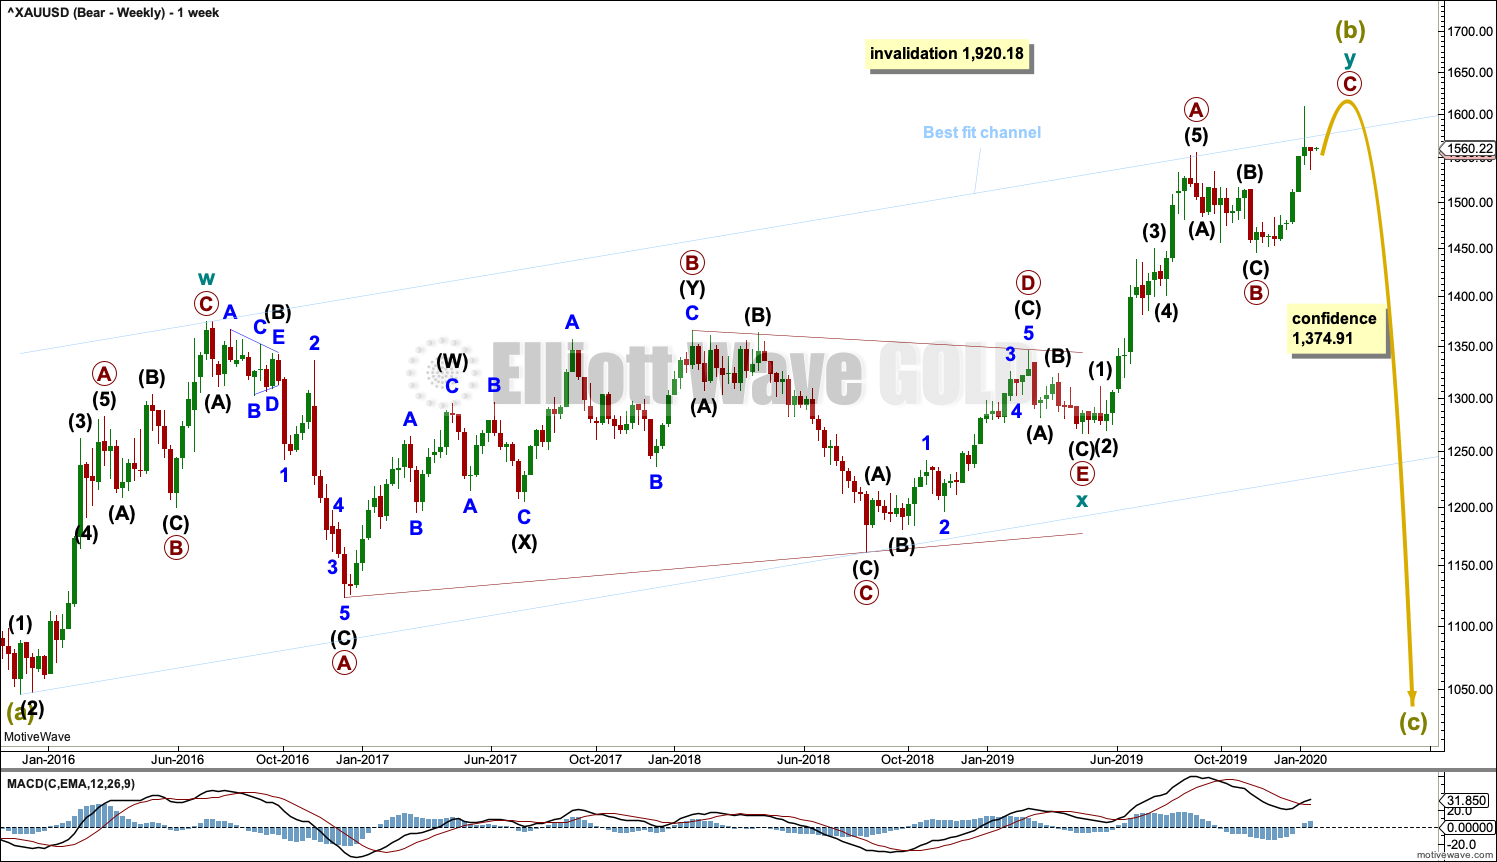
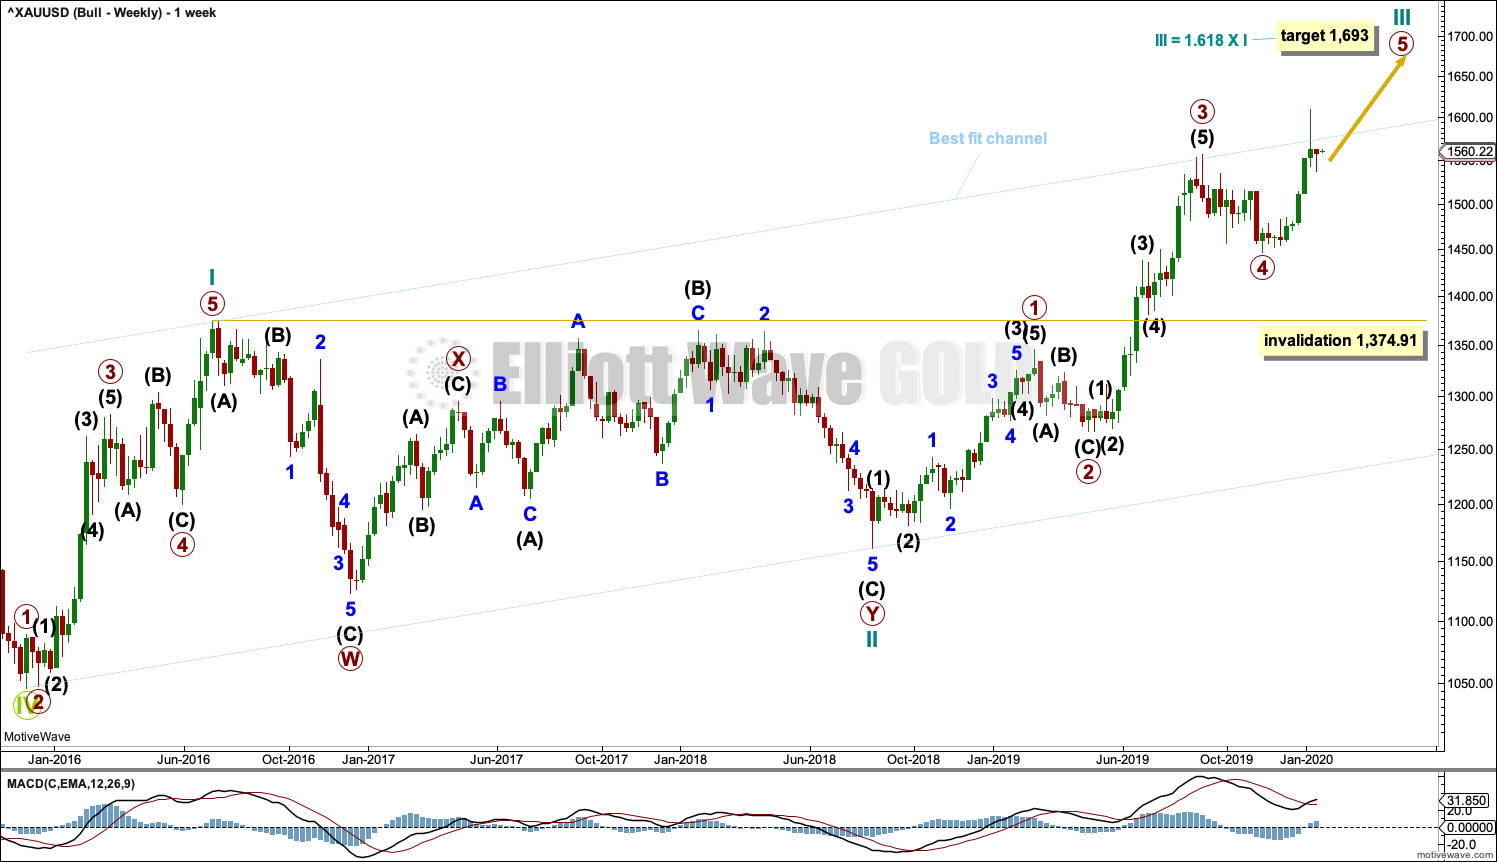
Super Cycle wave (b) may still be an incomplete double zigzag, requiring one more high.
The first zigzag in the double is labelled cycle wave w. The double is joined by a three in the opposite direction, a triangle labelled cycle wave x. The second zigzag in the double is labelled cycle wave y.
The purpose of the second zigzag in a double is to deepen the correction. Cycle wave y has achieved this purpose.
After the structure of cycle wave y may be complete, then a new low below 1,374.91 would add strong confidence to this wave count. At that stage, the bullish Elliott wave count would be invalidated. At that stage, targets for Super Cycle wave (c) would be calculated.
A wide best fit channel is added in light blue. Copy this channel over to daily charts. The upper edge of this channel was breached, but now price has returned strongly to within the channel.
DAILY CHART
Click chart to enlarge.
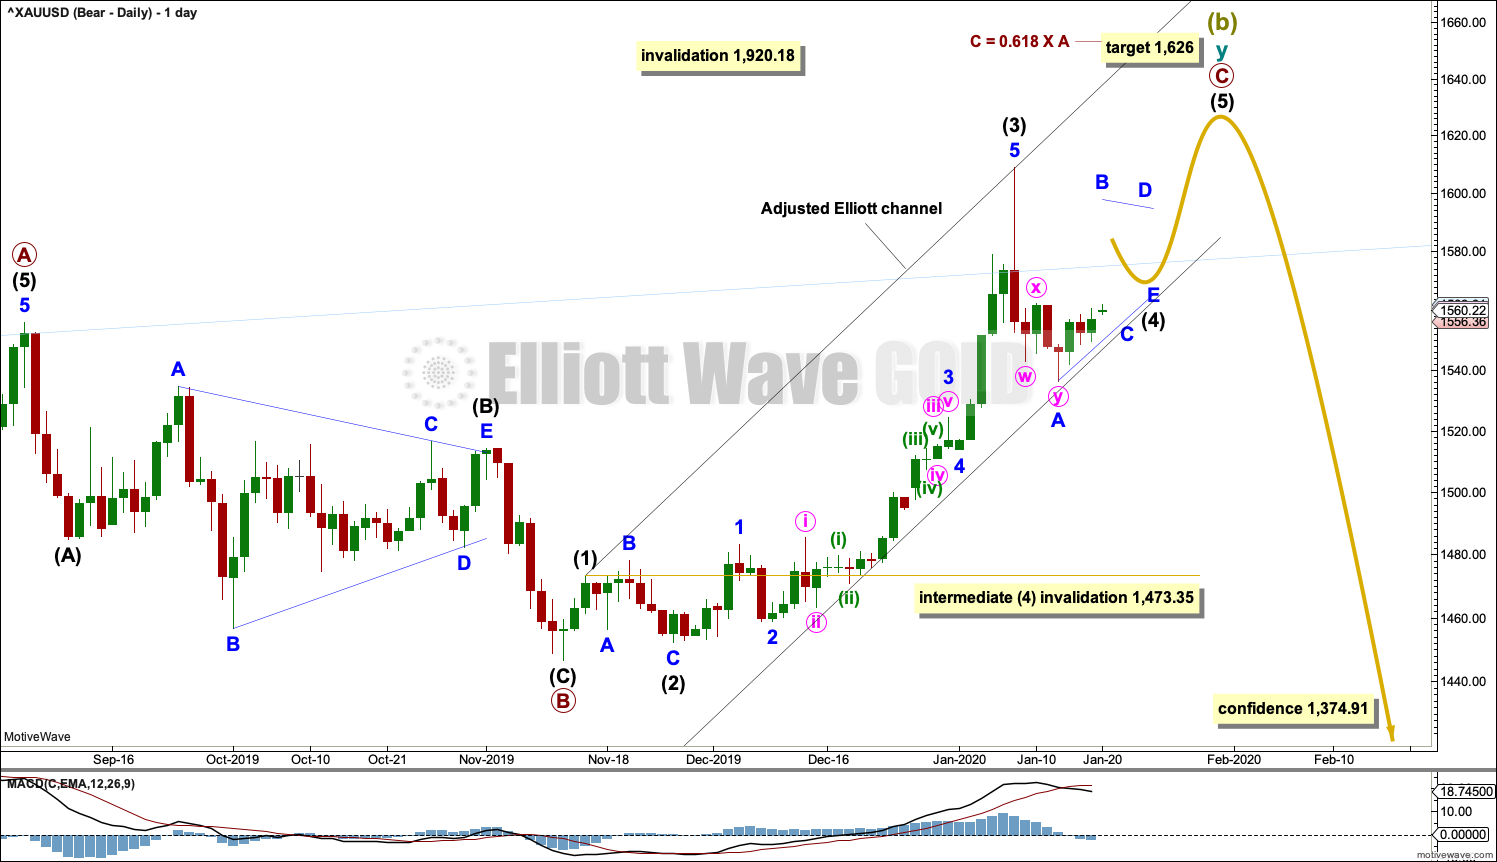
The double zigzag for Super Cycle wave (b) may be still incomplete.
Within cycle wave y, primary waves A and B are complete. Primary wave C must complete as a five wave structure. It is unfolding as an impulse. Within the impulse, intermediate waves (1) to (3) may now be complete.
Intermediate wave (2) was a deep 0.79 zigzag, which lasted 8 sessions. Given the guideline of alternation, intermediate wave (4) would least likely unfold as a zigzag and most likely unfold as either a flat, combination or triangle. Intermediate wave (4) would most likely be shallow. It may last about a Fibonacci 13 sessions ending on the 27th of January.
Intermediate wave (4) may not move into intermediate wave (1) price territory below 1,473.35.
Drawn an Elliott channel about primary wave C and then pull the lower edge down to contain all of primary wave C. The lower edge may provide support to intermediate wave (4). Copy this channel over to hourly charts.
Intermediate wave (4) may subdivide as any one of several Elliott wave structures. Today on the bearish wave count a triangle will be considered. It is still too early to know which structure intermediate wave (4) may be, so this labelling may change. A flat correction would also work, which is outlined on the bullish Elliott wave count below.
HOURLY CHART
Click chart to enlarge.
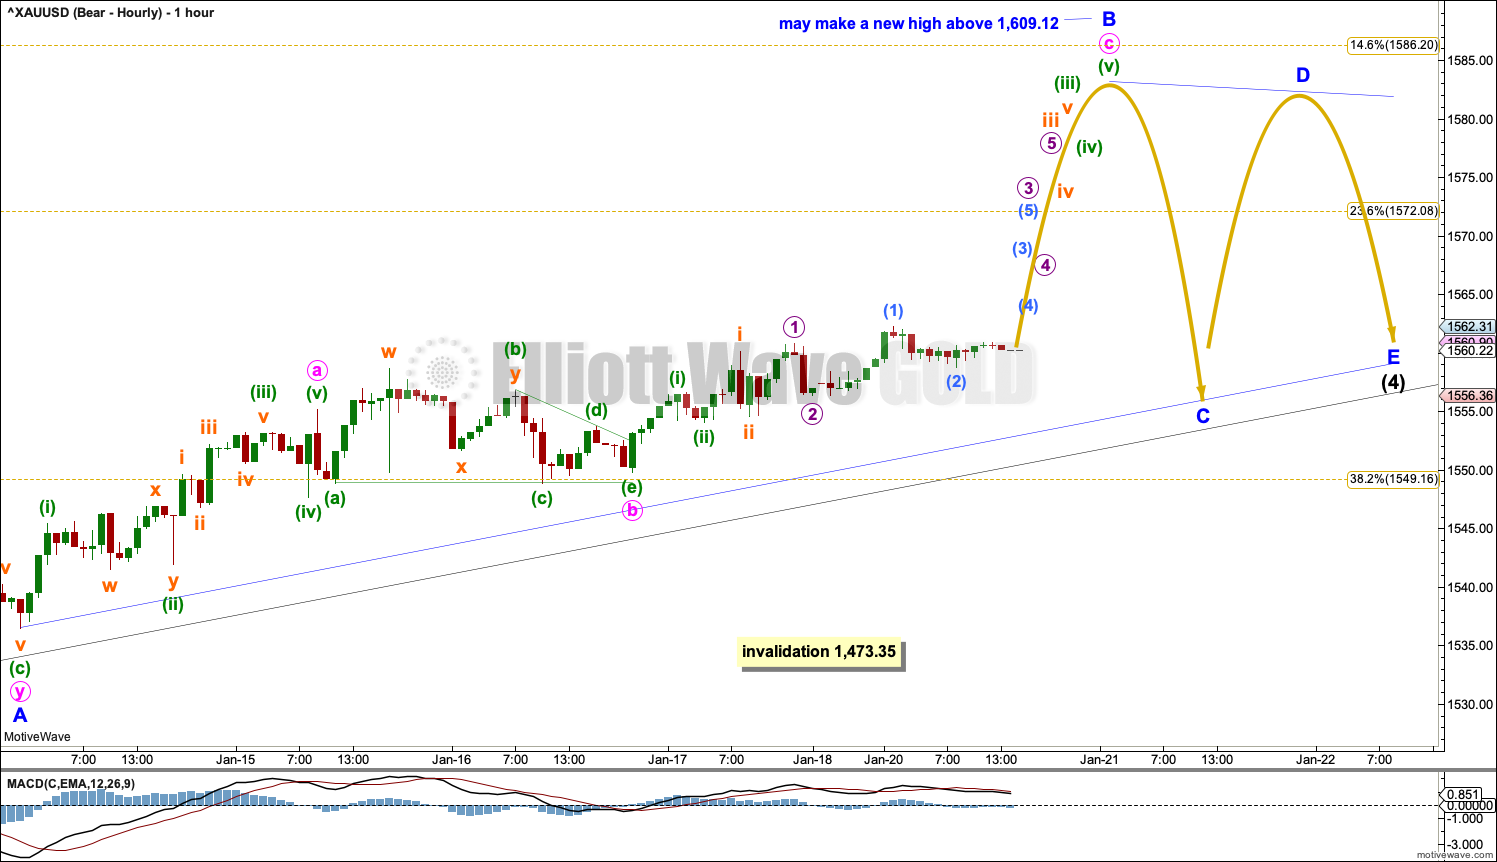
Intermediate wave (4) would most likely unfold as one of either a flat, combination or triangle. Within all these corrective structures, the first wave down would subdivide as a three, most likely a zigzag. This may now be complete and is labelled minor wave A.
Today, on this hourly chart, intermediate wave (4) is labelled as a possible Elliott wave triangle.
Within the five sub-waves of an Elliott wave triangle, one sub-wave usually subdivides as a multiple. This is most commonly wave D, but it may be any sub-wave. In this instance, it may have been minor wave A as a double zigzag.
Minor wave B may now continue higher. Minor wave B must subdivide as a simple corrective structure, and it may make a new high above the start of minor wave A at 1,609.12 as in a running triangle. Within minor wave B, minute waves a and b may be complete. Minute wave c must subdivide as a five wave structure.
Thereafter, minor waves C, D and E should all sub-divide as simple corrective structures, moving price sideways in an ever decreasing range. If intermediate wave (4) subdivides as a triangle, then it may continue to find support at the lower edge of the black channel.
ALTERNATE DAILY CHART
Click chart to enlarge.
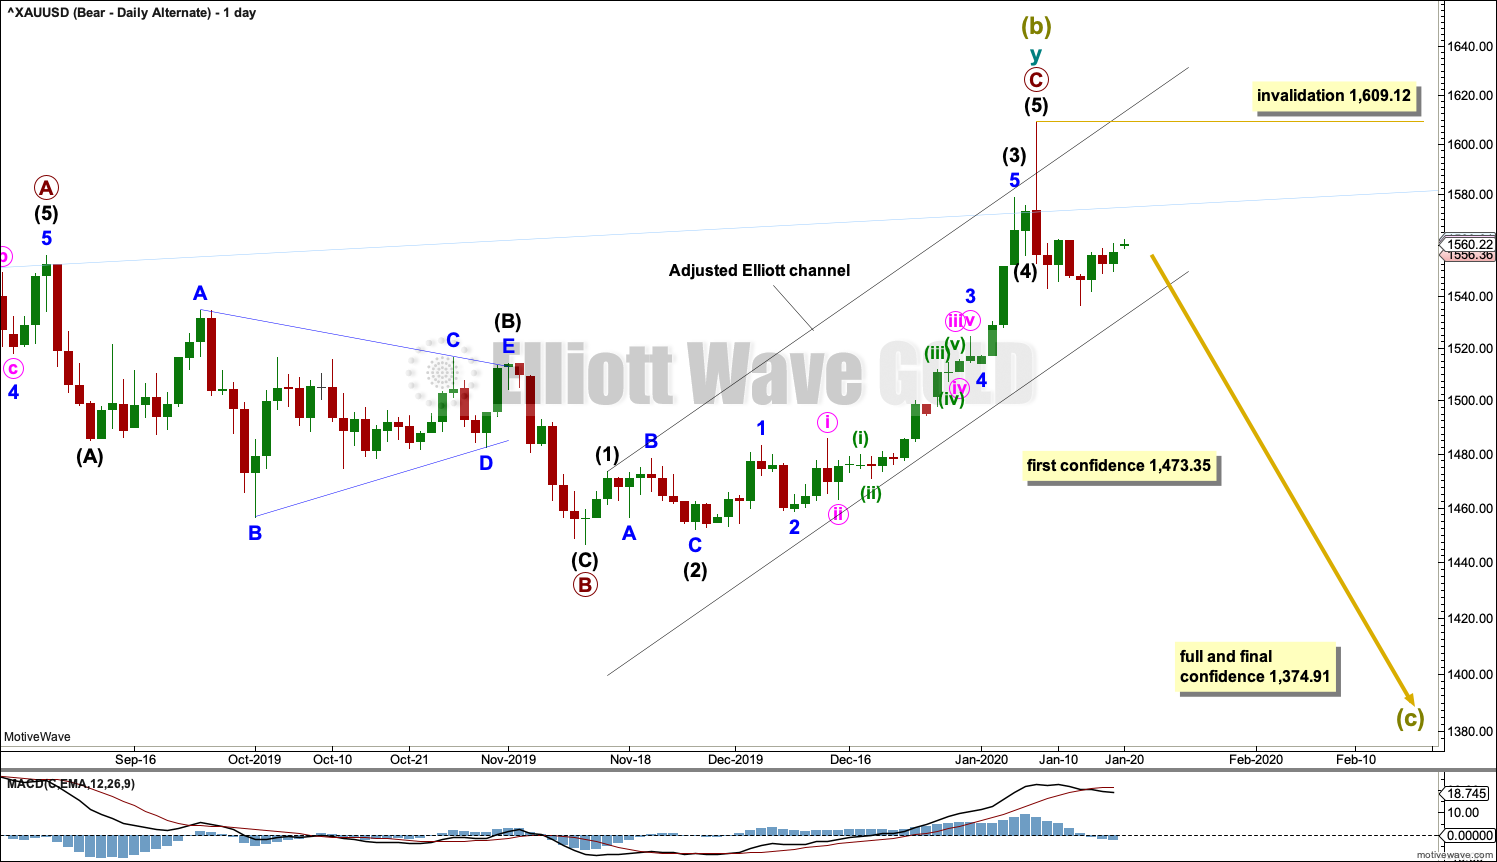
Alternatively, it is possible again that Super Cycle wave (b) may be complete and the bear market for Gold may have resumed.
A new low below 1,473.35 would invalidate the main bearish wave count and add some confidence in this alternate. Thereafter, a new low by any amount at any time frame below 1,374.91 would invalidate the bullish wave count below and add full and final confidence in this wave count. Targets for Super Cycle wave (c) would be calculated at that stage.
If Super Cycle wave (c) has begun, then it should develop a five wave structure downwards at the daily and weekly time frames. Within the first five down, no second wave correction may move beyond the start of its first wave above 1,609.12.
BULLISH ELLIOTT WAVE COUNT
WEEKLY CHART
Click chart to enlarge.
This wave count sees the the bear market complete at the last major low for Gold on 3 December 2015.
If Gold is in a new bull market, then it should begin with a five wave structure upwards on the weekly chart. However, the biggest problem with this wave count is the structure labelled cycle wave I because this wave count must see it as a five wave structure, but it looks more like a three wave structure.
Commodities often exhibit swift strong fifth waves that force the fourth wave corrections coming just prior and just after to be more brief and shallow than their counterpart second waves. It is unusual for a commodity to exhibit a quick second wave and a more time consuming fourth wave, and this is how cycle wave I is labelled. This wave count still suffers from this very substantial problem, which is one reason why the bearish wave count is preferred because it has a better fit in terms of Elliott wave structure.
Cycle wave II subdivides well as a double combination: zigzag – X – expanded flat.
Cycle wave III may have begun. Within cycle wave III, primary waves 1 through to 4 may now be complete. Primary wave 5 may be complete at any stage now; this would complete the whole structure of cycle wave III. Cycle wave IV may not move into cycle wave I price territory below 1,374.91.
Add the wide best fit channel to weekly and daily charts.
DAILY CHART
Click chart to enlarge.
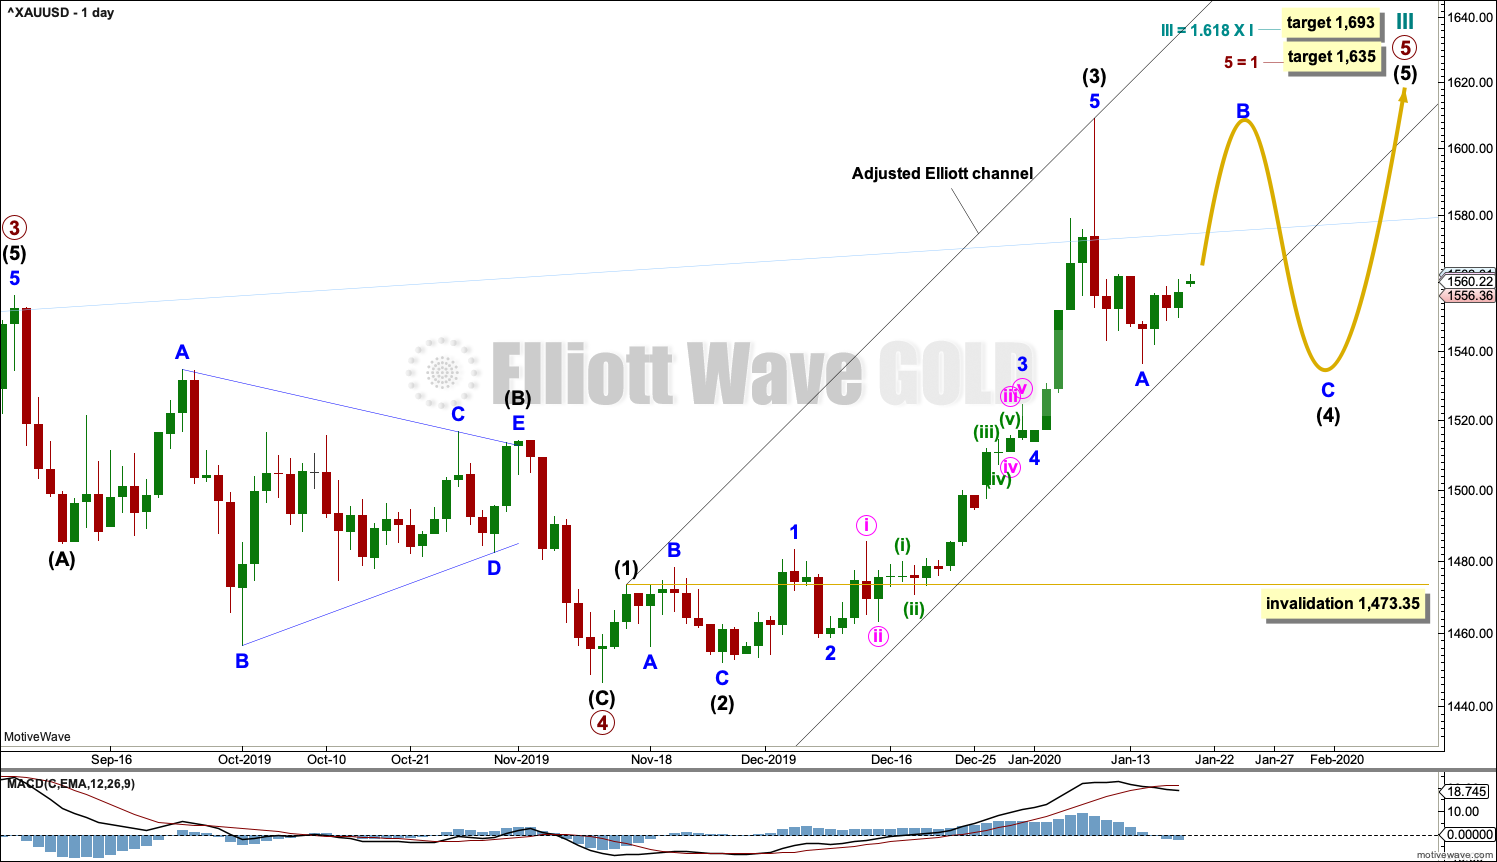
A target for cycle wave III is calculated also now at primary degree. If price reaches the first target and keeps rising, then the second higher target may be used.
Primary wave 5 may only subdivide as a five wave structure, most likely an impulse. Within primary wave 5, intermediate waves (1) through to (3) may now be complete. Intermediate wave (4) may not move into intermediate wave (1) price territory below 1,473.35.
Draw an adjusted Elliott channel about primary wave 5. Intermediate wave (4) may find support at the lower edge.
This wave count for the next few weeks remains essentially the same as the main bearish wave count. Both wave counts are seeing a fourth wave unfold, to then be followed by a final fifth wave up.
This bullish wave count today considers the possibility that intermediate wave (4) may subdivide as a flat correction. It may also subdivide as a triangle, which is outlined in the bearish wave count.
HOURLY CHART
Click chart to enlarge.
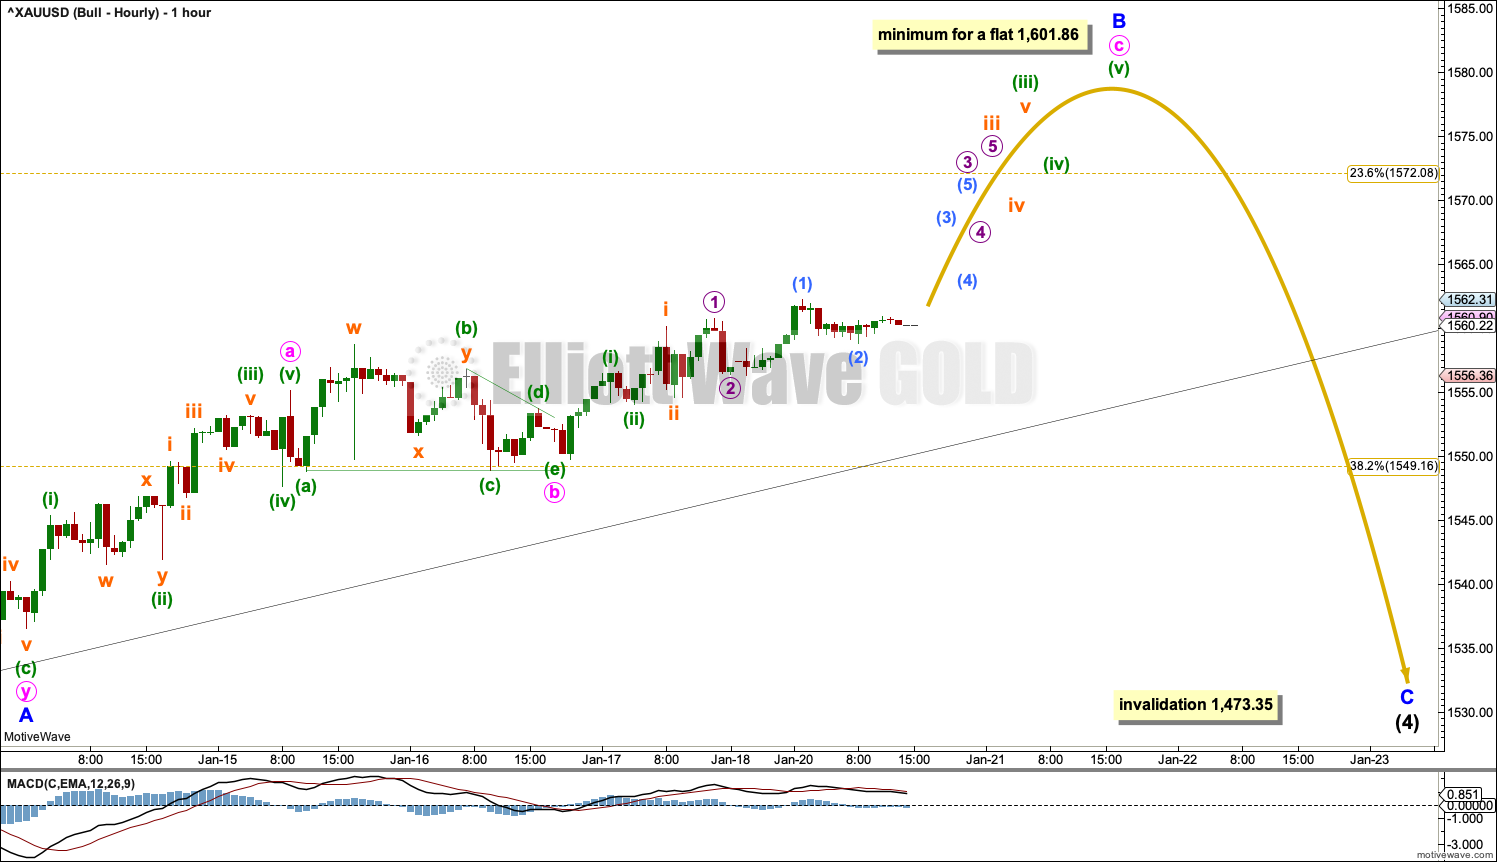
If intermediate wave (4) subdivides as a flat correction, then within it minor waves A and B must both subdivide as threes. Minor wave A may now be a completed double zigzag, which is classified as a three.
Minor wave B of a flat correction must now retrace a minimum 0.9 length of minor wave A at 1,601.86. The common range for minor wave B is from 1 to 1.38 times the length of minor wave A, giving a range from 1,609.12 to 1,636.71. Within minor wave B, minute waves a and b may be complete. Minute wave c must subdivide as a five wave structure.
Thereafter, minor wave C would be likely to make at least a slight new low below the end of minor wave A to avoid a truncation. This would see the black channel substantially breached, which would be acceptable.
A triangle works for this bullish wave count.
TECHNICAL ANALYSIS
StockCharts data is New York session only. With the NYSE closed today for Martin Luther King Jr. Day, there is no new data today to analyse.
WEEKLY CHART
Click chart to enlarge. Chart courtesy of StockCharts.com.
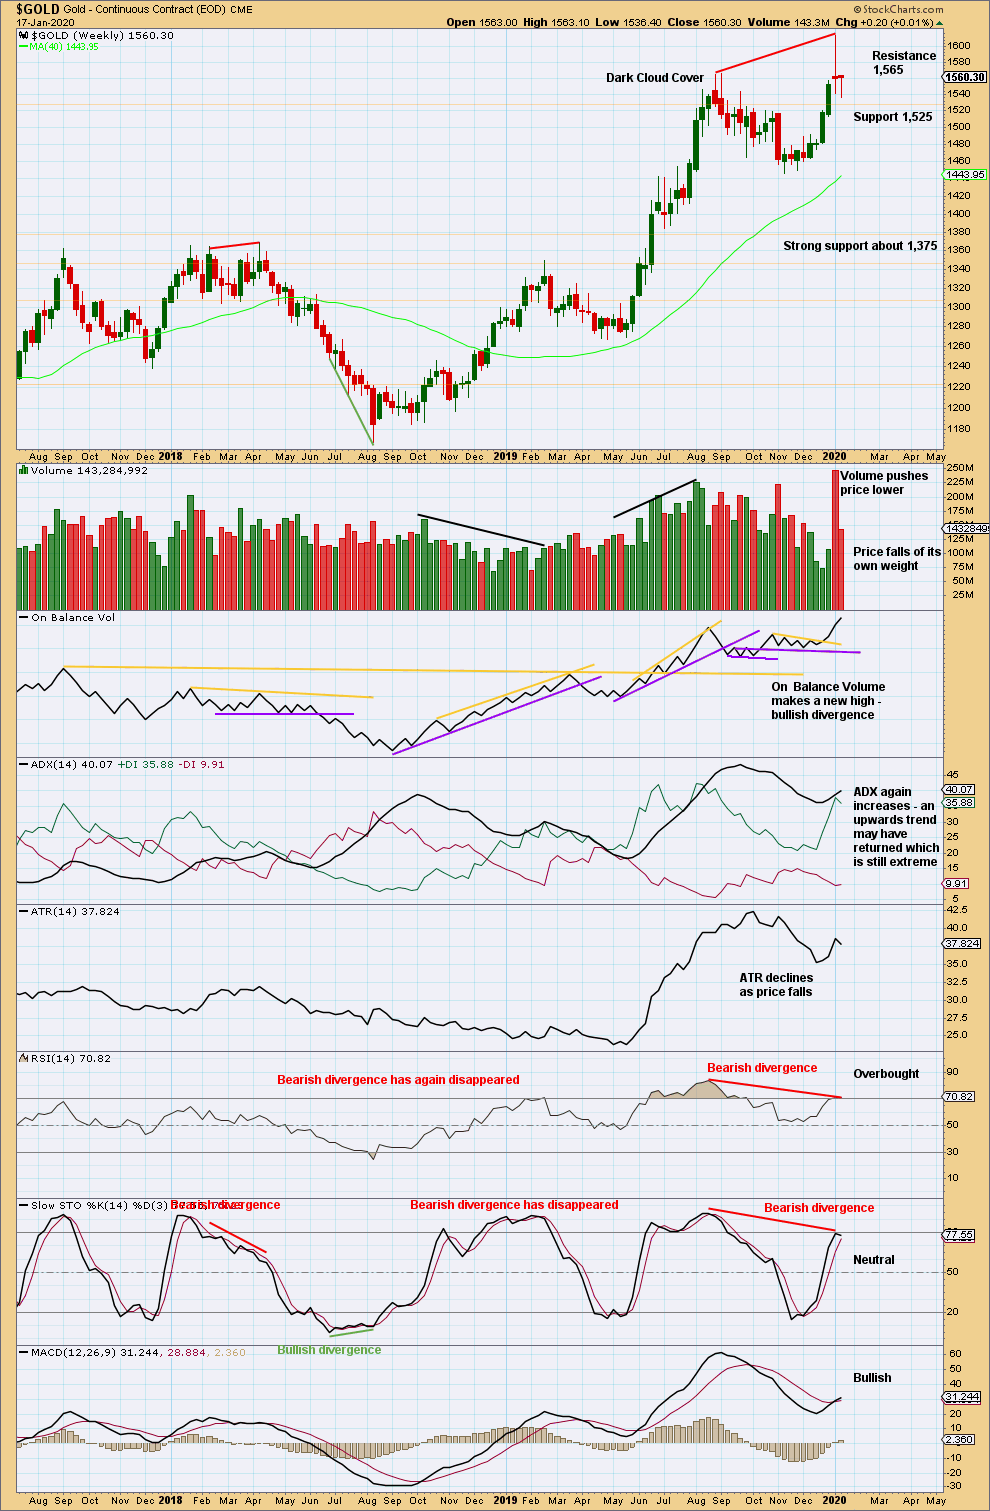
Weak volume, small range and a long lower wick this week all suggest a bounce next week.
DAILY CHART
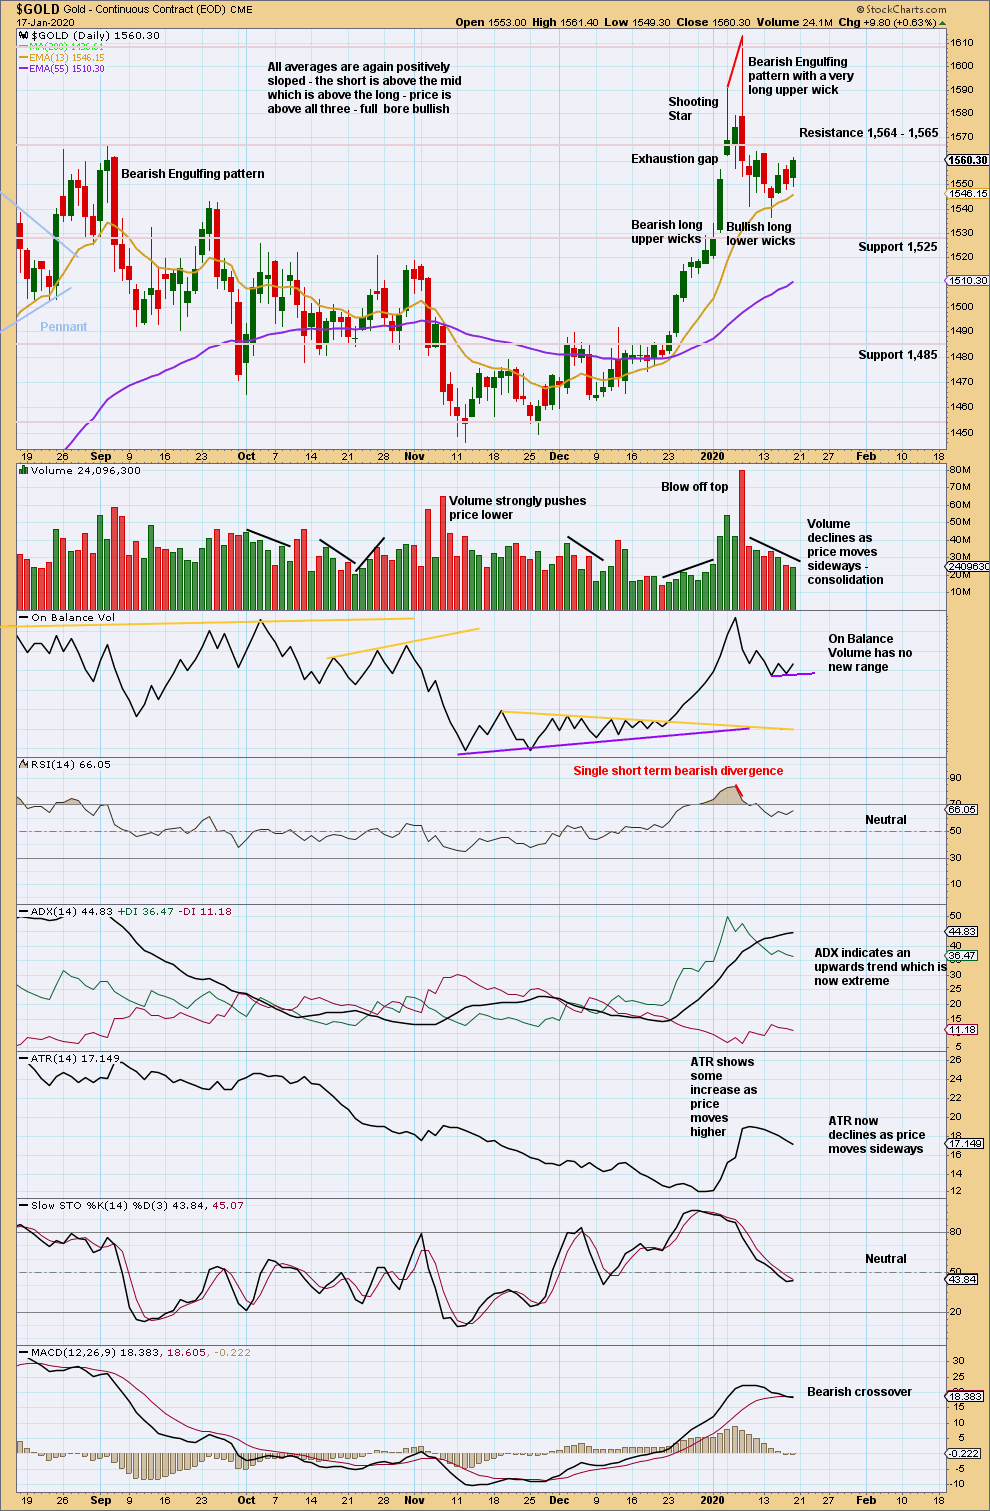
Click chart to enlarge. Chart courtesy of StockCharts.com.
The last Bearish Engulfing pattern has strong support from volume, which increases the bearish implications. Expect a trend change to either down or sideways. Now some decline in volume as price moves sideways suggests a consolidation is developing.
For the short term, a lack of support for upwards movement from volume over the last three sessions suggests a bounce here may be limited.
GDX WEEKLY CHART
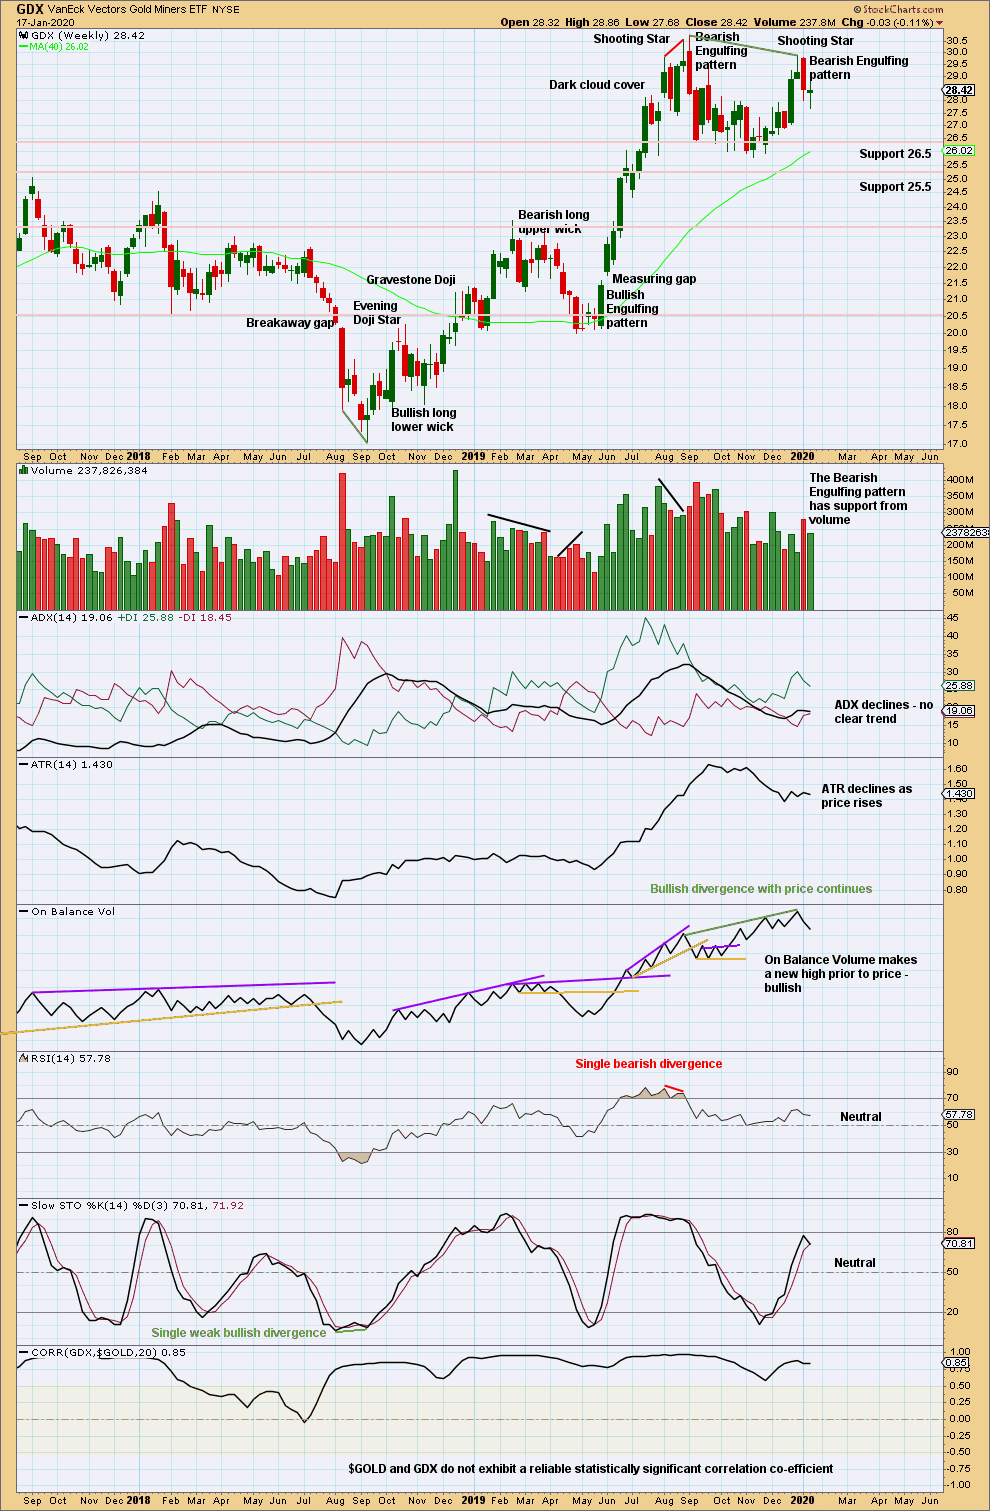
Click chart to enlarge. Chart courtesy of StockCharts.com.
Now two bearish candlestick patterns in a row, the second with support from volume, strongly suggest a trend change here to either down or sideways.
GDX DAILY CHART
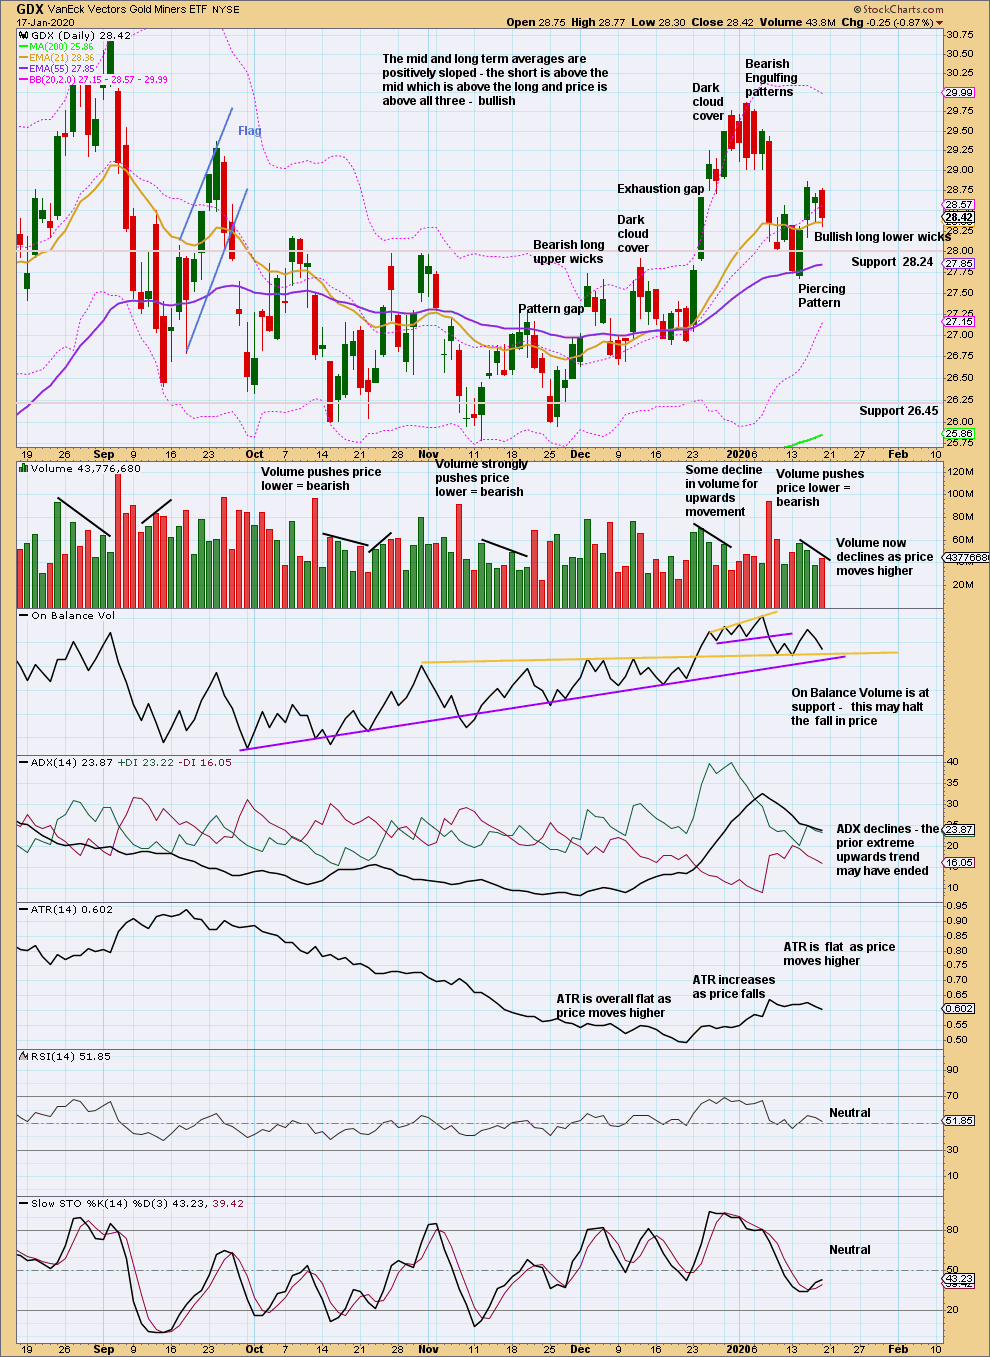
Click chart to enlarge. Chart courtesy of StockCharts.com.
A very strong bearish candlestick after an extreme upwards trend, along with closure of the last gap (now renamed an exhaustion gap) and now two bearish signals from On Balance Volume and volume supporting downwards movement and not upwards, strongly suggest GDX has found a high.
Some decline in volume with upwards movement suggests a little weakness in this bounce.
Published @ 03:38 p.m. EST.
—
Careful risk management protects your trading account(s).
Follow my two Golden Rules:
1. Always trade with stops.
2. Risk only 1-5% of equity on any one trade.
—
New updates to this analysis are in bold.
Bear hourly chart updated:
The triangle still looks more likely.
If the wide black channel from the daily chart is properly breached by a full daily candlestick of downwards movement (not just sideways) then the alternate bearish count would increase in probability.
Briefly popped out of the channel but went right back in with volume. $1599 next?
I think so ….
Still think silver and gold don’t have to move together, but for now gold’s going to have to help silver up – when silver reaches that 21 figure, then I’ll be on guard
Think the alternate daily is looking more likely now.