
Lara’s Weekly: Elliott Wave and Technical Analysis of S&P500 and Gold and US Oil | Charts – January 17, 2020

S&P 500
With price now above the upper edge of a multi-year channel, it is time to review monthly charts.
Summary: The next target is at 3,332 and thereafter 3,379.
It is again possible that minor wave 3 could be over. The risk of a larger pullback or consolidation beginning here or very soon is now high.
Three large pullbacks or consolidations (fourth waves) during the next 1-2 years are expected: for minor wave 4 (coming soon, possibly just begun), then intermediate (4), and then primary 4.
The biggest picture, Grand Super Cycle analysis, is here.
ELLIOTT WAVE COUNTS
FIRST WAVE COUNT
MONTHLY CHART
Click chart to enlarge.
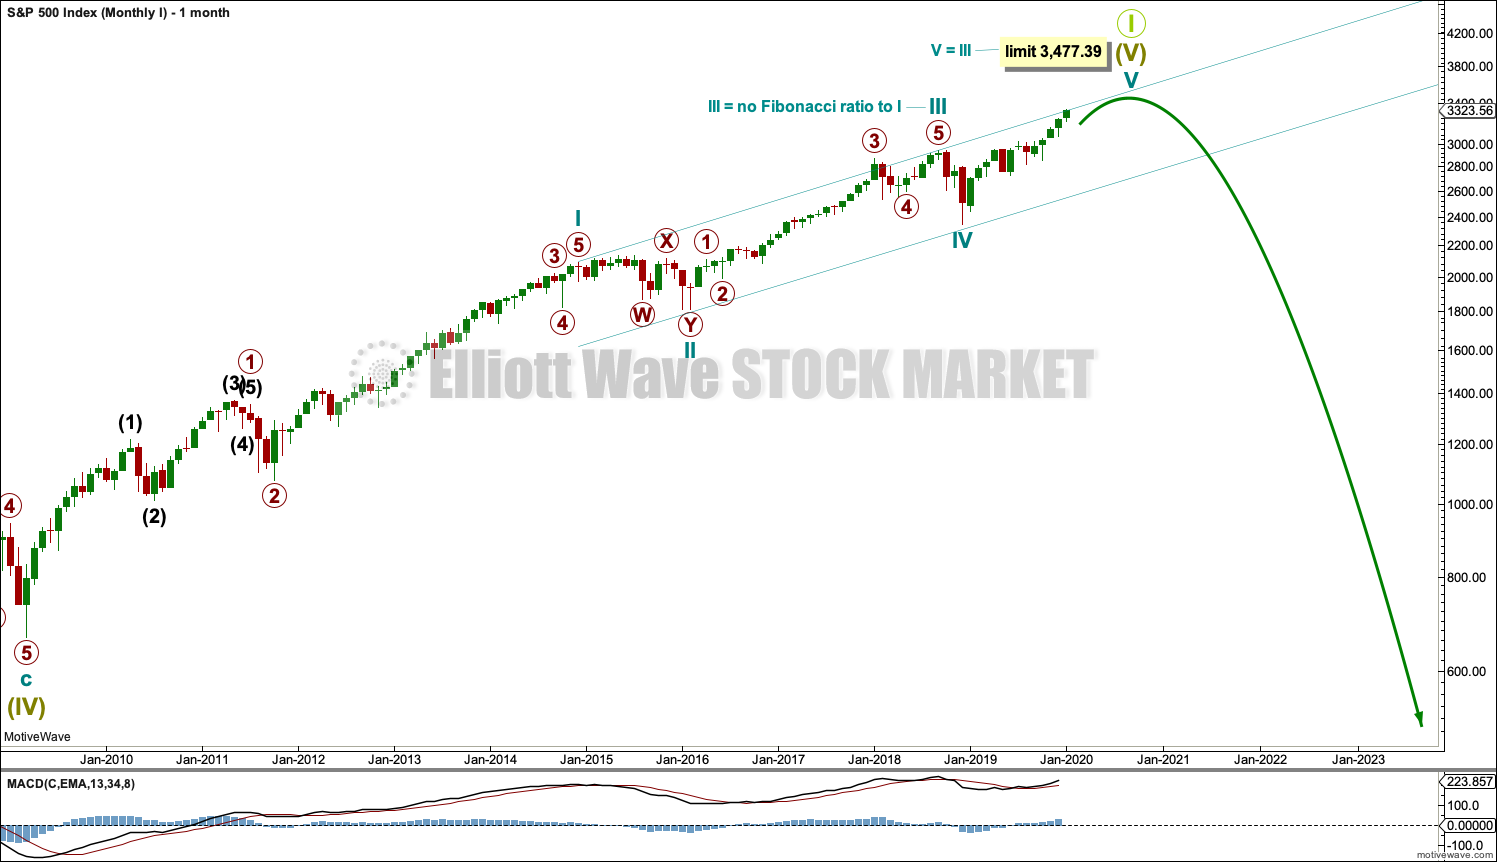
Super Cycle wave (IV) completed a 8.5 year correction. Thereafter, a bull market began for Super Cycle wave (V). The structure of Super Cycle wave (V) is incomplete. It is subdividing as an impulse.
A channel is drawn about the impulse of Super Cycle wave (V) using Elliott’s first technique. Draw this channel first from the high of 2,079.46 on the 5th of December 2014 to the high of 2,940.91 on the 21st of September 2018, then place a parallel copy on the low at 1,810.10 on the 11th of February 2016. Cycle wave IV found support about the lower edge.
There is perfect alternation between a shallow time consuming combination for cycle wave II and a deeper and more brief double zigzag for cycle wave IV. The speed and depth of cycle wave IV makes these two corrections look like they should be labelled the same degree. This wave count has the right look.
The middle of the third wave overshoots the upper edge of the Elliott channel drawn about this impulse. All remaining movement is contained within the channel. This has a typical look.
Within cycle wave V, no second wave correction may move beyond the start of its first wave below 2,346.58.
This wave count expects MACD to begin to exhibit divergence with price as price makes new highs. Cycle wave III may exhibit strongest momentum and cycle wave V may exhibit some weakness. Price is making new highs, but MACD has not. This remains the main wave count.
Within Super Cycle wave (V), cycle wave III may not be the shortest actionary wave. Because cycle wave III is shorter than cycle wave I, this limits cycle wave V to no longer than equality in length with cycle wave III at 3,477.39. A new high by any amount at any time frame above this point would invalidate this main wave count in favour of one of the two alternates below.
This wave count agrees with MACD. Cycle wave III exhibits strongest momentum, and primary wave 3 within cycle wave III exhibits the strongest histogram within MACD.
WEEKLY CHART
Click chart to enlarge.
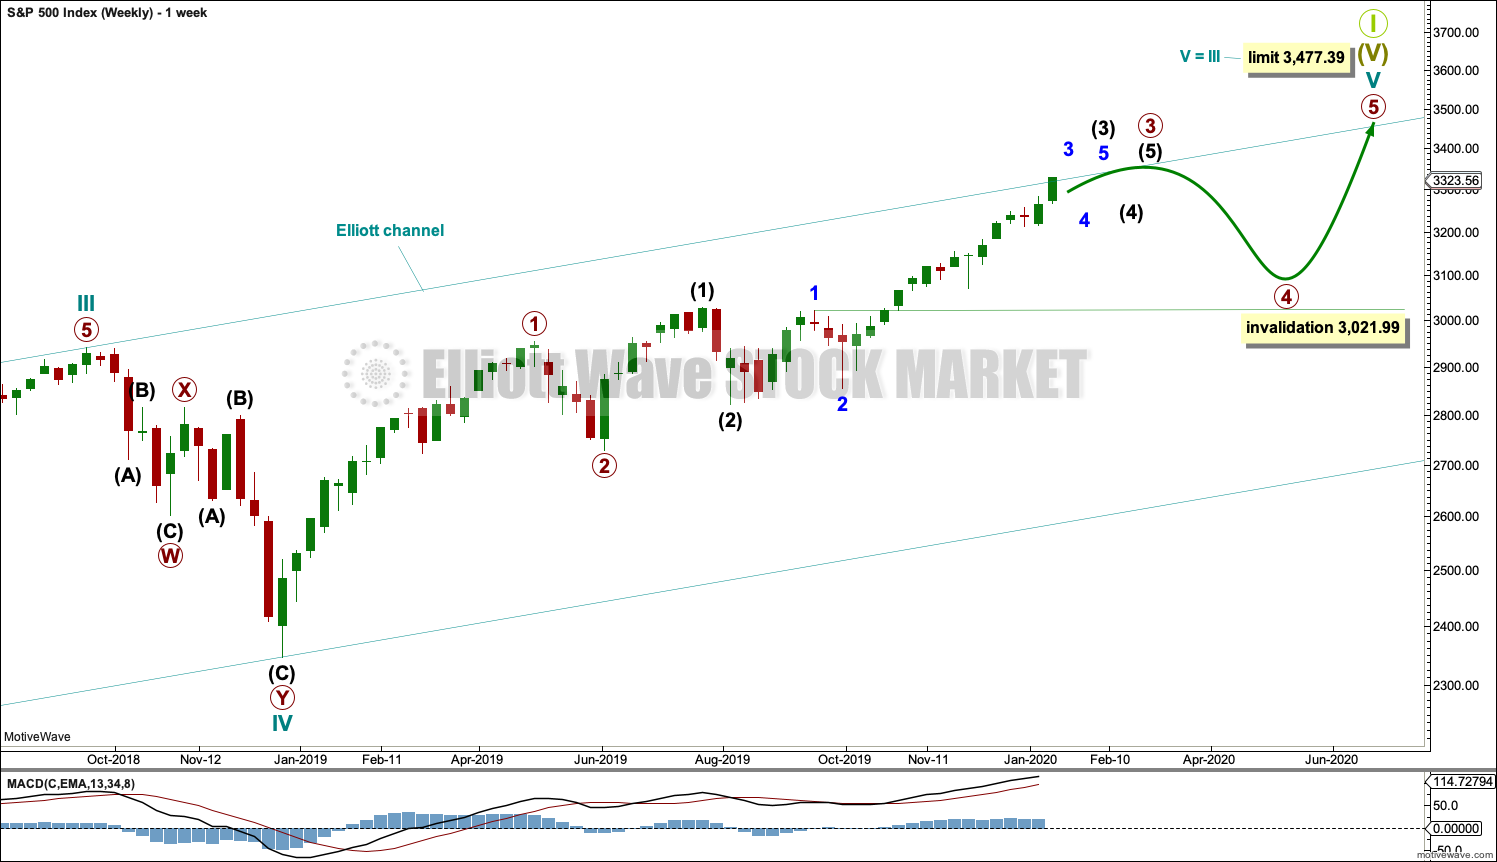
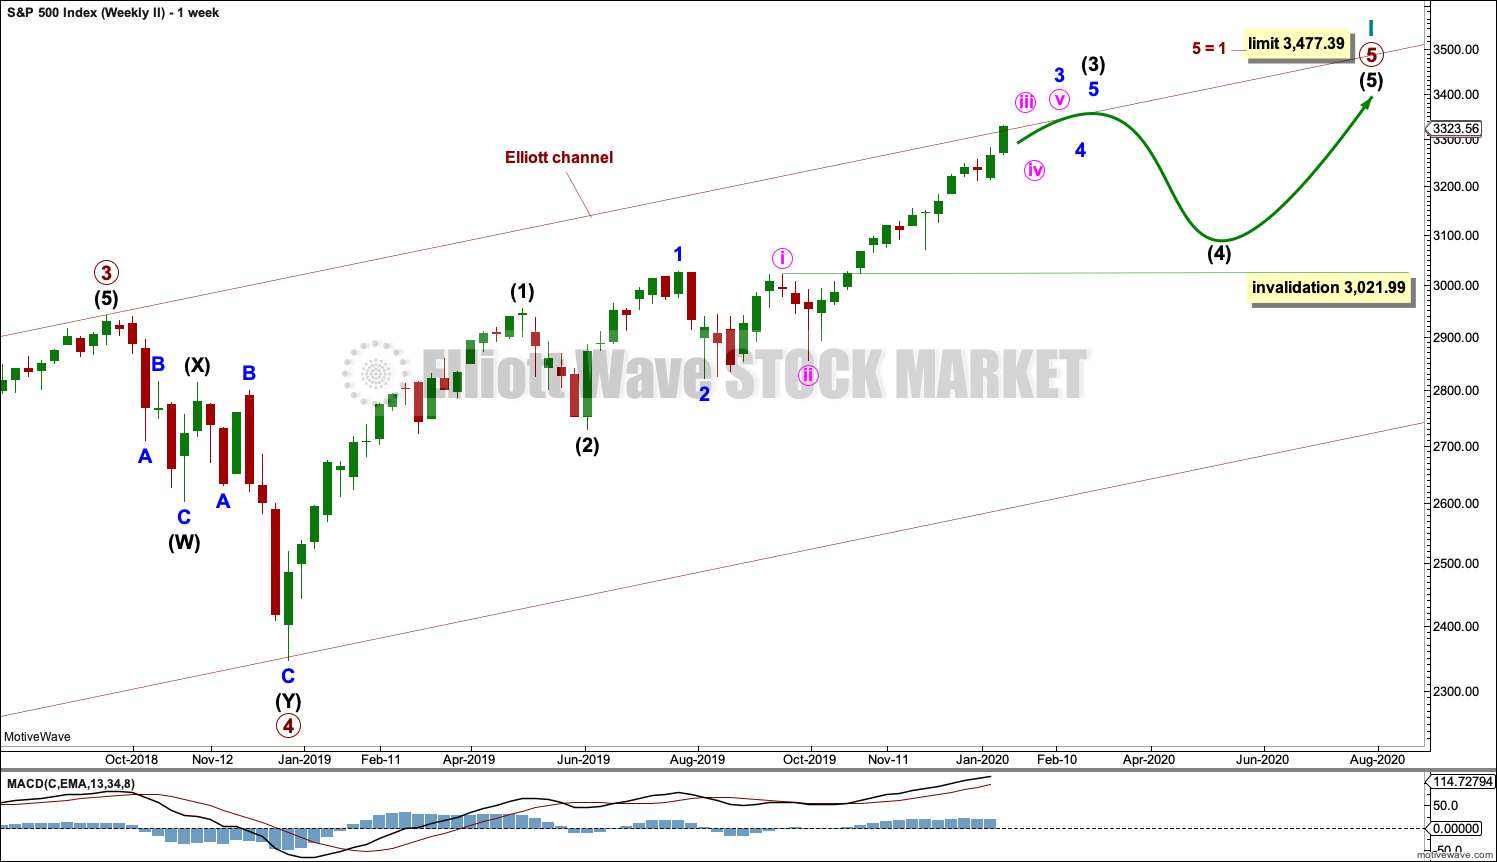
Cycle wave V may subdivide either as an impulse or an ending diagonal. Impulses are much more common, and it is clear at this stage that cycle wave V is an impulse and not a diagonal.
At this stage, cycle wave V may take another one to two or so years to complete.
The daily chart below will focus on movement from the end of intermediate wave (2) within primary wave 3.
Within cycle wave V, primary waves 1 and 2 may be complete. Within primary wave 3, intermediate waves (1) and (2) may be complete. Within the middle of intermediate wave (3), minor wave 4 may not move into minor wave 1 price territory below 3,021.99.
Within cycle wave V, the corrections of primary wave 2, intermediate wave (2) and minor wave 2 all show up clearly on the weekly chart. For cycle wave V to have the right look, the corresponding corrections of minor wave 4, intermediate wave (4) and primary wave 4 should also show up on the weekly chart. Three more large multi-week corrections are needed as cycle wave V continues higher, and for this wave count the whole structure must complete at or before 3,477.39.
DAILY CHART
Click chart to enlarge.
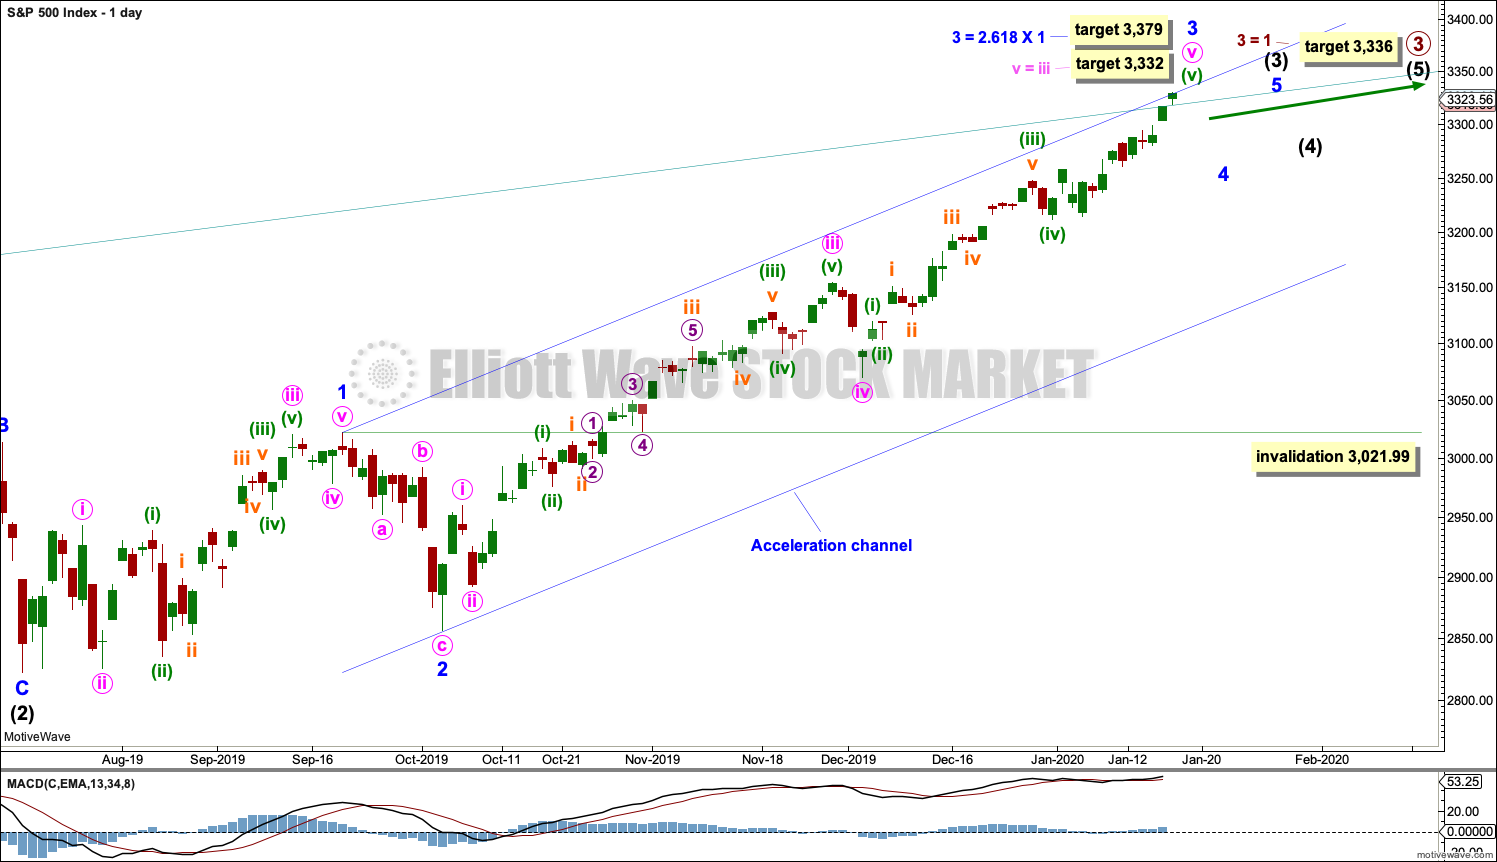
All of primary wave 3, intermediate wave (3) and minor wave 3 may only subdivide as impulses.
Minor wave 3 has passed 1.618 the length of minor wave 1, and within it minute wave v has passed equality in length with minute wave i. The next possible target for minor wave 3 may be at 3,332 where minute wave v would reach equality in length with minute wave iii.
If price reaches up to this next target and either the structure is incomplete or price keeps rising, then a next higher target may be at 3,379 where minor wave 3 would reach 2.618 the length of minor wave 1. This would require the target for primary wave 3 to also be recalculated.
When minor waves 3 and 4 may be complete, then a target will again be calculated for intermediate wave (3).
Minor wave 2 was a sharp deep pullback, so minor wave 4 may be expected to be a very shallow sideways consolidation to exhibit alternation. Minor wave 2 lasted 2 weeks. Minor wave 4 may be about the same duration, or it may be a longer lasting consolidation. Minor wave 4 may end within the price territory of the fourth wave of one lesser degree; minute wave iv has its range from 3,154.26 to 3,070.49. However, this target zone at this stage looks to be too low.
Minor wave 4 may not move into minor wave 1 price territory below 3,021.99.
Intermediate wave (3) has now moved far enough above the end of intermediate wave (1) to allow intermediate wave (4) to unfold and remain above intermediate wave (1) price territory.
Draw an acceleration channel now about intermediate wave (3): draw the first trend line from the end of minor wave 1 to the last high, then place a parallel copy on the end of minor wave 2. Keep redrawing the channel as price makes new highs. Minor wave 4 may find support at the lower edge of this channel if it is long lasting or deep enough.
Price is now above the upper edge of the wide teal channel copied over from monthly and weekly charts. A reaction downwards soon would be a reasonable expectation, but now that price has moved above the channel it may still continue higher for some time as a blow off top forms.
SECOND WAVE COUNT
MONTHLY CHART
Click chart to enlarge.
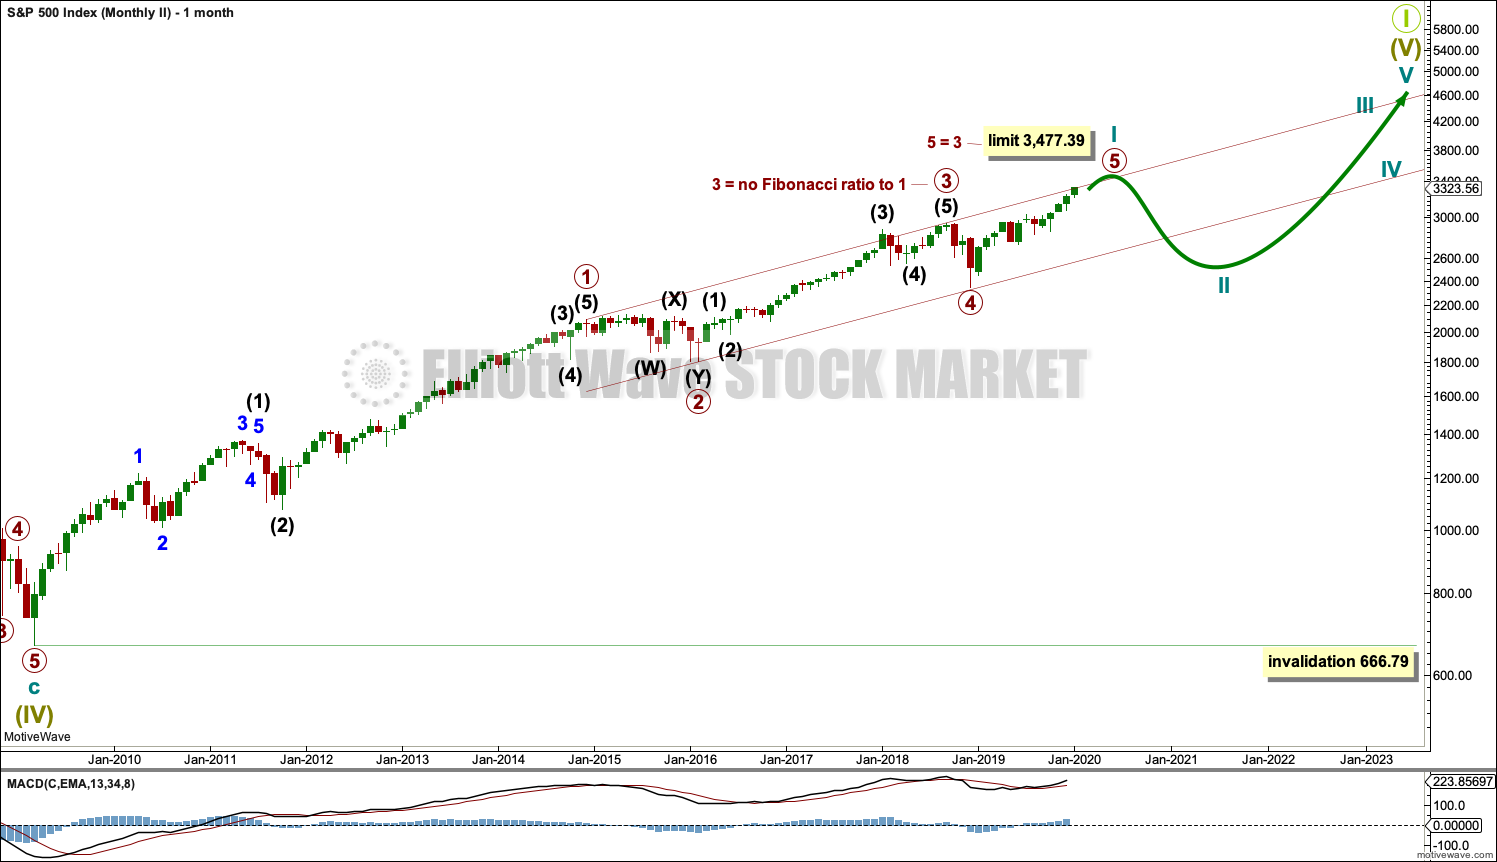
This monthly chart sees all subdivisions from the end of the March 2009 low in almost the same way, with the sole difference being the degree of labelling.
If the degree of labelling for the entirety of this bull market is all moved down one degree, then only a first wave at cycle degree may be nearing an end.
When cycle wave I is complete, then cycle wave II should meet the technical definition of a bear market as it should retrace more than 20% of cycle wave I, but it may end about either the 0.382 or 0.618 Fibonacci Ratios of cycle wave I. Cycle wave II may end close to the low of primary wave II within cycle wave I, which is at 1,810.10. It is also possible that cycle wave II could be fairly shallow and only barely meet the definition of a bear market.
Thereafter, a new bull market for cycle wave III may begin. It should have support from volume and fundamentals.
The end of Grand Super Cycle wave I may be about 10 years or so away.
WEEKLY CHART
Click chart to enlarge.
The impulse is still viewed as nearing an end; a fifth wave is still seen as needing to complete higher. This wave count labels it primary wave 5. Primary wave 5 may still need another year to two or so to complete, depending upon how time consuming the corrections within it may be.
Primary wave 5 may be subdividing as an impulse, in the same way that cycle wave V is seen for the first weekly chart.
ALTERNATE WAVE COUNT I
MONTHLY CHART
Click chart to enlarge.
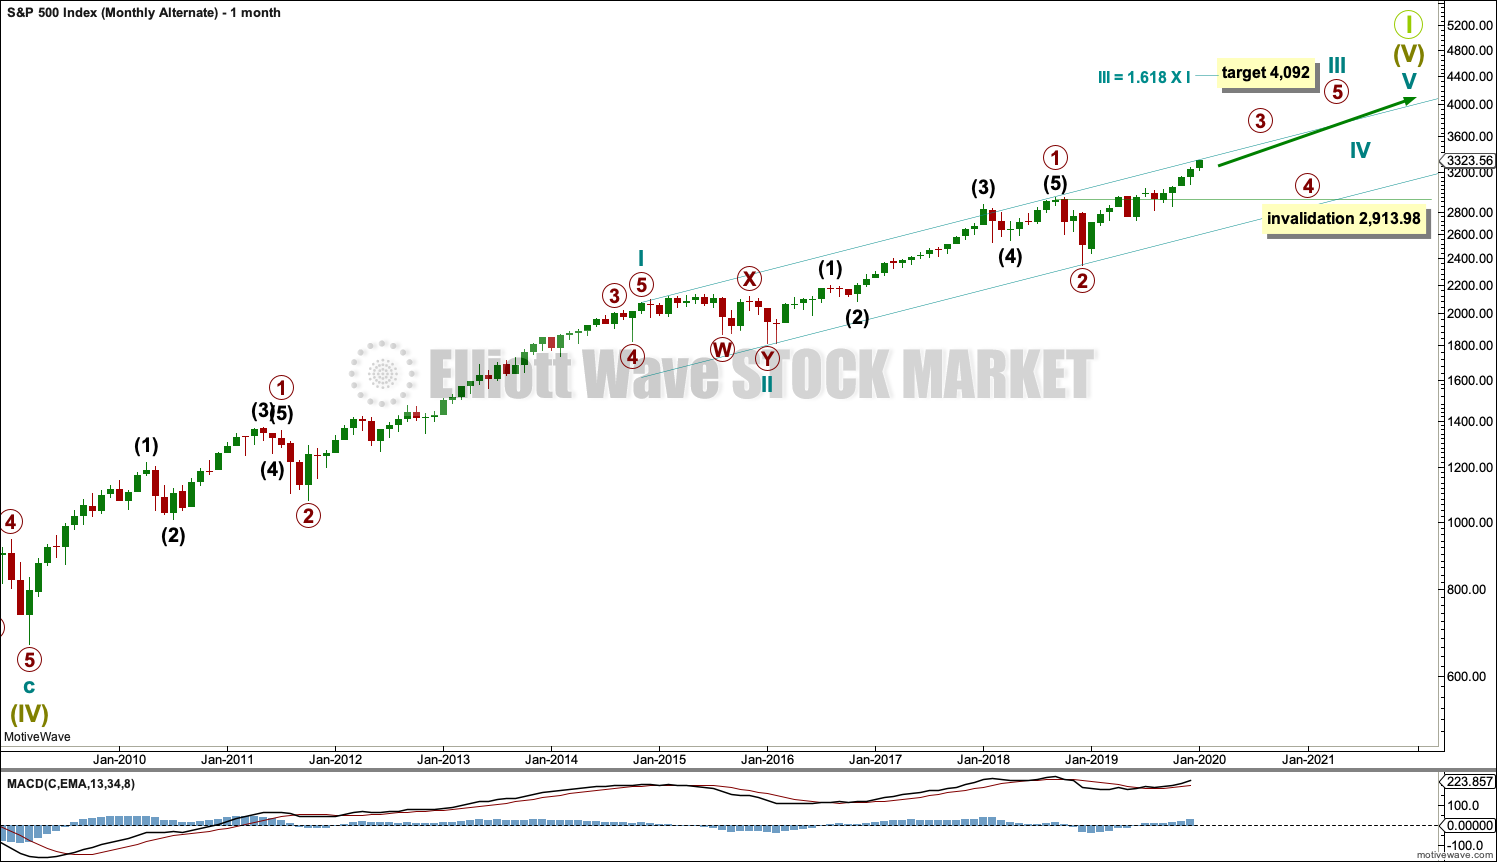
If the degree of labelling is moved down within cycle wave III, then it is possible that the last high was only primary wave 1. Cycle wave III may be extending.
Only two actionary waves within an impulse may extend. Cycle wave I was extended. If cycle wave III also extends, then cycle wave V may not extend.
A target is calculated for cycle wave III to end. If price gets up to this target and the structure is incomplete, or if price keeps rising through the target, then a new higher target would then be calculated.
Within cycle wave III, primary wave 4 may not move into primary wave 1 price territory below 2,913.98.
This wave count expects MACD to indicate stronger momentum as price makes a new all time high. If that happens, then this may be switched to be the main wave count.
The channel drawn here is an acceleration channel. The channel should be redrawn as price makes new highs. When cycle wave III may be complete, then this channel would be an Elliott channel and may show where cycle wave IV may find support.
This wave count has no limit on upwards movement.
ALTERNATE WAVE COUNT II
MONTHLY CHART
Click chart to enlarge.
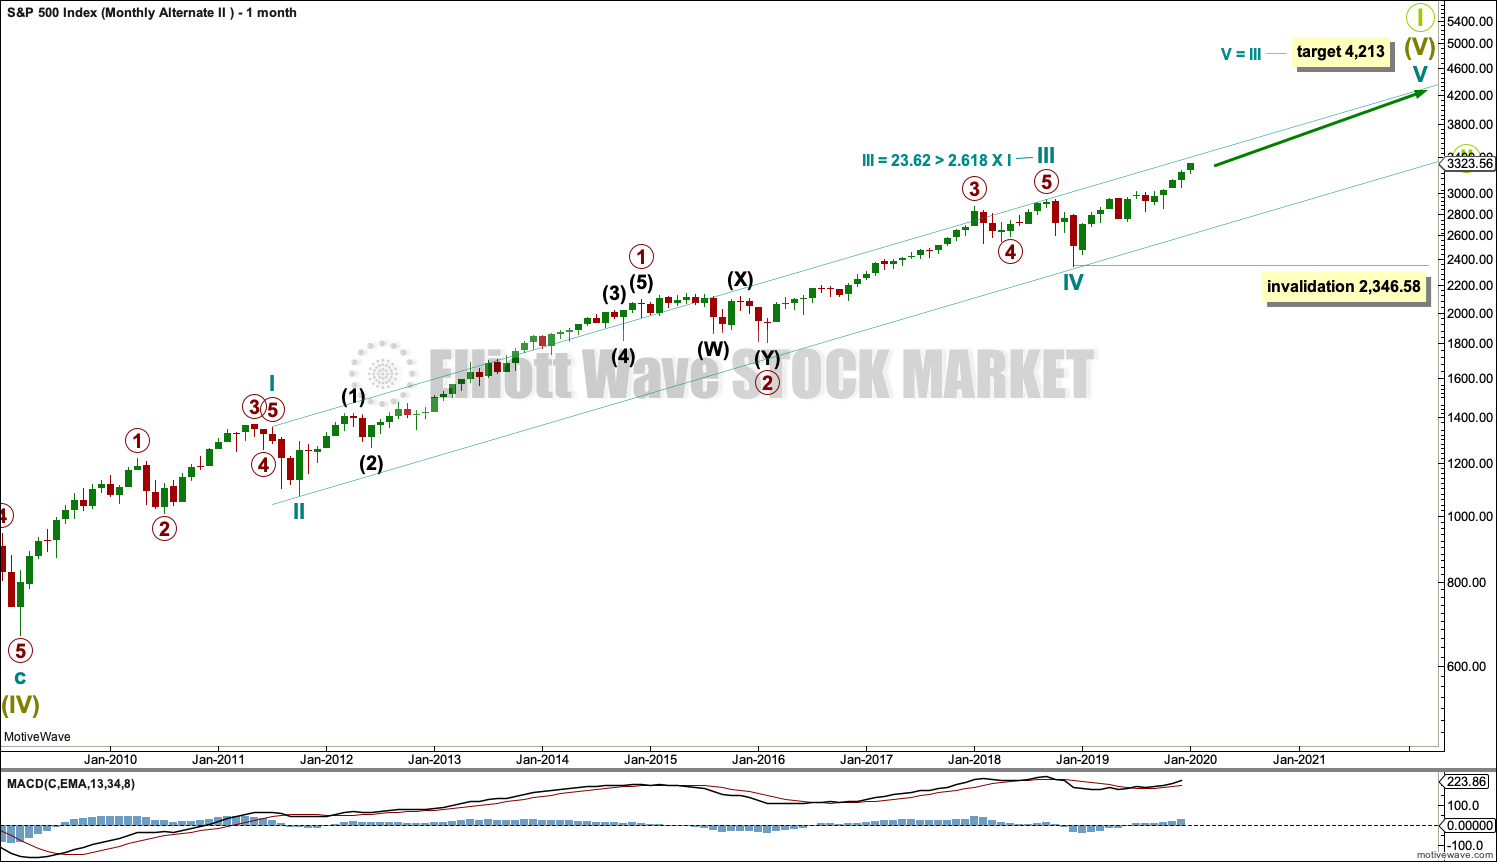
It is also possible that cycle wave I was over earlier and did not extend. Cycle wave III may have extended and exhibits a Fibonacci ratio to cycle wave I.
Within cycle wave III, both primary waves 2 and 4 are more time consuming than cycle waves II and IV. This is possible and does occasionally happen when waves extend as they do so both in price and time, but it does give the wave count an odd look.
The channel is drawn using Elliott’s first technique. It shows where cycle wave IV found support. However, the upper edge of the channel is breached by much of cycle wave III and not just the strongest portion of it. This does not have a typical look.
This wave count still agrees with MACD. Cycle wave III exhibits strongest momentum, and primary wave 3 within cycle wave III exhibits the strongest histogram within MACD.
This wave count has no limit on upwards movement.
Cycle wave V has now passed equality in length with cycle wave I. The next likely Fibonacci ratio for cycle wave V is used to calculate a target.
TECHNICAL ANALYSIS
MONTHLY CHART

Click chart to enlarge. Chart courtesy of StockCharts.com.
There are three large consolidations noted on this chart, in shaded areas. After a breakout from a multi-month consolidation, it is reasonable to expect a multi month bullish move may result.
Note that in each of the first two cases a pullback saw price re-enter the consolidation zone after the breakout, before price then moved up and away. It is possible that may happen again after the last breakout from a consolidation.
This chart very clearly exhibits rising price on declining volume has now persisted for several years. A decline in volume last month, in current market conditions, is not of concern.
On Balance Volume supports the Elliott wave count.
WEEKLY CHART
Click chart to enlarge. Chart courtesy of StockCharts.com.
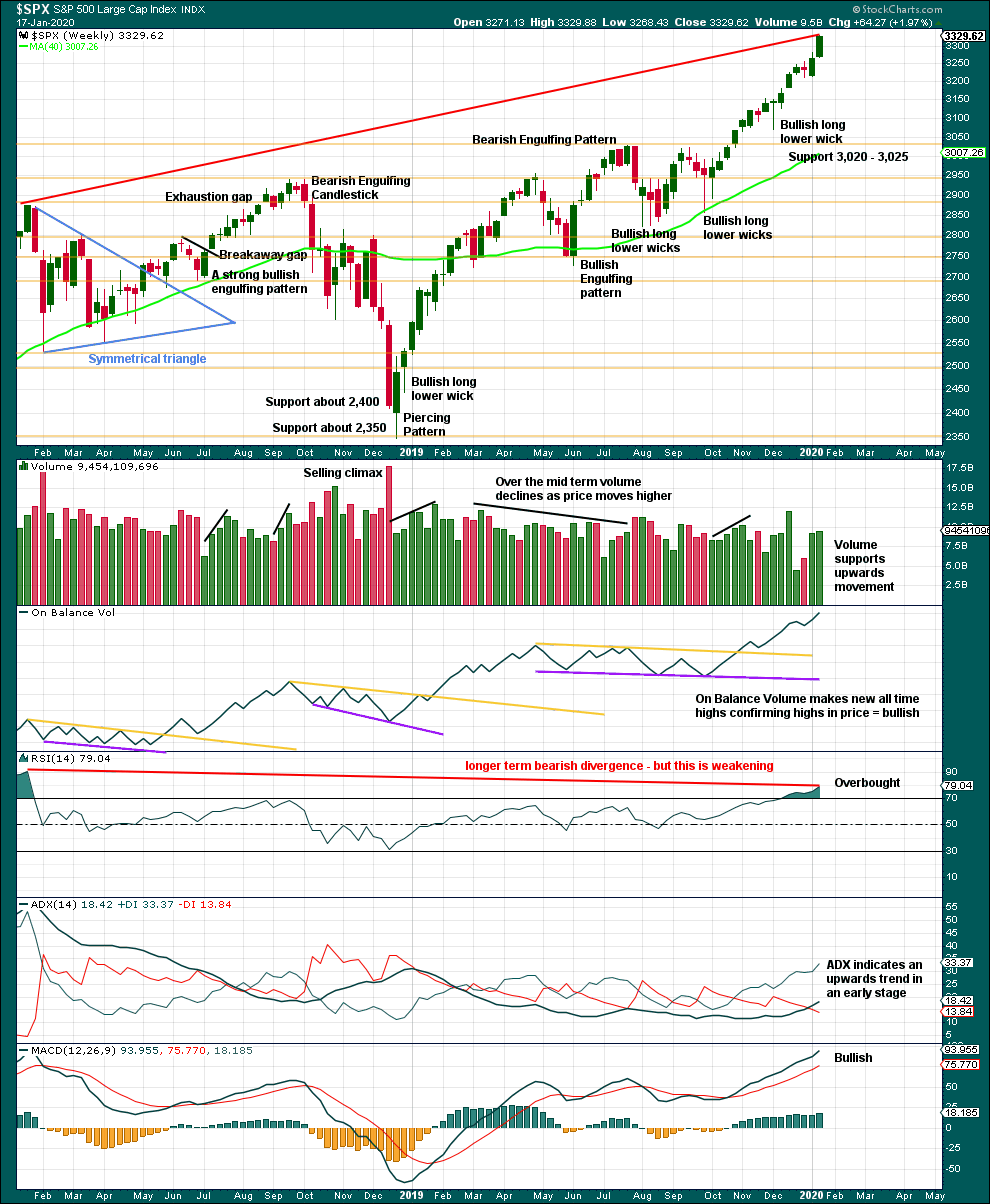
It is very clear that the S&P is in an upwards trend and the bull market is continuing. Price does not move in straight lines; there will be pullbacks and consolidations along the way.
This chart is overall bullish. There are no signs of short-term weakness in upwards movement.
RSI is now overbought. That does not mean upwards movement must end here, because it can continue for several weeks while RSI reaches more extreme. RSI reaching overbought is a warning that conditions are now becoming extreme. A pullback or consolidation will follow and the longer conditions are extreme the closer this will be. However, assume the trend remains the same until proven otherwise. This warning should be heeded by careful attention to risk management.
This week again completes a strong bullish candlestick with some support from volume. The trend remains upwards, for now.
DAILY CHART
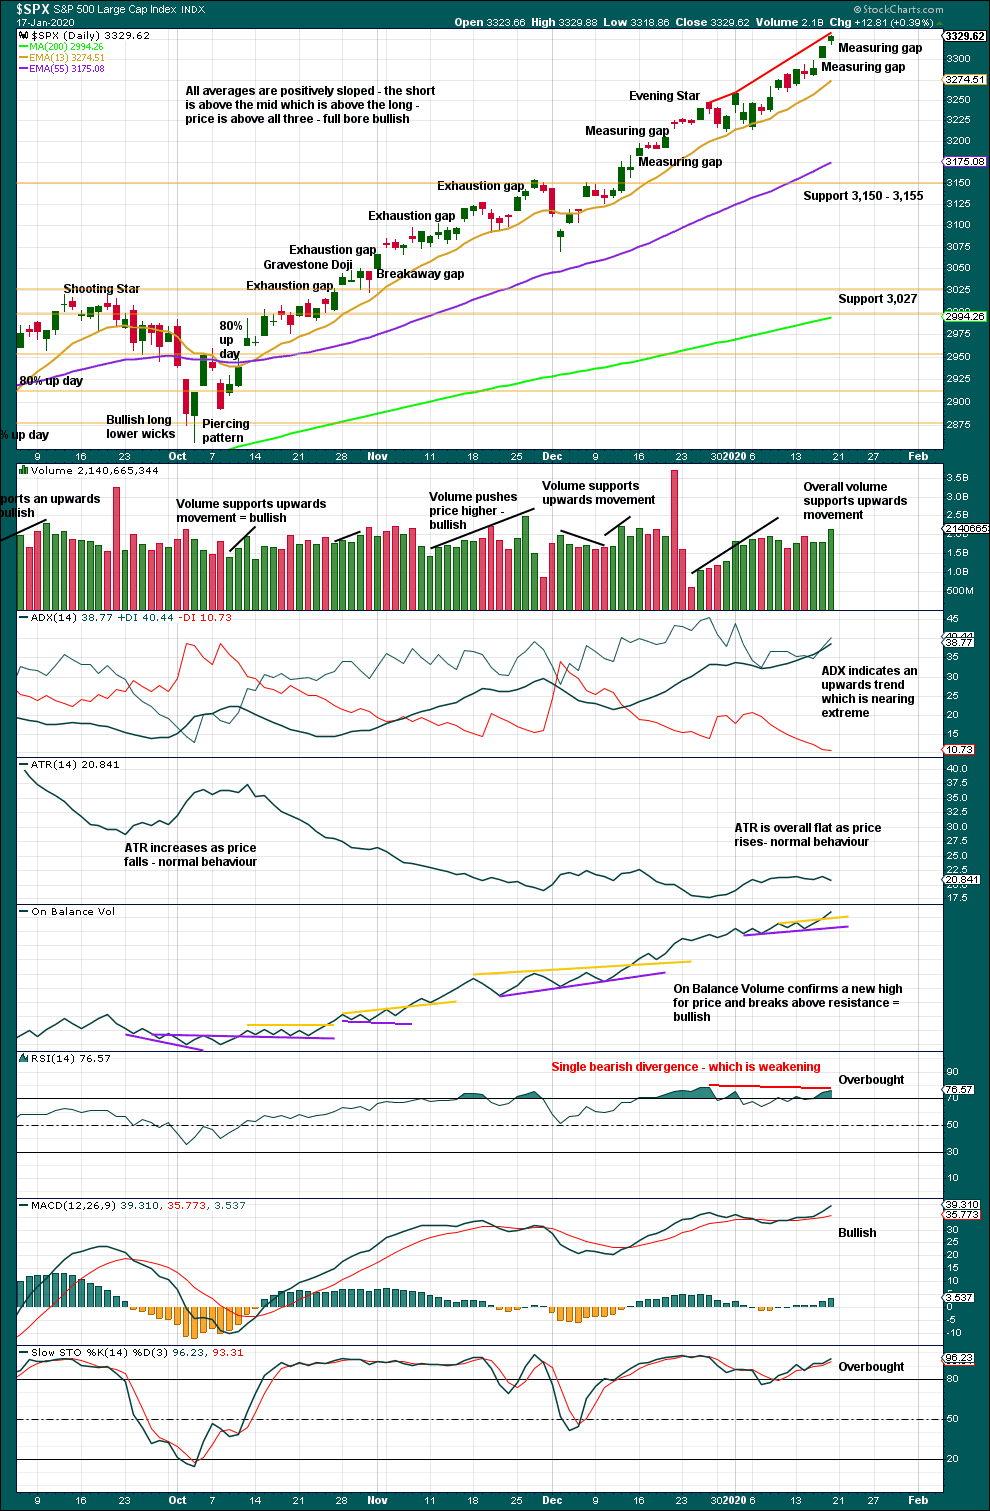
Click chart to enlarge. Chart courtesy of StockCharts.com.
There is an upwards trend in place. There will be corrections along the way.
Like the weekly chart, this chart is bullish.
RSI now exhibits only single bearish divergence where up until today it had exhibited double bearish divergence. Divergence is weakening; it is possible that it may disappear. With the data in hand today, there is still some weakness exhibited by this divergence and while conditions are extreme this may be an indication that a pullback may arrive here or very soon.
Corrections for this market can sometimes arrive with very little warning. Extreme conditions warrant more careful attention to risk management. Upwards movement could continue yet for a reasonable distance and time, but the risk of a consolidation or pullback is increasing.
A target from the gap yesterday is at 3,386.85. Closure of this gap would indicate it would be an exhaustion gap. At that stage, a consolidation or pullback may be expected to have just begun.
Another gap today gives a closer target at 3,333.
BREADTH – AD LINE
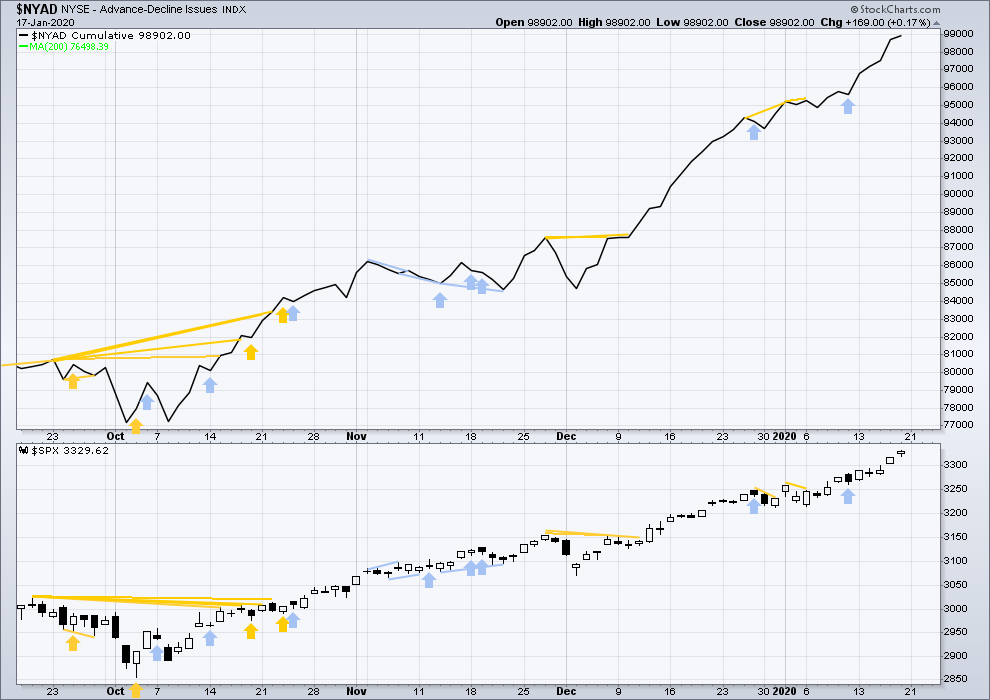
WEEKLY CHART
Click chart to enlarge. Chart courtesy of StockCharts.com. So that colour blind members are included, bearish signals will be noted with blue and bullish signals with yellow.
Bear markets from the Great Depression and onwards have been preceded by an average minimum of 4 months divergence between price and the AD line with only two exceptions in 1946 and 1976. With the AD line making new all time highs this week, the end of this bull market and the start of a new bear market is very likely a minimum of 4 months away, which is mid May 2020.
In all bear markets in the last 90 years there is some positive correlation (0.6022) between the length of bearish divergence and the depth of the following bear market. No to little divergence is correlated with more shallow bear markets. Longer divergence is correlated with deeper bear markets.
If a bear market does develop here, it comes after no bearish divergence. It would therefore more likely be shallow.
Again both price and the AD line have made new all time highs. There is no divergence. Upwards movement has support from rising market breadth.
Large caps all time high: 3,329.88 on 17th January 2020.
Mid caps all time high: 2,106.30 on 17th January 2020.
Small caps all time high: 1,100.58 on 27th August 2018.
Current upwards movement is driven by large caps, which is a feature of an aged bull market.
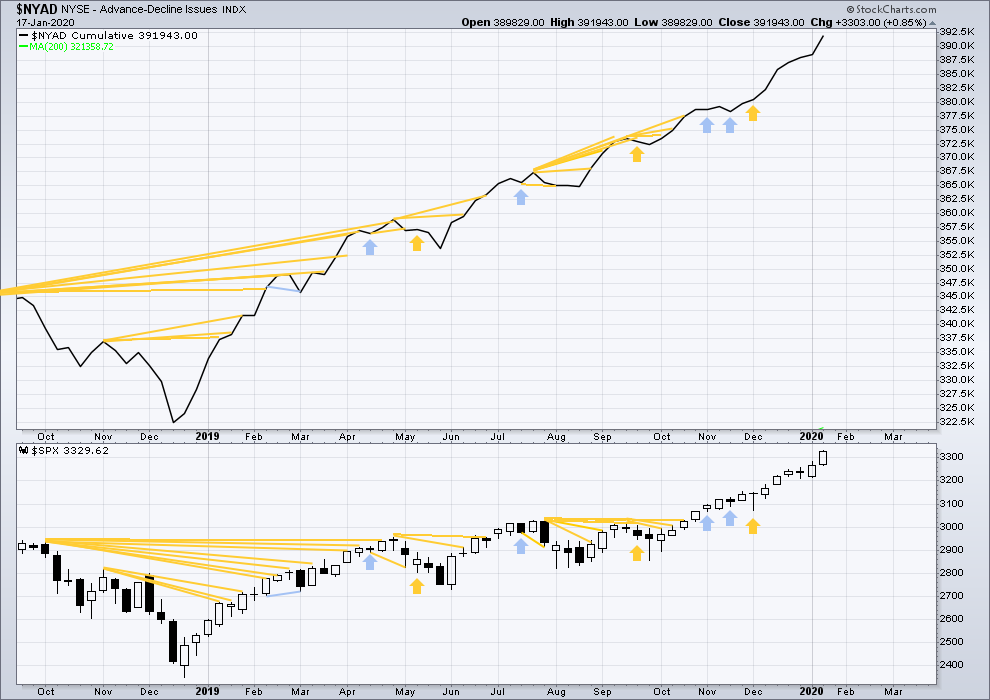
DAILY CHART
Click chart to enlarge. Chart courtesy of StockCharts.com. So that colour blind members are included, bearish signals will be noted with blue and bullish signals with yellow.
Breadth should be read as a leading indicator.
Upwards movement continues to see new all time highs in both price and the AD line. Upwards movement has support from rising market breadth. This is bullish.
VOLATILITY – INVERTED VIX CHART
WEEKLY CHART
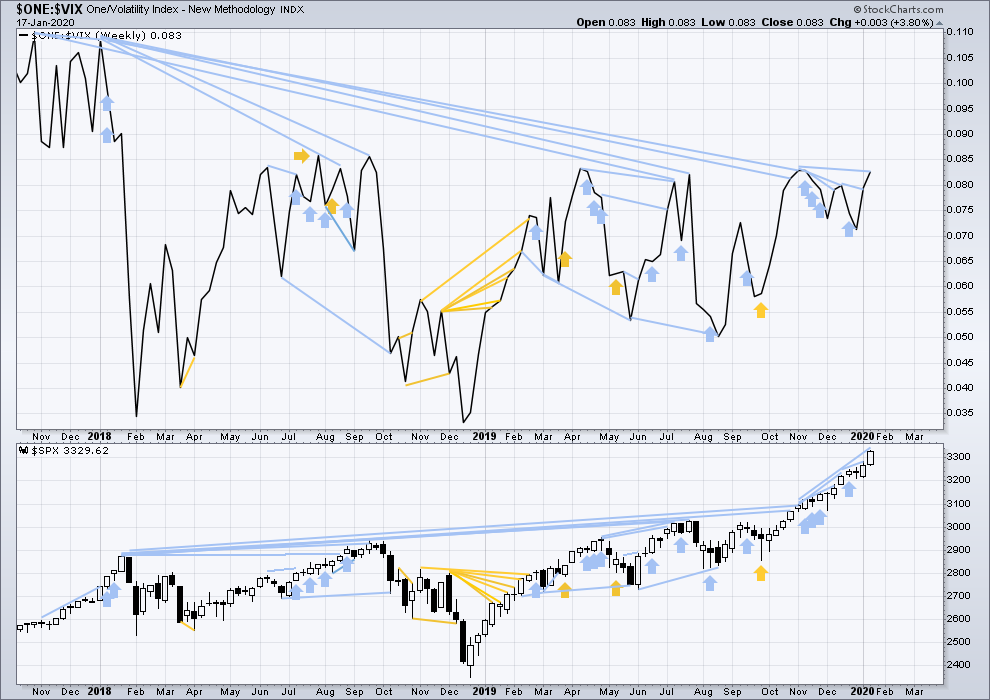
Click chart to enlarge. Chart courtesy of StockCharts.com. So that colour blind members are included, bearish signals will be noted with blue and bullish signals with yellow.
The all time high for inverted VIX was on 30th October 2017. There is now over two years of bearish divergence between price and inverted VIX.
The rise in price is not coming with a normal corresponding decline in VIX; VIX remains elevated. This long-term divergence is bearish and may yet develop further as the bull market matures.
This divergence may be an early warning, a part of the process of a top developing that may take years. It may is clearly not useful in timing a trend change from bull to a fully fledged bear market.
This week price and inverted VIX have both moved higher. Price is making new highs, but there remains all of short, mid and long-term bearish divergence with inverted VIX. Short-term divergence is weakened this week.
DAILY CHART
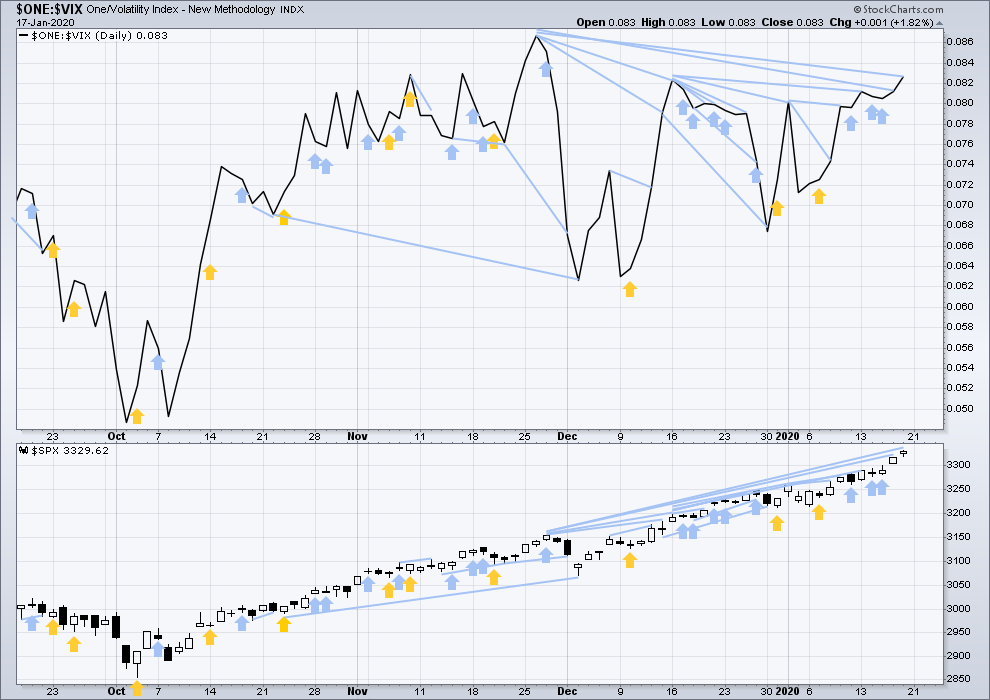
Click chart to enlarge. Chart courtesy of StockCharts.com. So that colour blind members are included, bearish signals will be noted with blue and bullish signals with yellow.
Both price and inverted VIX have moved higher today. Price has made new highs, but inverted VIX still exhibits mid and long-term bearish divergence.
DOW THEORY
Dow Theory confirmed a bear market in December 2018. This does not necessarily mean a bear market at Grand Super Cycle degree though; Dow Theory makes no comment on Elliott wave counts. On the 25th of August 2015 Dow Theory also confirmed a bear market. The Elliott wave count sees that as part of cycle wave II. After Dow Theory confirmation of a bear market in August 2015, price went on to make new all time highs and the bull market continued.
DJIA: 23,344.52 – a close on the 19th of December at 23,284.97 confirms a bear market.
DJT: 9,806.79 – price has closed below this point on the 13th of December.
S&P500: 2,532.69 – a close on the 19th of December at 2,506.96 provides support to a bear market conclusion.
Nasdaq: 6,630.67 – a close on the 19th of December at 6,618.86 provides support to a bear market conclusion.
With all the indices having moved higher following a Dow Theory bear market confirmation, Dow Theory would confirm a bull market if the following highs are made:
DJIA: 26,951.81 – a close above this point has been made on the 3rd of July 2019.
DJT: 11,623.58 – to date DJT has failed to confirm an ongoing bull market.
S&P500: 2,940.91 – a close above this point was made on the 29th of April 2019.
Nasdaq: 8,133.30 – a close above this point was made on the 26th of April 2019.
GOLD
This week a consolidation was expected to continue. A small range week with weak volume overall fits this expectation.
Summary: A consolidation to last a Fibonacci 13 sessions (and so end on the 27th of January) and find support about the lower edge of the adjusted Elliott channel on daily charts is expected to be underway. Thereafter, more upwards movement may be a final thrust before a bear market resumes.
A bullish wave count expects a third wave is ending here or very soon. The target is 1,635 or 1,693.
An alternate bearish wave count looks at the possibility that Gold has just seen a Super Cycle degree trend change. Confidence in this idea may be had with a new low below 1,473.36. Full and final confidence would be had if price makes a new low below 1,374.91.
Grand SuperCycle analysis is here.
Monthly charts were last updated here.
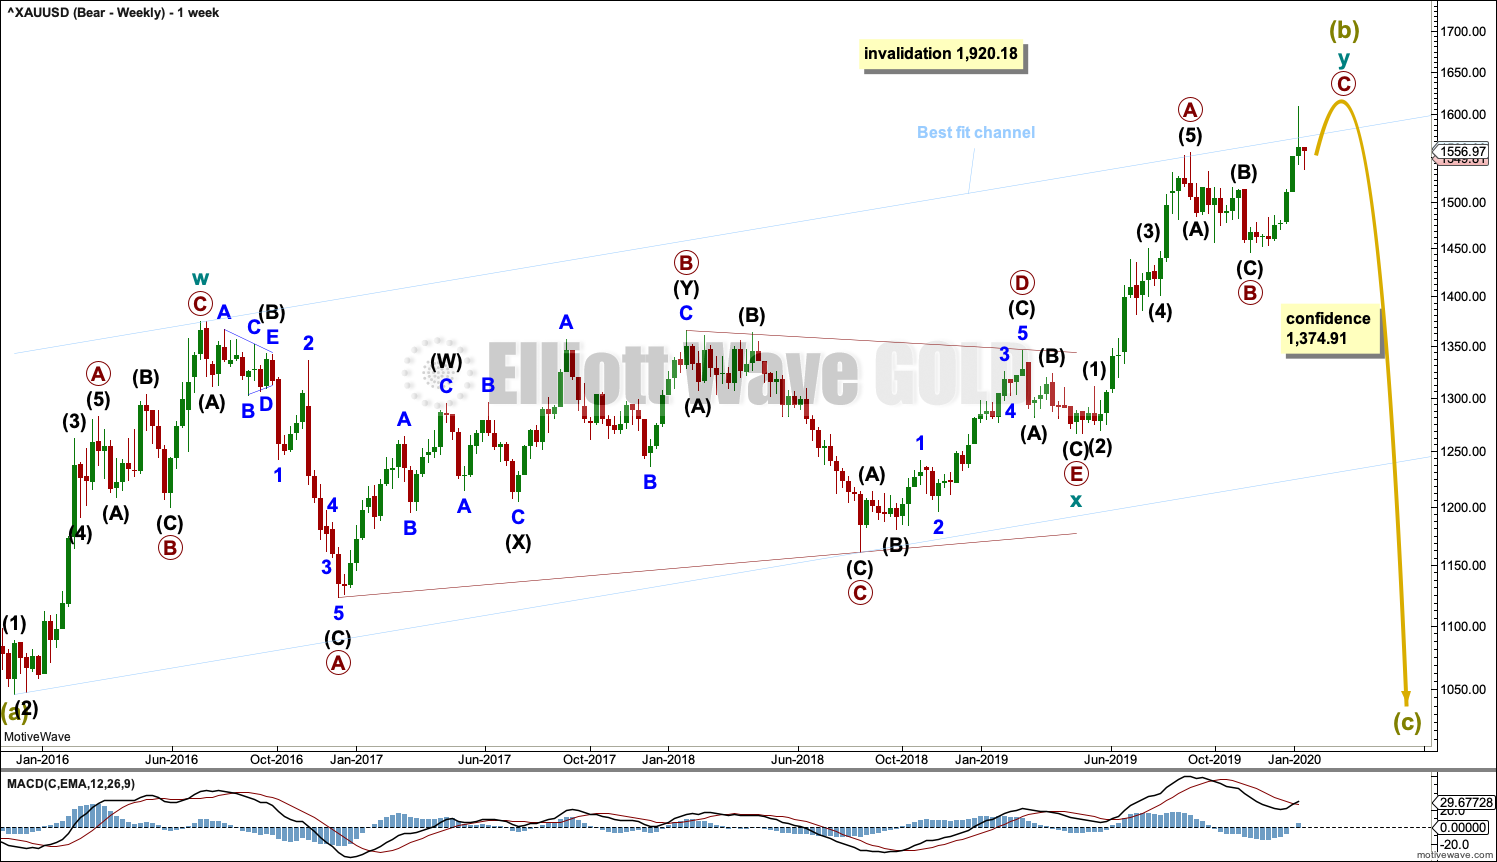
BEARISH ELLIOTT WAVE COUNT
WEEKLY CHART
Click chart to enlarge.
Super Cycle wave (b) may still be an incomplete double zigzag, requiring one more high.
The first zigzag in the double is labelled cycle wave w. The double is joined by a three in the opposite direction, a triangle labelled cycle wave x. The second zigzag in the double is labelled cycle wave y.
The purpose of the second zigzag in a double is to deepen the correction. Cycle wave y has achieved this purpose.
After the structure of cycle wave y may be complete, then a new low below 1,374.91 would add strong confidence to this wave count. At that stage, the bullish Elliott wave count would be invalidated. At that stage, targets for Super Cycle wave (c) would be calculated.
A wide best fit channel is added in light blue. Copy this channel over to daily charts. The upper edge of this channel was breached, but now price has returned strongly to within the channel.
DAILY CHART
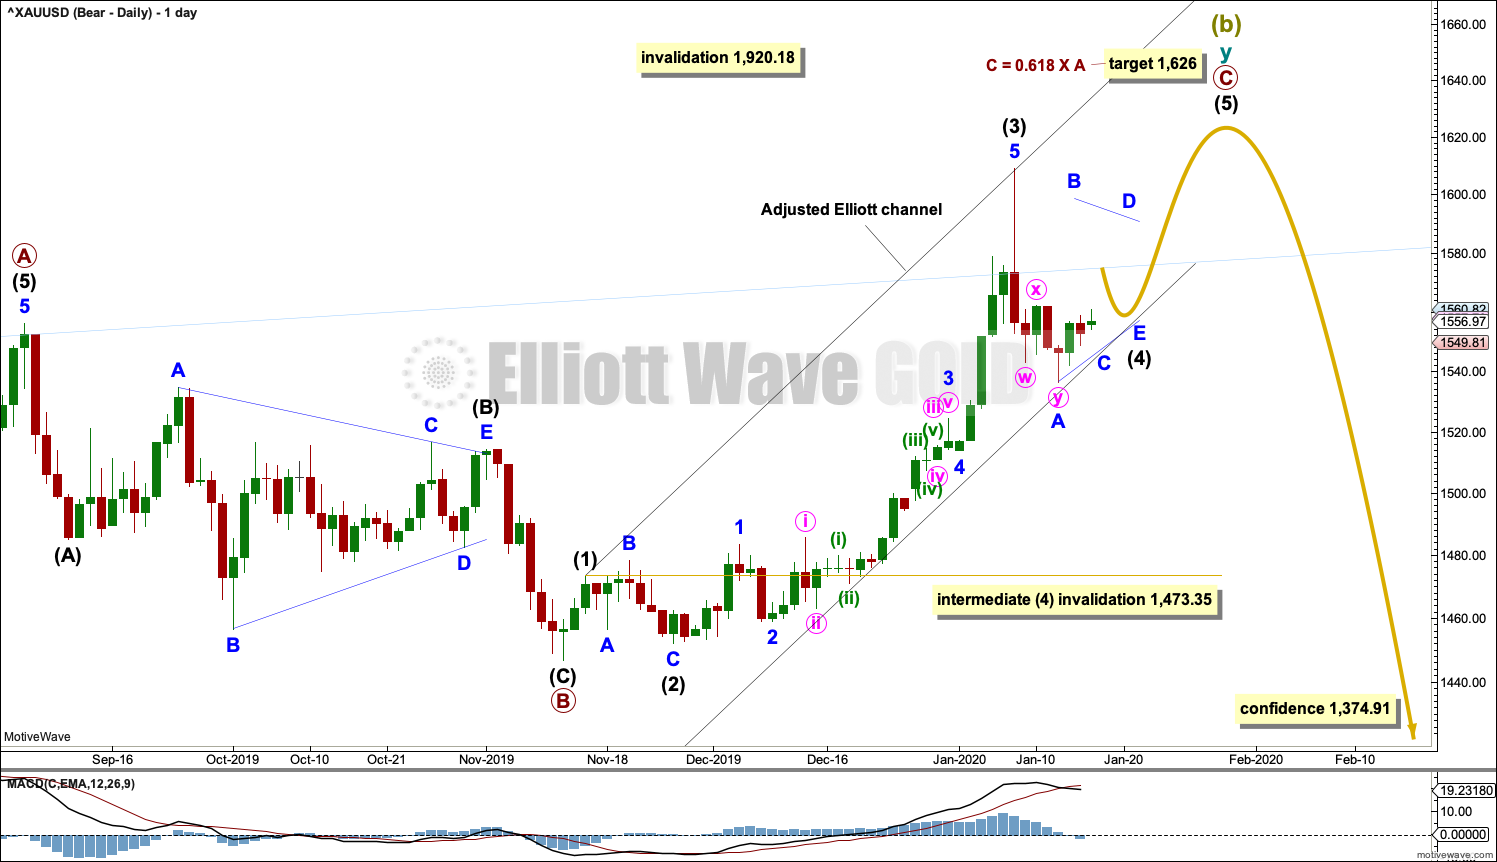
Click chart to enlarge.
The double zigzag for Super Cycle wave (b) may be still incomplete.
Within cycle wave y, primary waves A and B are complete. Primary wave C must complete as a five wave structure. It is unfolding as an impulse. Within the impulse, intermediate waves (1) to (3) may now be complete.
Intermediate wave (2) was a deep 0.79 zigzag, which lasted 8 sessions. Given the guideline of alternation, intermediate wave (4) would least likely unfold as a zigzag and most likely unfold as either a flat, combination or triangle. Intermediate wave (4) would most likely be shallow. It may last about a Fibonacci 13 sessions ending on the 27th of January.
Intermediate wave (4) may not move into intermediate wave (1) price territory below 1,473.35.
Drawn an Elliott channel about primary wave C and then pull the lower edge down to contain all of primary wave C. The lower edge may provide support to intermediate wave (4).
Intermediate wave (4) may subdivide as any one of several Elliott wave structures. Today on the bearish wave count a triangle will be considered. It is still too early to know which structure intermediate wave (4) may be, so this labelling may change. A flat correction would also work, which is outlined on the bullish Elliott wave count below.
ALTERNATE DAILY CHART
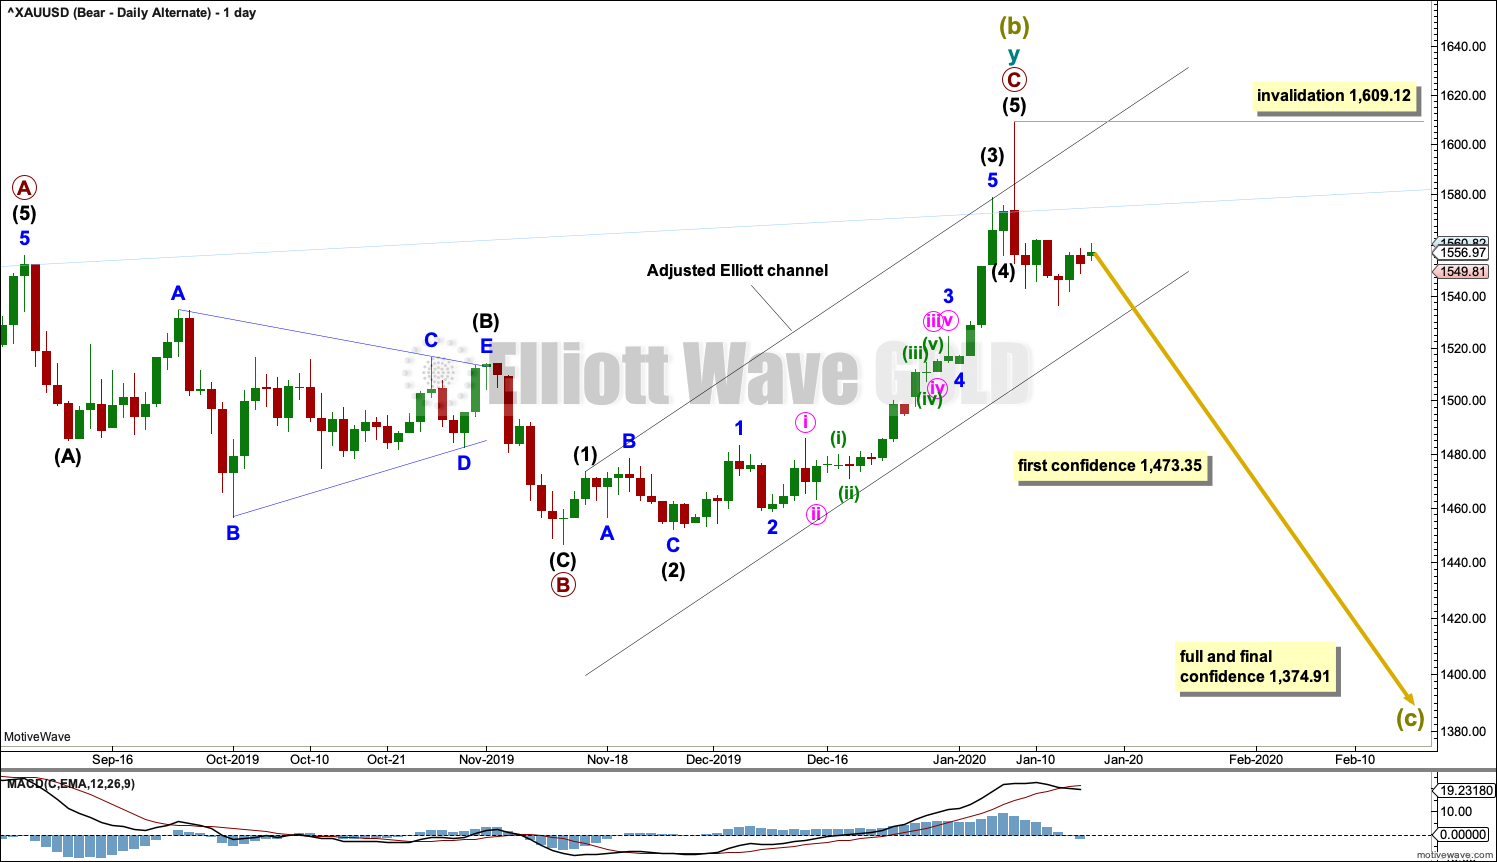
Click chart to enlarge.
Alternatively, it is possible again that Super Cycle wave (b) may be complete and the bear market for Gold may have resumed.
A new low below 1,473.35 would invalidate the main bearish wave count and add some confidence in this alternate. Thereafter, a new low by any amount at any time frame below 1,374.91 would invalidate the bullish wave count below and add full and final confidence in this wave count. Targets for Super Cycle wave (c) would be calculated at that stage.
If Super Cycle wave (c) has begun, then it should develop a five wave structure downwards at the daily and weekly time frames. Within the first five down, no second wave correction may move beyond the start of its first wave above 1,609.12.
BULLISH ELLIOTT WAVE COUNT
WEEKLY CHART
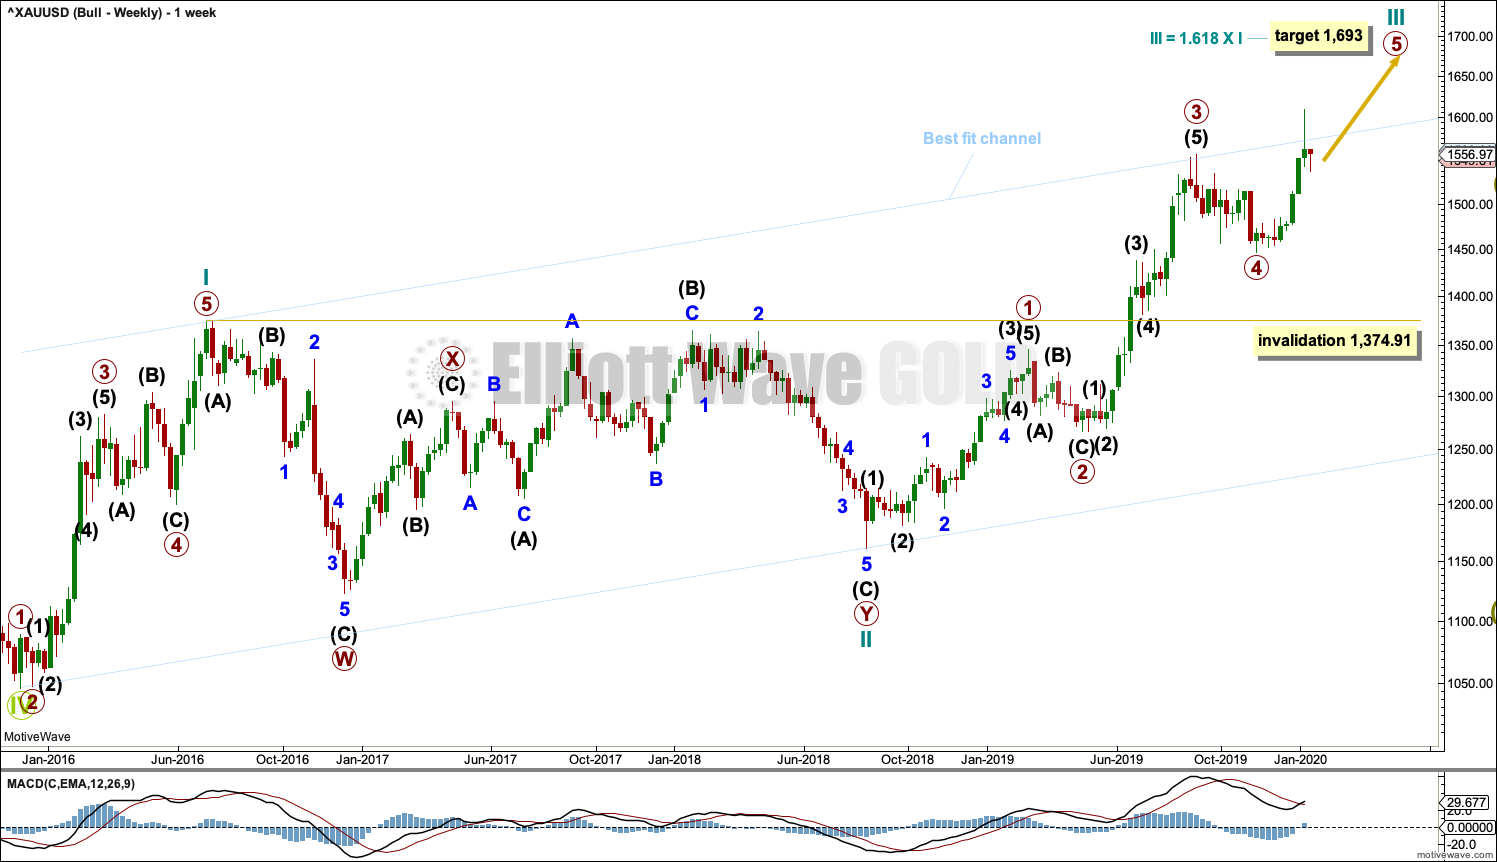
Click chart to enlarge.
This wave count sees the the bear market complete at the last major low for Gold on 3 December 2015.
If Gold is in a new bull market, then it should begin with a five wave structure upwards on the weekly chart. However, the biggest problem with this wave count is the structure labelled cycle wave I because this wave count must see it as a five wave structure, but it looks more like a three wave structure.
Commodities often exhibit swift strong fifth waves that force the fourth wave corrections coming just prior and just after to be more brief and shallow than their counterpart second waves. It is unusual for a commodity to exhibit a quick second wave and a more time consuming fourth wave, and this is how cycle wave I is labelled. This wave count still suffers from this very substantial problem, which is one reason why the bearish wave count is preferred because it has a better fit in terms of Elliott wave structure.
Cycle wave II subdivides well as a double combination: zigzag – X – expanded flat.
Cycle wave III may have begun. Within cycle wave III, primary waves 1 through to 4 may now be complete. Primary wave 5 may be complete at any stage now; this would complete the whole structure of cycle wave III. Cycle wave IV may not move into cycle wave I price territory below 1,374.91.
Add the wide best fit channel to weekly and daily charts.
DAILY CHART
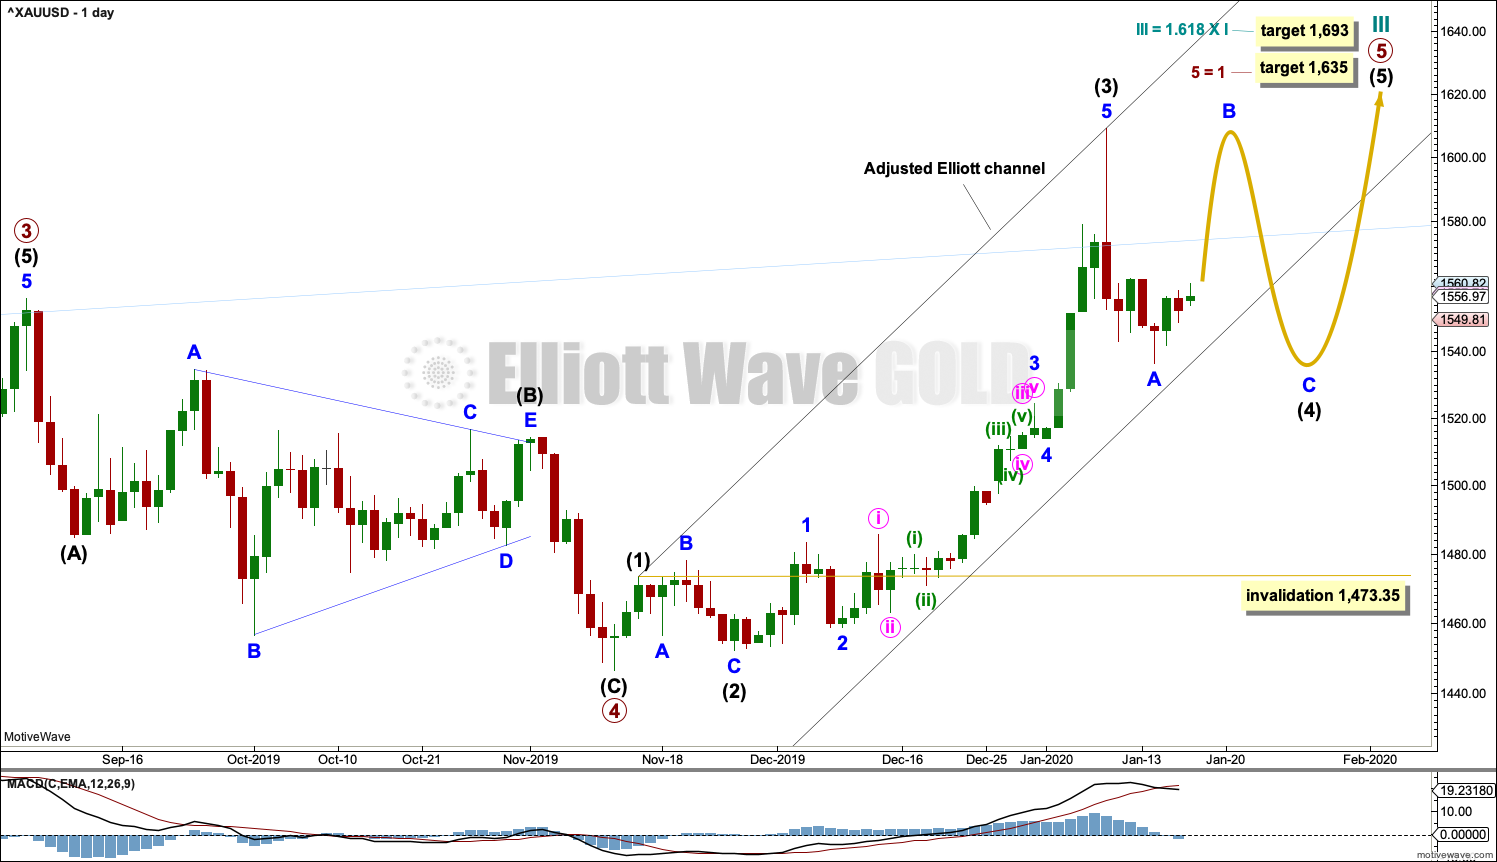
Click chart to enlarge.
A target for cycle wave III is calculated also now at primary degree. If price reaches the first target and keeps rising, then the second higher target may be used.
Primary wave 5 may only subdivide as a five wave structure, most likely an impulse. Within primary wave 5, intermediate waves (1) through to (3) may now be complete. Intermediate wave (4) may not move into intermediate wave (1) price territory below 1,473.35.
Draw an adjusted Elliott channel about primary wave 5. Intermediate wave (4) may find support at the lower edge.
This wave count for the next few weeks remains essentially the same as the main bearish wave count. Both wave counts are seeing a fourth wave unfold, to then be followed by a final fifth wave up.
This bullish wave count today considers the possibility that intermediate wave (4) may subdivide as a flat correction. It may also subdivide as a triangle, which is outlined in the bearish wave count.
TECHNICAL ANALYSIS
WEEKLY CHART
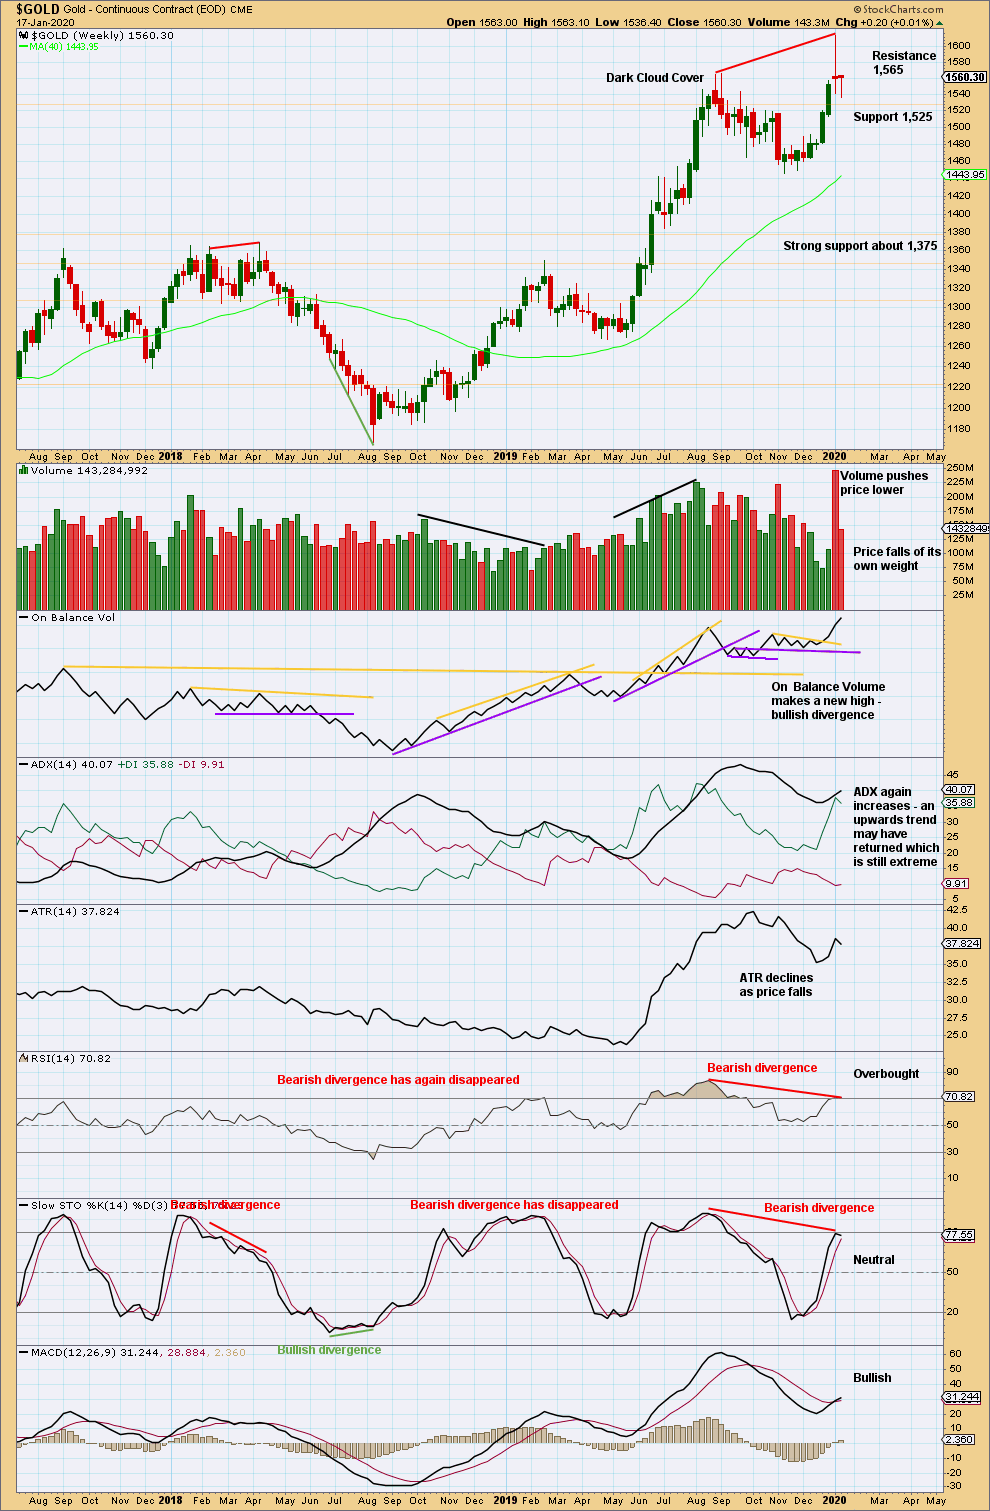
Click chart to enlarge. Chart courtesy of StockCharts.com.
Weak volume, small range and a long lower wick this week all suggest a bounce next week.
DAILY CHART
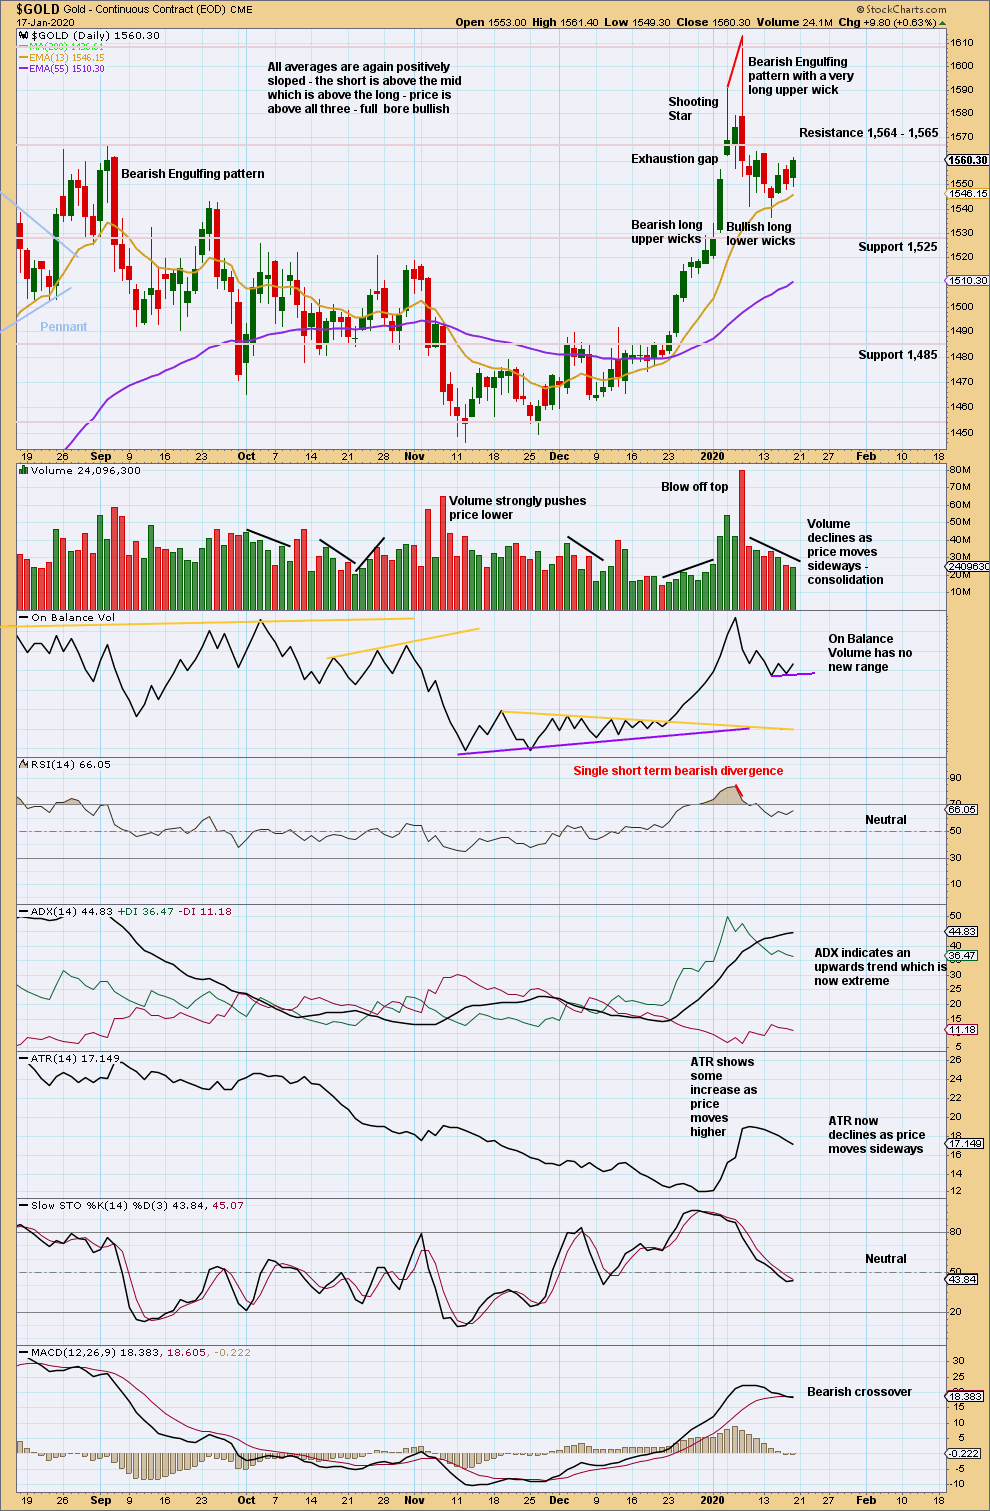
Click chart to enlarge. Chart courtesy of StockCharts.com.
The last Bearish Engulfing pattern has strong support from volume, which increases the bearish implications. Expect a trend change to either down or sideways. Now some decline in volume as price moves sideways suggests a consolidation is developing.
For the short term, a lack of support for upwards movement from volume over the last three sessions suggests a bounce here may be limited.
GDX WEEKLY CHART
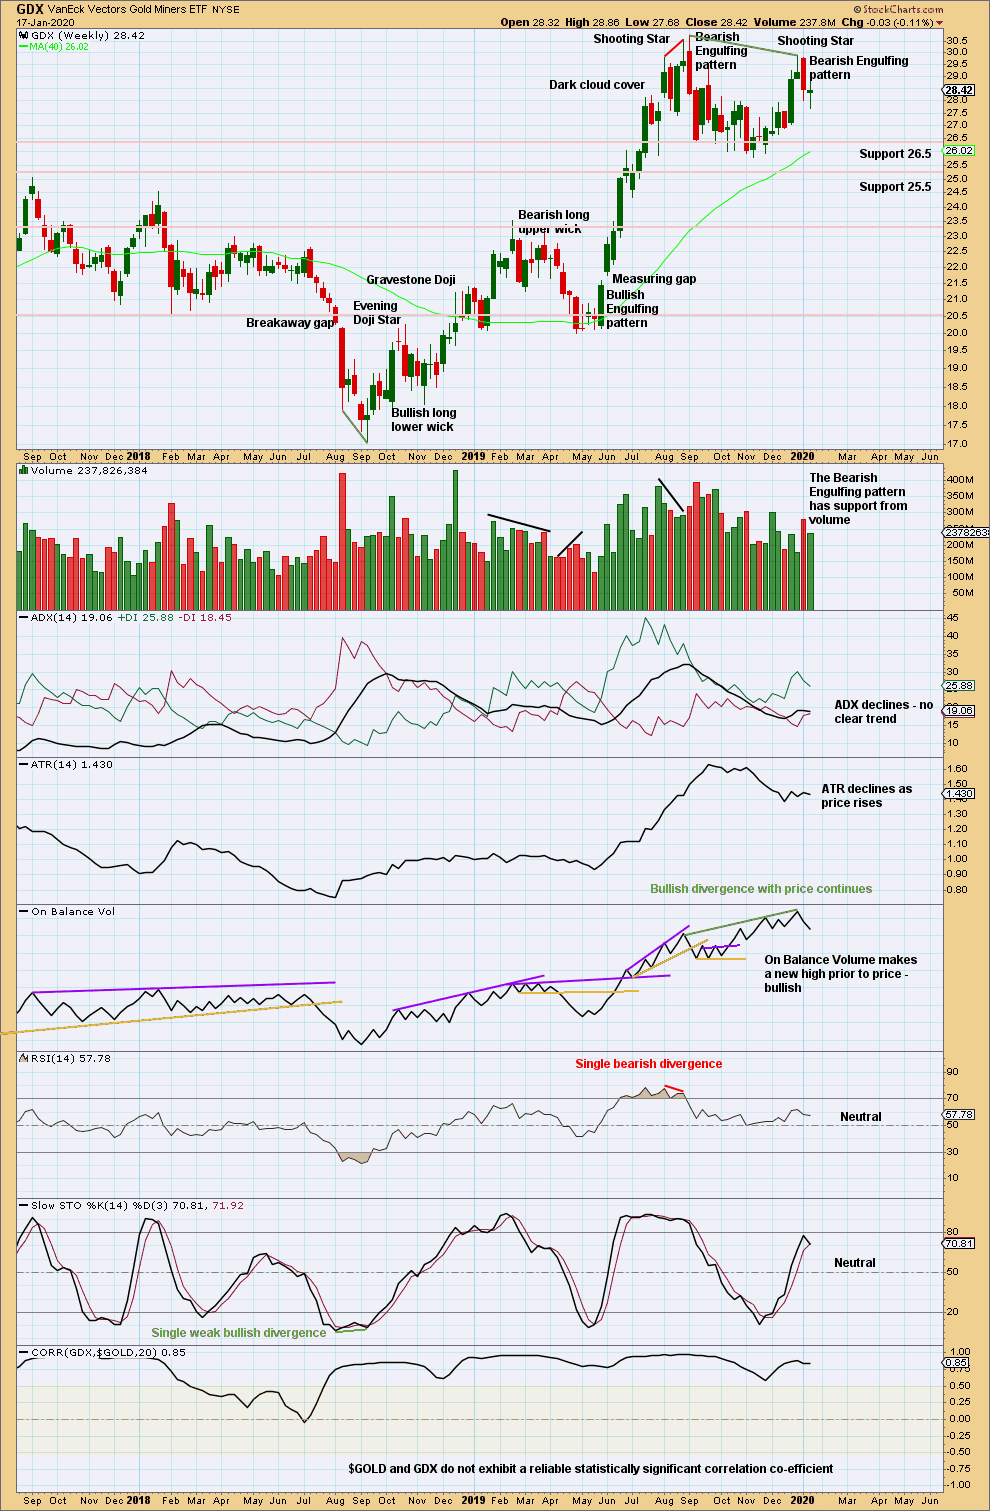
Click chart to enlarge. Chart courtesy of StockCharts.com.
Now two bearish candlestick patterns in a row, the second with support from volume, strongly suggest a trend change here to either down or sideways.
GDX DAILY CHART
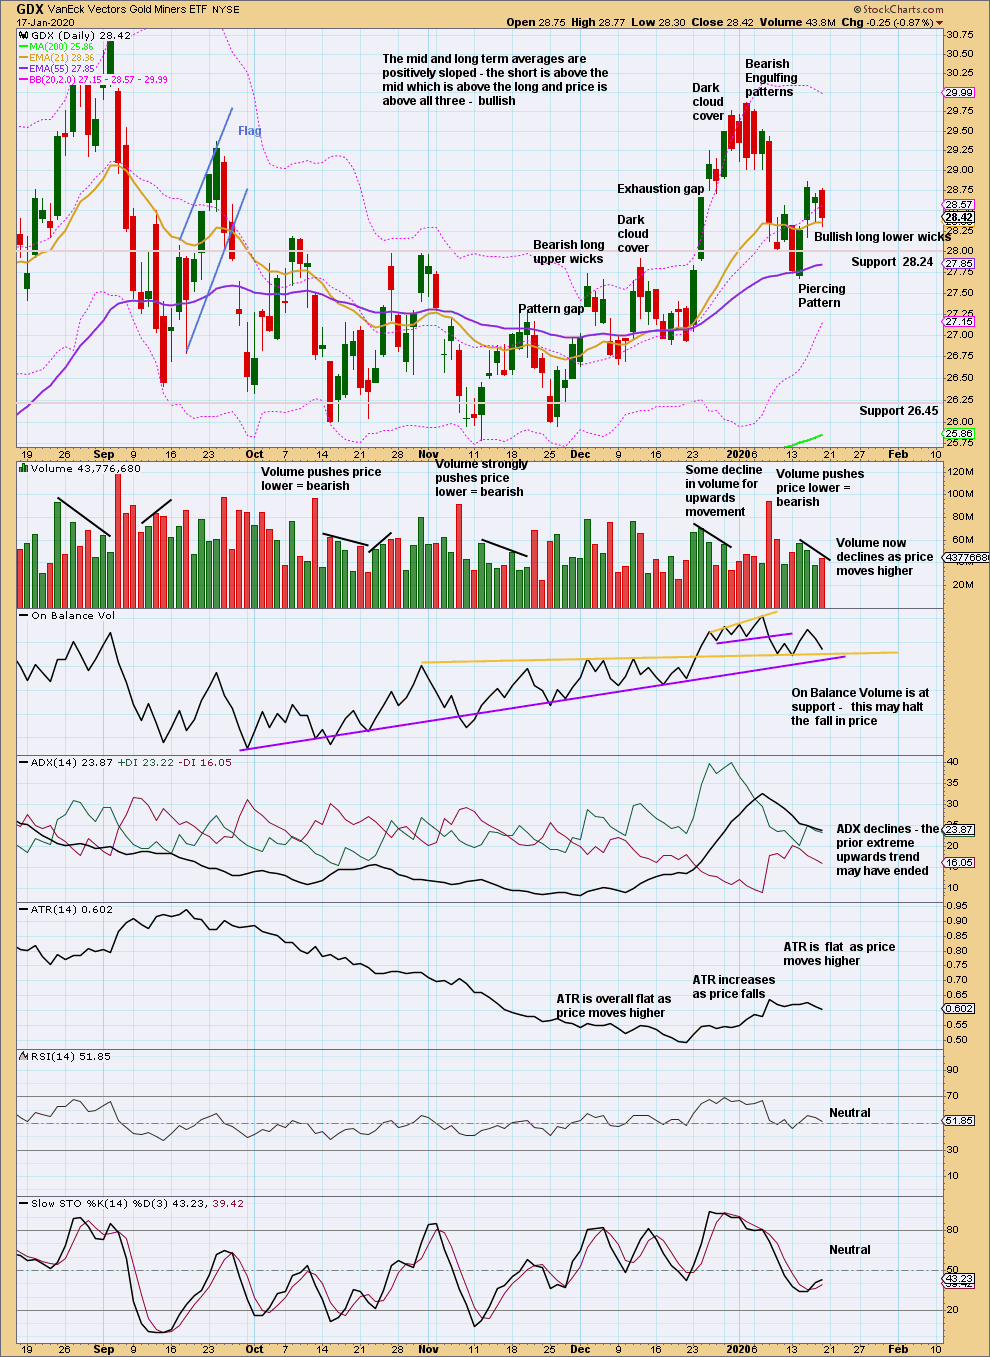
Click chart to enlarge. Chart courtesy of StockCharts.com.
A very strong bearish candlestick after an extreme upwards trend, along with closure of the last gap (now renamed an exhaustion gap) and now two bearish signals from On Balance Volume and volume supporting downwards movement and not upwards, strongly suggest GDX has found a high.
Some decline in volume with upwards movement suggests a little weakness in this bounce.
US OIL
Both Elliott wave counts again expected downwards movement for Oil, which is what has happened.
Summary: Both the bullish and bearish Elliott wave counts now expect downwards movement. Targets are either 48.81 or 44.61.
MAIN ELLIOTT WAVE COUNT – BEARISH
MONTHLY CHART
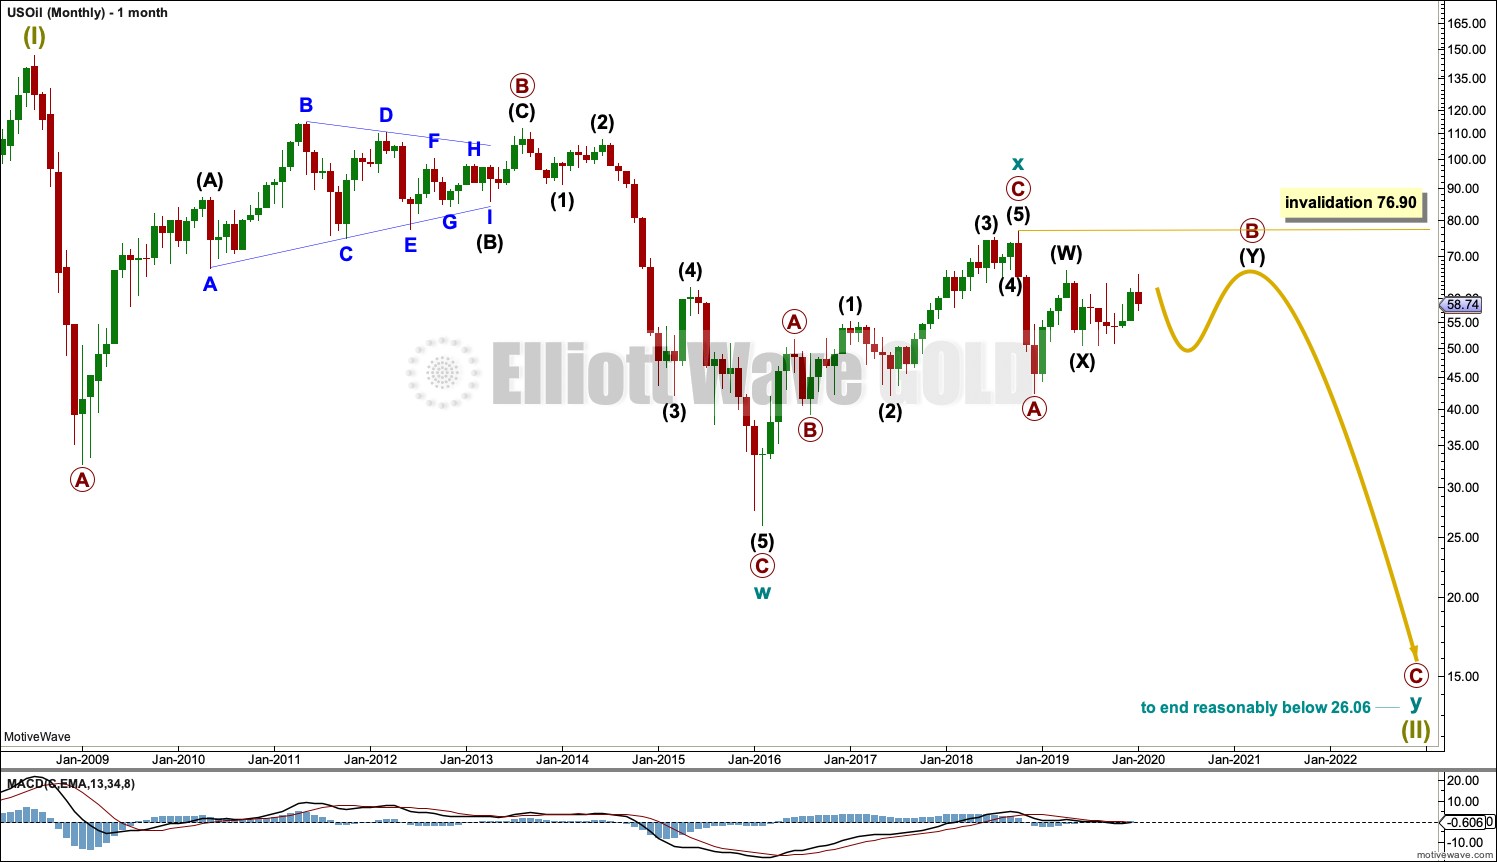
Click chart to enlarge.
The basic Elliott wave structure is five steps forward and three steps back. This Elliott wave count expects that US Oil is still within a three steps back pattern, which began in July 2008. The Elliott wave count expects that the bear market for US Oil continues.
This Elliott wave corrective structure is a double zigzag, which is a fairly common structure. The correction is labelled Super Cycle wave (II).
The first zigzag in the double is complete and labelled cycle wave w. The double is joined by a three in the opposite direction labelled cycle wave x, which subdivides as a zigzag. The second zigzag in the double may now have begun, labelled cycle wave y.
The purpose of a second zigzag in a double zigzag is to deepen the correction when the first zigzag does not move price deep enough. To achieve this purpose cycle wave y may be expected to move reasonably below the end of cycle wave w at 26.06. When primary wave B may be complete then the start of primary wave C may be known and a target may be calculated.
Cycle wave y is expected to subdivide as a zigzag, which subdivides 5-3-5.
Cycle wave w lasted 7.6 years and cycle wave x lasted 2.7 years. Cycle wave y may be expected to last possibly about a Fibonacci 5 or 8 years.
Primary wave B may not move beyond the start of primary wave A above 76.90.
WEEKLY CHART
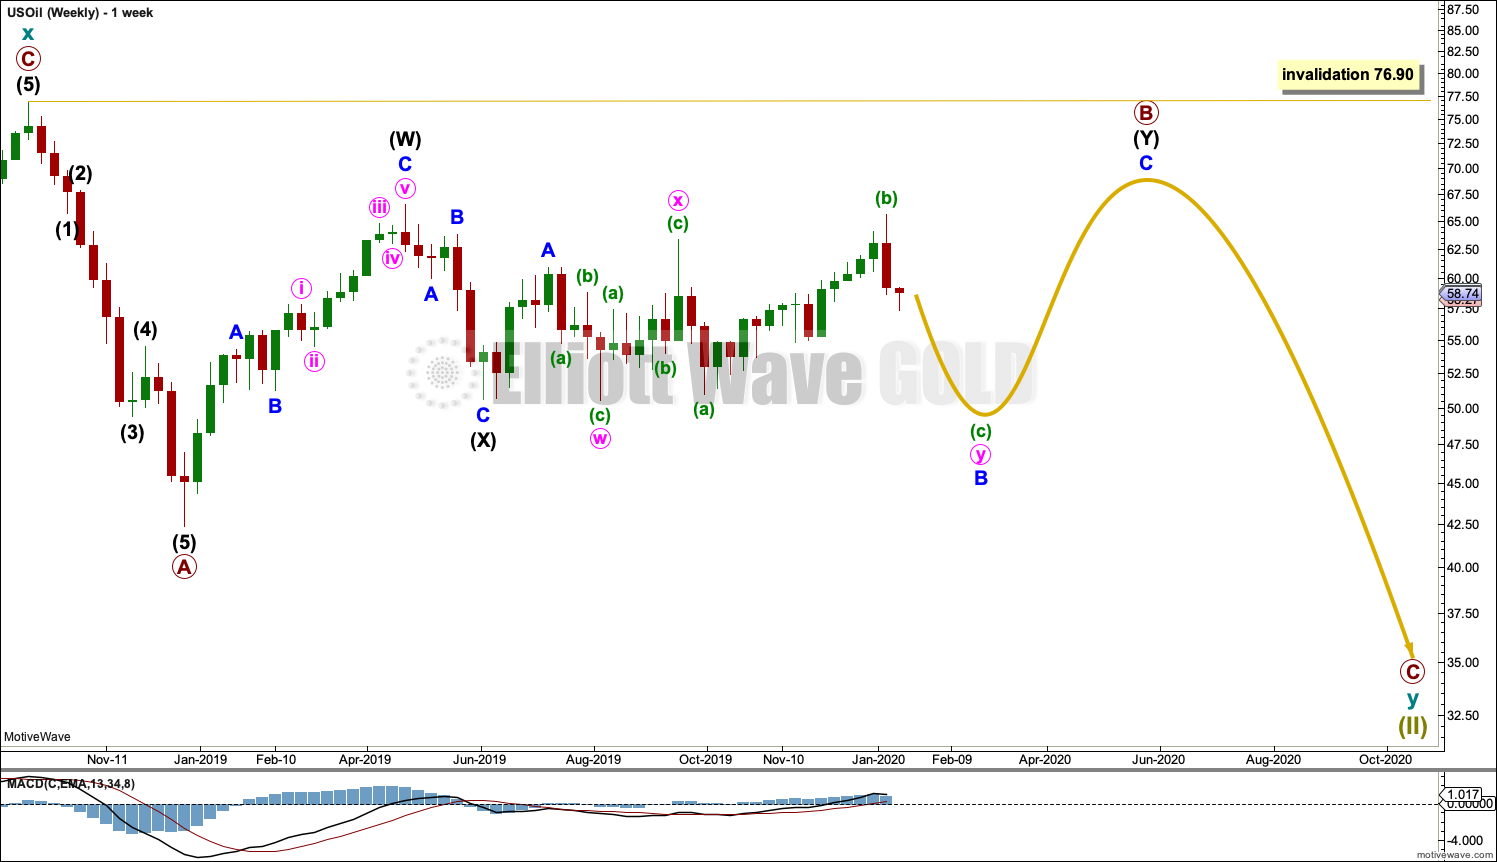
Click chart to enlarge.
This weekly chart shows all of cycle wave y so far.
Cycle wave y is expected to subdivide as a zigzag. A zigzag subdivides 5-3-5. Primary wave A must subdivide as a five wave structure if this wave count is correct.
Primary wave A may be a complete five wave impulse at the last low.
Primary wave B may be a double combination: zigzag – X – flat. Intermediate wave (W) fits as a zigzag. Intermediate wave (Y) may be unfolding as a flat correction.
Within intermediate wave (Y), minor wave A may be complete. Minor wave B may be an incomplete double combination.
When primary wave B may be complete, then a downwards breakout would be expected for primary wave C.
Primary wave B may not move beyond the start of primary wave A above 76.90.
DAILY CHART
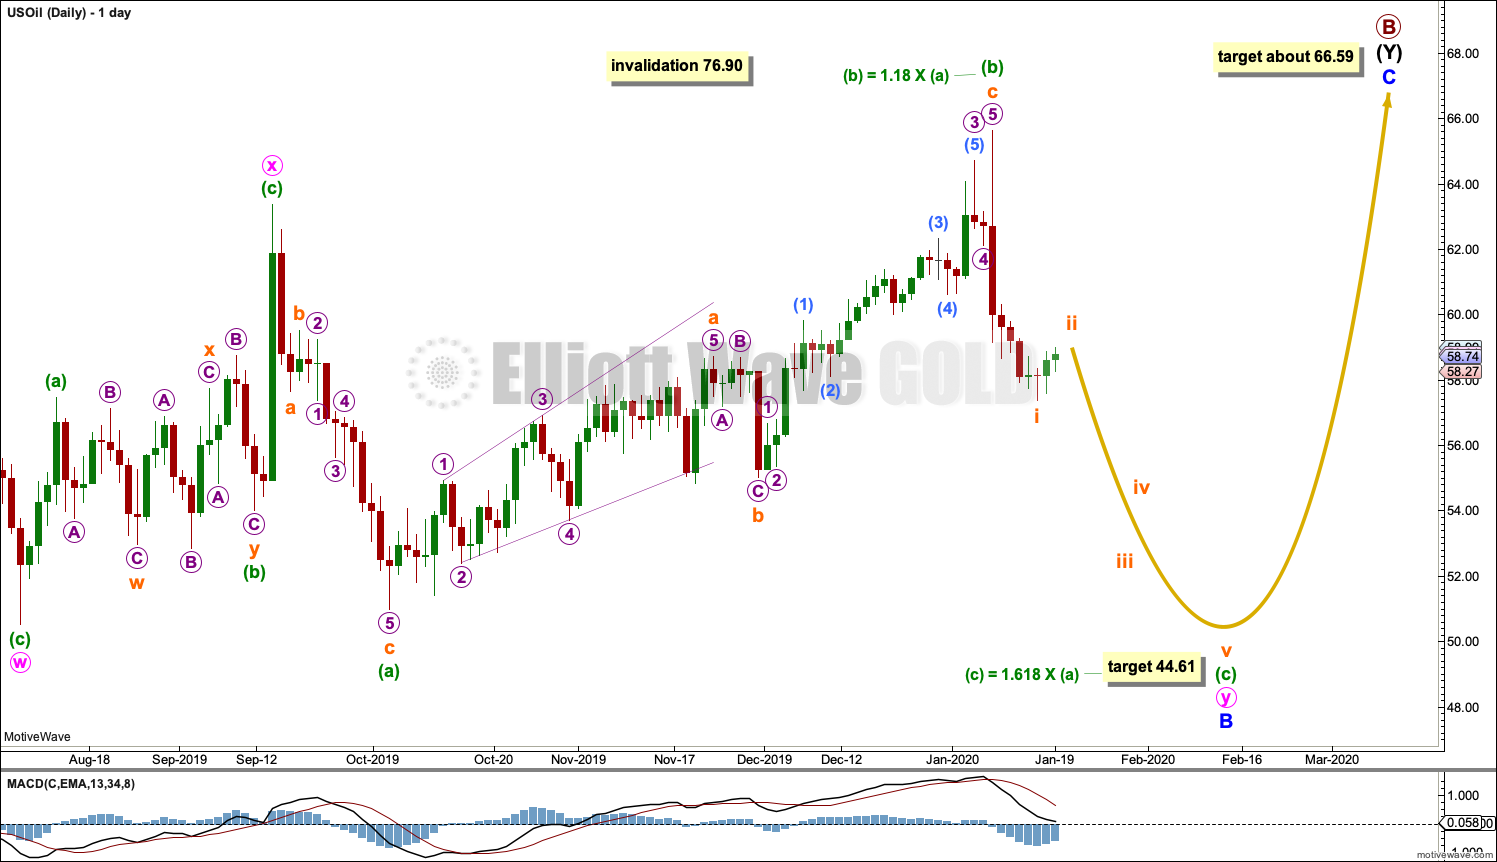
Click chart to enlarge.
This daily chart shows all of intermediate wave (Y) so far.
Intermediate wave (Y) may be subdividing as a flat correction. Within the flat, minor wave A subdivides as a three and minor wave B may be an incomplete three. At its end, minor wave B must retrace a minimum 0.9 of minor wave A at 51.74.
Minor wave B may be subdividing as a double combination: zigzag – X – flat. Within the flat correction of minute wave y, minuette wave (b) has now retraced the minimum requirement of 0.9 the length of minuette wave (a); minuette wave (b) is within the common range of 1 – 1.38 times the length of minuette wave (a). Minuette wave (c) should now move at least slightly below the end of minuette wave (a) at 51.00 to avoid a truncation and a very rare running flat. The target calculated expects a common Fibonacci ratio to minuette wave (a).
Minuette wave (c) must subdivide as a five wave structure, most likely an impulse. Within minuette wave (c), subminuette wave ii may not move beyond the start of subminuette wave i above 66.54.
When minor wave B may be complete, then minor wave C should move higher to end above the end of minor wave A at 60.93.
This wave count now expects the consolidation that Oil has been in for some months now may continue for several more weeks. A downwards swing may have begun and may take a few weeks to reach support.
ALTERNATE ELLIOTT WAVE COUNT
MONTHLY CHART
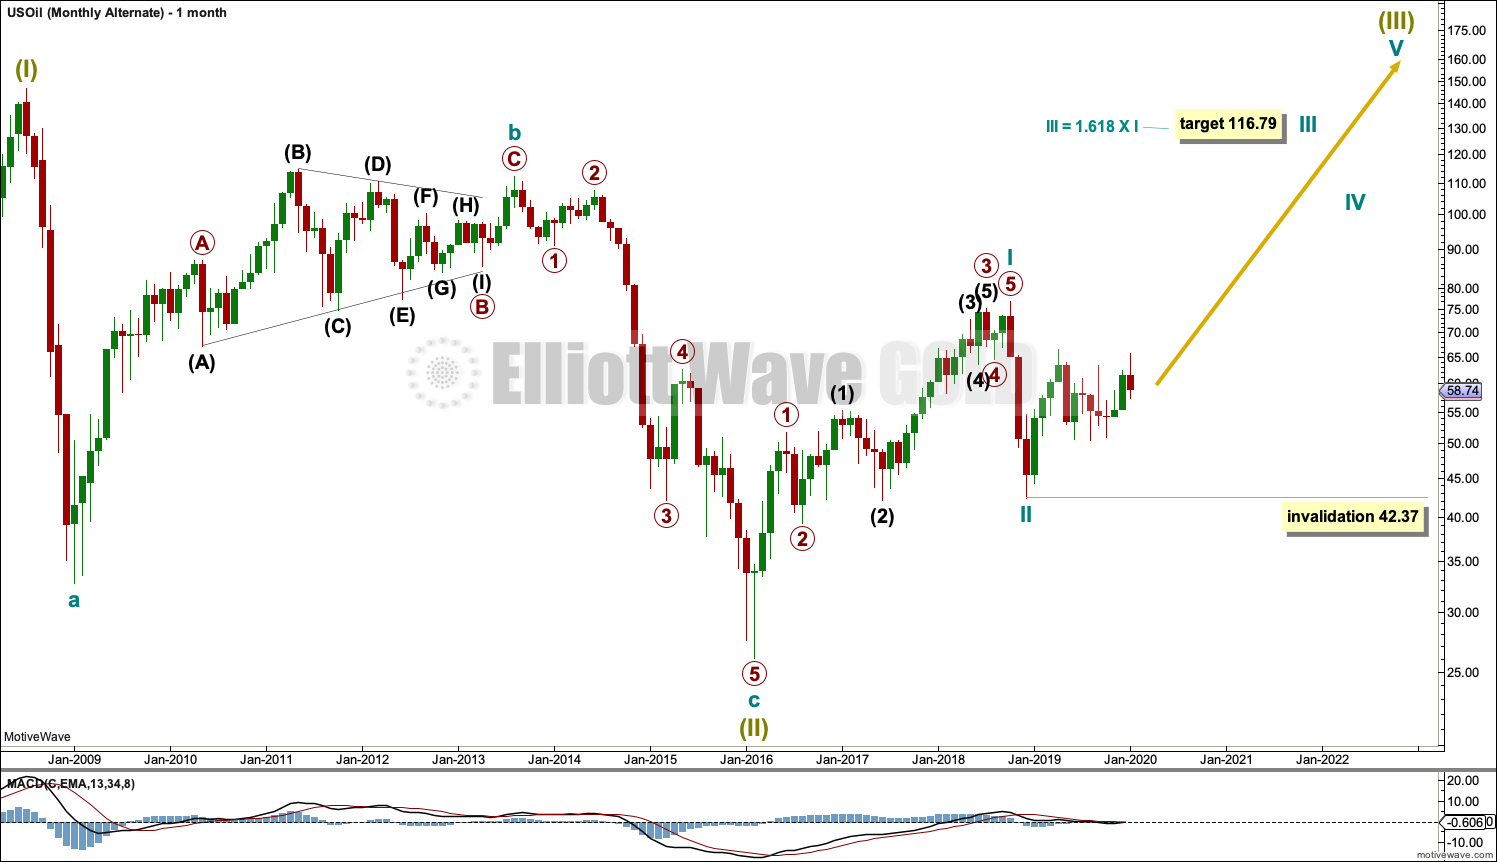
Click chart to enlarge.
It is possible that the bear market is over for Oil and a new bull market has begun.
For a bullish wave count for Oil, the upwards wave from the major low at 26.06 in February 2016 must be seen as a complete five wave impulse. This is labelled cycle wave I.
Cycle wave II may be a complete zigzag at 0.679 the depth of cycle wave I.
A target is calculated for cycle wave III to reach a common Fibonacci ratio to cycle wave I.
Within cycle wave III, no second wave correction may move beyond the start of its first wave below 42.37.
WEEKLY CHART
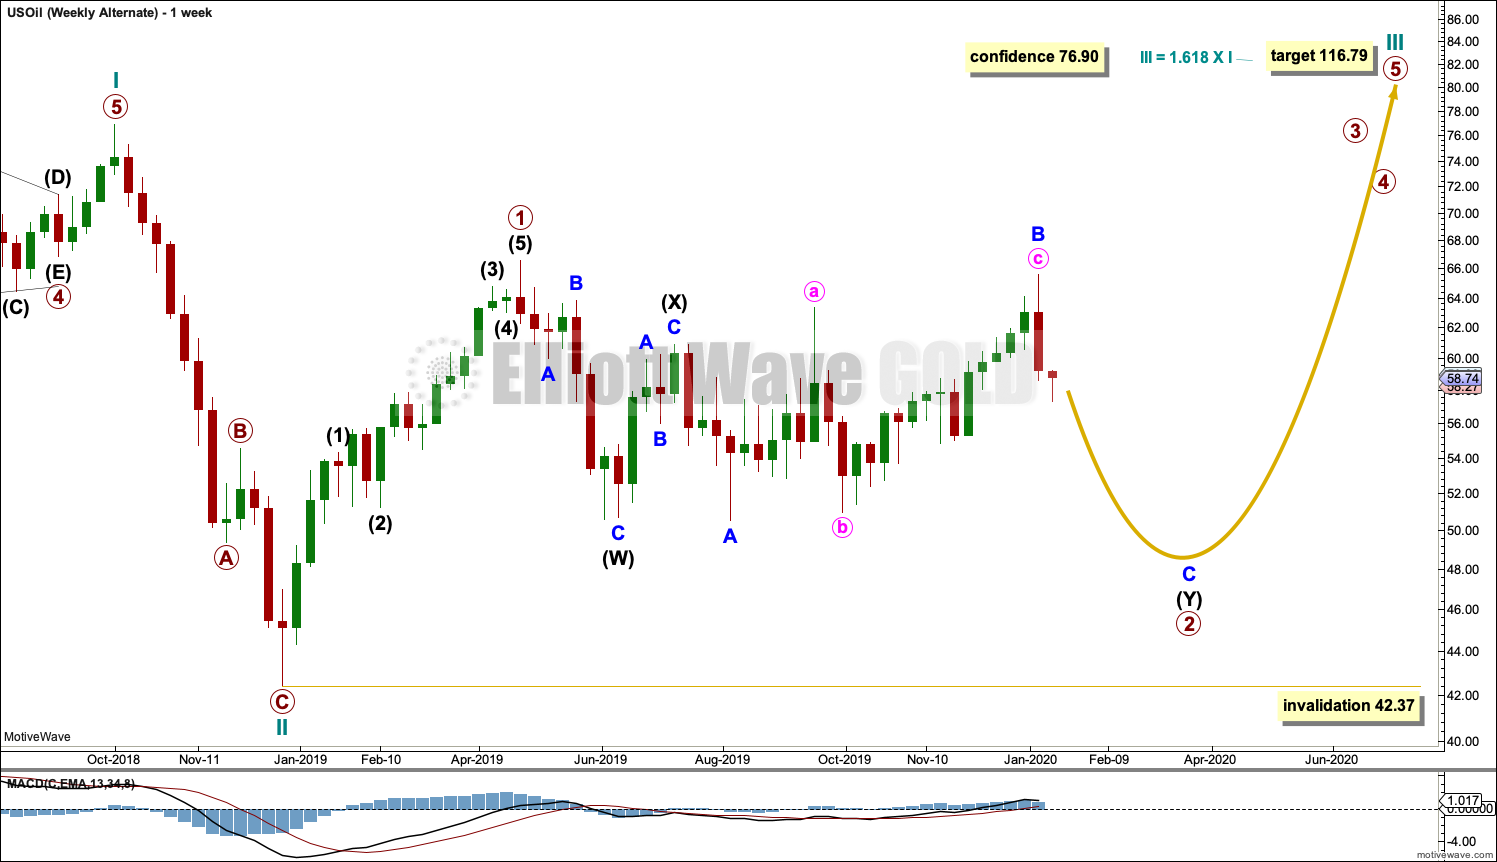
Click chart to enlarge.
Cycle wave II does look best as a three. This is the only part of this wave count that has a better look than the main wave count, which sees this downwards wave as a five.
The upwards wave of primary wave 1 within cycle wave III must be seen as a five wave structure for a bullish wave count to work. This movement at lower time frames does not subdivide well as a five; this reduces the probability of this wave count.
Cycle wave III may only subdivide as an impulse. Within cycle wave III, so far primary wave 1 may be complete. Primary wave 2 may be moving sideways as a double combination. Primary wave 2 may not move beyond the start of primary wave 1 below 42.37.
Primary wave 2 may be continuing as a double combination.
The first structure in the double would be complete, a zigzag labelled intermediate wave (W). Within intermediate wave (W), minor wave C ends with a slight truncation for minute wave v. This is acceptable.
The double may be now joined by a complete three in the opposite direction, a zigzag labelled intermediate wave (X).
Intermediate wave (Y) may now be completing as an expanded flat correction.
DAILY CHART

Click chart to enlarge.
Intermediate wave (Y) may be unfolding as an expanded flat correction. Within the expanded flat, minor wave A subdivides as a three and minor wave B may now be a complete three that is just beyond the normal range of 1 to 1.38 times the length of minor wave A. This is still acceptable. The wave count remains valid.
A target is calculated for minor wave C that expects a common Fibonacci ratio to minor wave A. Minor wave C would be likely to make at least a slight new low below the end of minor wave A at 50.53 to avoid a truncation and a very rare running flat.
Minor wave C must subdivide as a five wave structure, most likely an impulse. Within minor wave C, minute wave ii may not move beyond the start of minute wave i above 66.64.
Primary wave 2 may not move beyond the start of primary wave 1 below 42.37.
TECHNICAL ANALYSIS
MONTHLY CHART
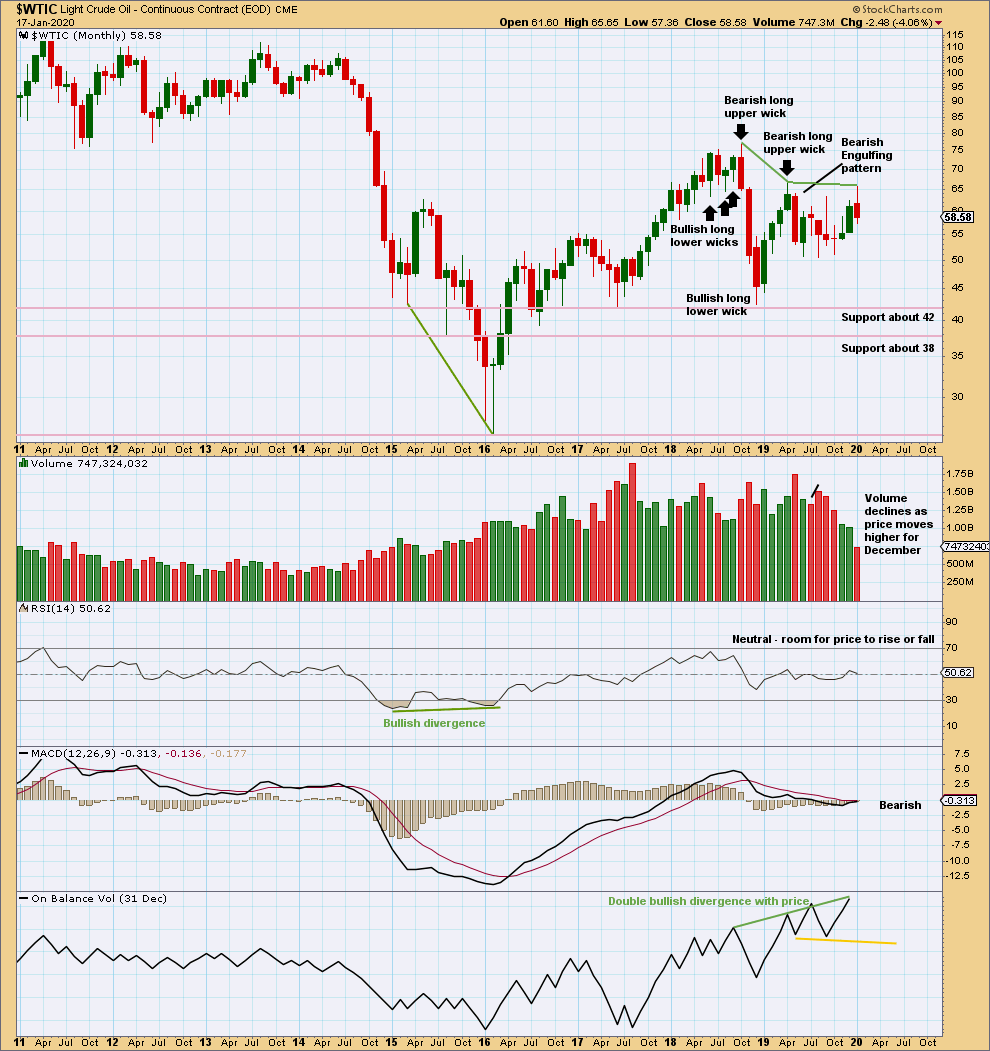
Click chart to enlarge. Chart courtesy of StockCharts.com.
There is now double bullish divergence between price and On Balance Volume. This supports the alternate Elliott wave count.
Overall, price has been moving sideways for a few months now. Within this sideways movement, the downwards month of May has greatest range and volume; this supports the main Elliott wave count. The last completed month of December 2019 closes within the range and lacks support from volume.
WEEKLY CHART
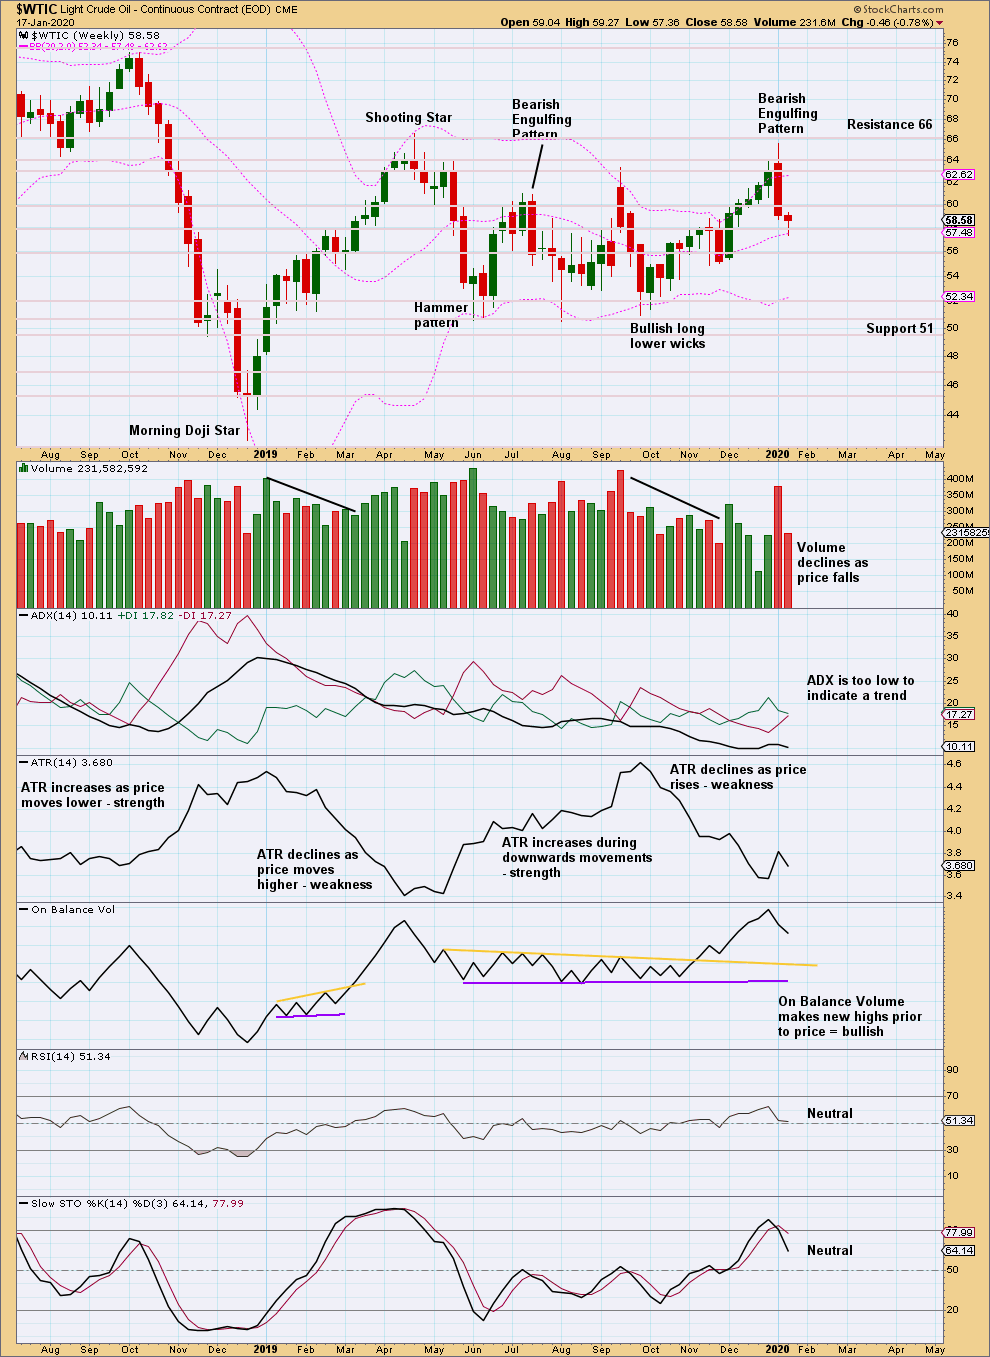
Click chart to enlarge. Chart courtesy of StockCharts.com.
The triangle is removed from the chart as it is no longer valid. Price is consolidating, swinging from support to resistance and back again. Support is about 51 and resistance is about 66. Price has last week reached resistance while Stochastics reached overbought, and price has then reacted strongly downwards from there. Expect now to see a downwards swing to support about 51 to end when price is at support and Stochastics reaches oversold about the same time.
When price consolidates, each swing is normally very choppy and overlapping. Do not expect price to move in a straight line.
DAILY CHART

Click chart to enlarge. Chart courtesy of StockCharts.com.
The weekly time frame is best to view the larger consolidation. This daily time frame focusses more on each swing within the larger consolidation.
For the short term, look for a bounce within this larger downwards swing.
—
Always practice good risk management as the most important aspect of trading. Always trade with stops and invest only 1-5% of equity on any one trade. Failure to manage risk is the most common mistake new traders make.
I am not sure what degree we are in and do not have much to offer in debate. I do appreciate your different views as it makes me think and measure. One thing that strikes me on the monthly charts is how compressed the 3-4-5 cycles are. I normally like to think of 4’s as a way to extend the move (in time) because they can include triangles. Just an observation
I assume you’re referring to the S&P500 in this comment.
The S&P500 has a very strong bullish bias throughout its entire history. So corrections are quicker than bullish moves.
Cycle III on my main count lasted 31 months, cycle IV lasted 3 months and so far cycle V has lasted 13 months.
This is mostly within a normal duration of one to seven years, or 12 to 84 months. The brevity of cycle IV is acceptable because for this market corrections can be more brief than expectations.
Hi Lara,
Happy New Year from Cold Canada.
Thanks so much for your S&P 500 monthly charts this week… Very much appreciated.
They were very timely as I was going to ask you about alternatives… I have been also watching Ciovacco as well and he is giving compelling evidence of a massive rally in the next few years.
Also, the ratio GDX:QQQ is starting to fail and I am starting to believe your scenario that Gold will break down.
As a result, the Nasdaq will melt up for the next few years as I think that’s where all the printed money will go into…
We have to respect the charts…
All the best to you,
Mathieu
Thanks Mathieu, Happy New Year to you too.
Ciovacco is very good, I highly recommend his videos to all members. I have just realised the links are not here in the new iteration of this website, I’ll add them.