
GOLD: Elliott Wave and Technical Analysis | Charts – February 3, 2020
Upwards movement continues. Price remains above the short-term invalidation point.
Summary: Upwards movement may continue this week. Targets are 1,626 (main bear count) or 1,635 then 1,693 (bull count).
Alternatively, a new low below 1,536.52 would indicate a high was in place on the 8th of January and a downwards trend has begun. The alternate bearish wave count outlines this possibility.
Grand SuperCycle analysis is here.
Monthly charts were last updated here.
BEARISH ELLIOTT WAVE COUNT
WEEKLY CHART
Click chart to enlarge.
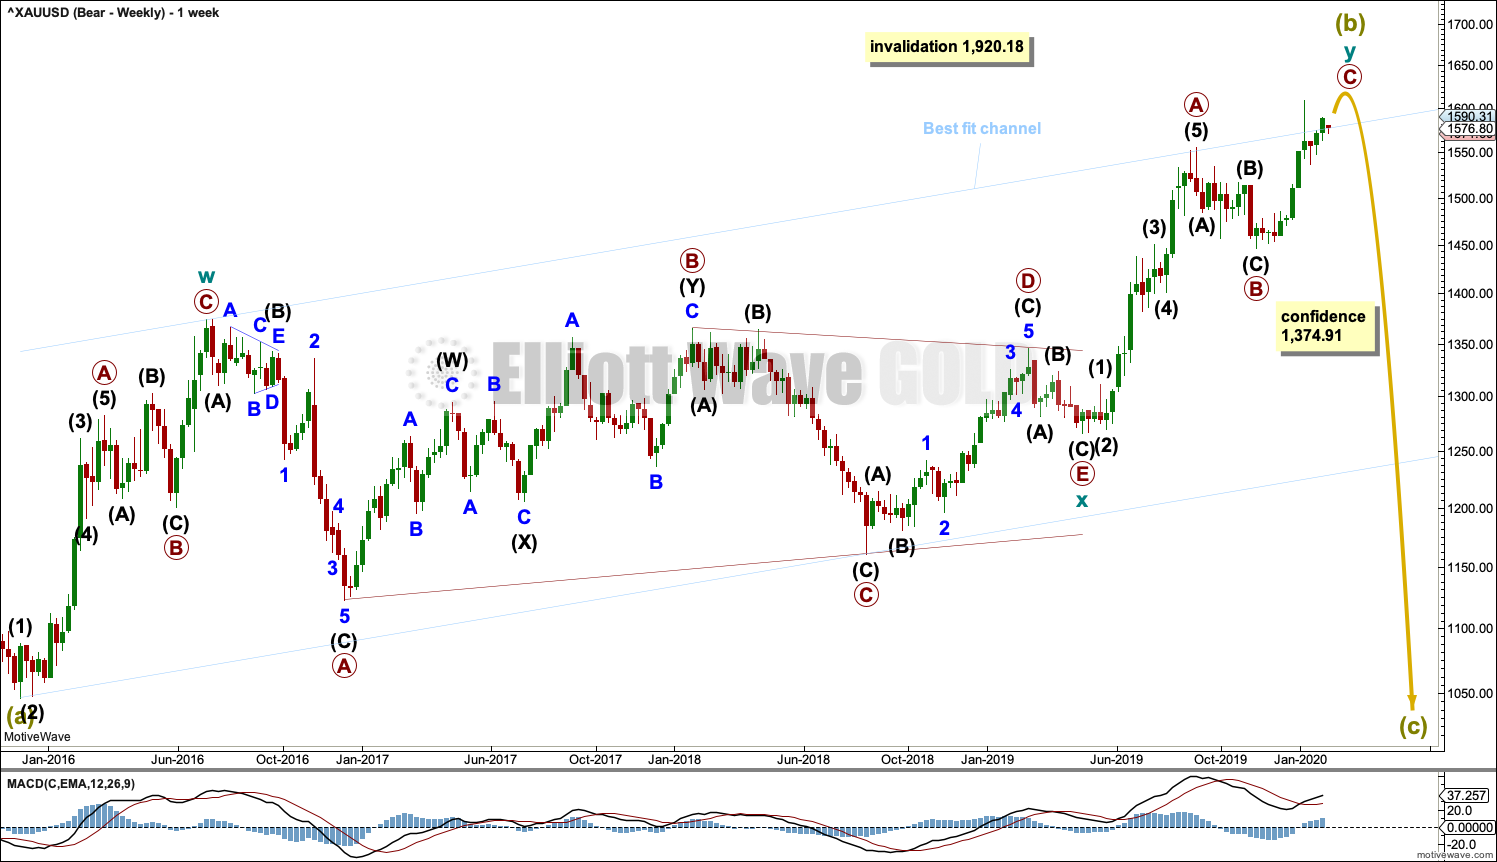
Super Cycle wave (b) may still be an incomplete double zigzag, requiring one more high.
The first zigzag in the double is labelled cycle wave w. The double is joined by a three in the opposite direction, a triangle labelled cycle wave x. The second zigzag in the double is labelled cycle wave y.
The purpose of the second zigzag in a double is to deepen the correction. Cycle wave y has achieved this purpose.
After the structure of cycle wave y may be complete, then a new low below 1,374.91 would add strong confidence to this wave count. At that stage, the bullish Elliott wave count would be invalidated. At that stage, targets for Super Cycle wave (c) would be calculated.
A wide best fit channel is added in light blue. Copy this channel over to daily charts. The upper edge of this channel has again been overshot and now price has returned back to within the channel.
DAILY CHART
Click chart to enlarge.
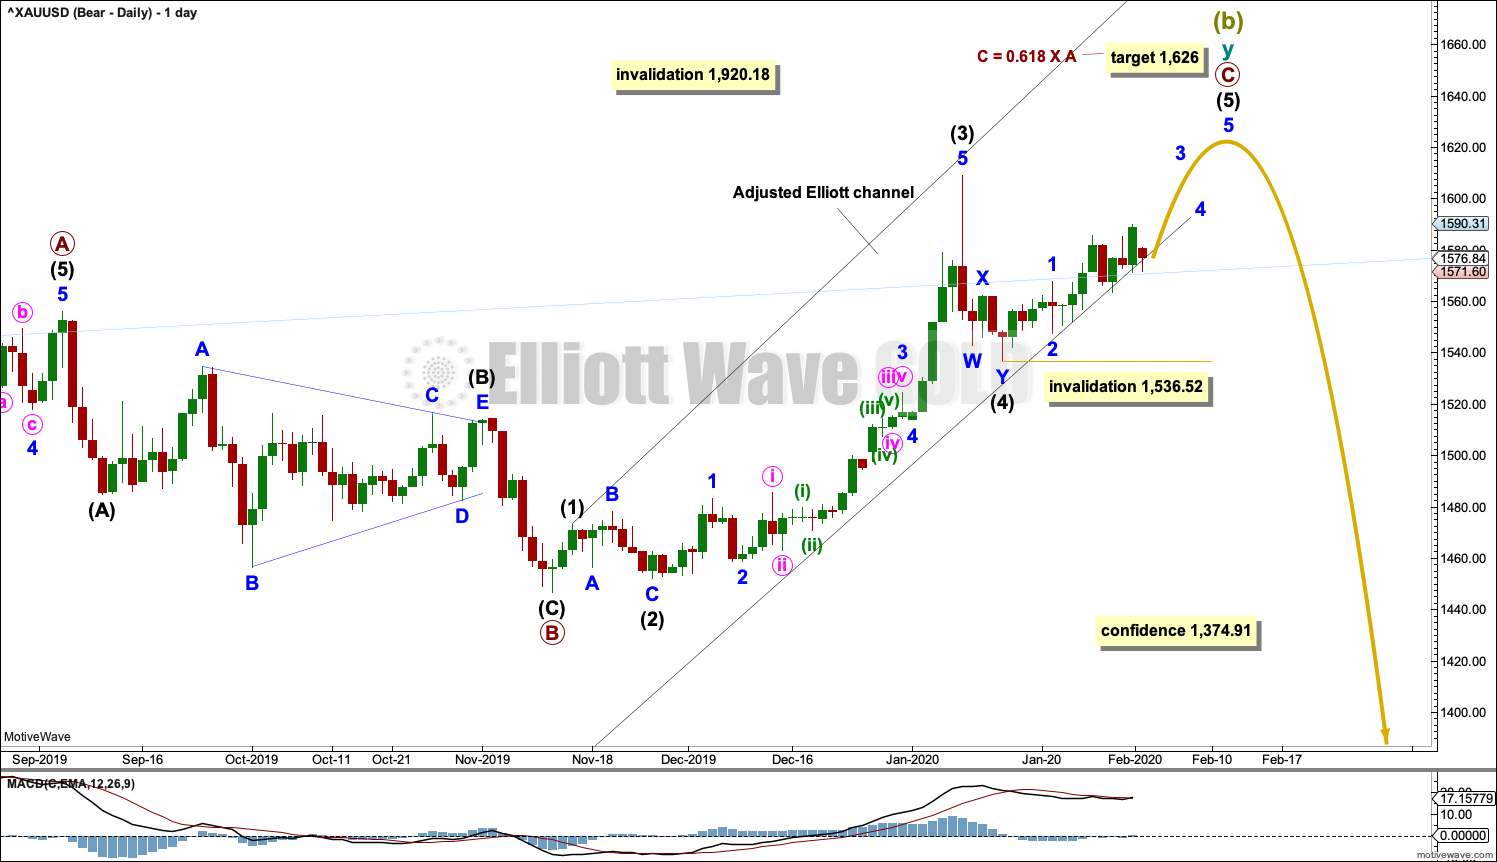
The double zigzag for Super Cycle wave (b) may be still incomplete.
Within cycle wave y, primary waves A and B are complete. Primary wave C must complete as a five wave structure. It is unfolding as an impulse. Within the impulse, intermediate waves (1) to (4) may now be complete.
Intermediate wave (2) was a deep 0.79 zigzag, which lasted 8 sessions. Intermediate wave (4) may have been a shallow 0.46 double zigzag lasting 4 sessions. Fourth waves are usually more brief than second waves for Gold.
Within intermediate wave (5), no second wave correction may move beyond the start of its first wave below 1,536.52.
Drawn an Elliott channel about primary wave C and then pull the lower edge down to sit on recent lows. The lower edge may provide support to intermediate wave (5) as it continues higher. Copy this channel over to hourly charts.
HOURLY CHART
Click chart to enlarge.
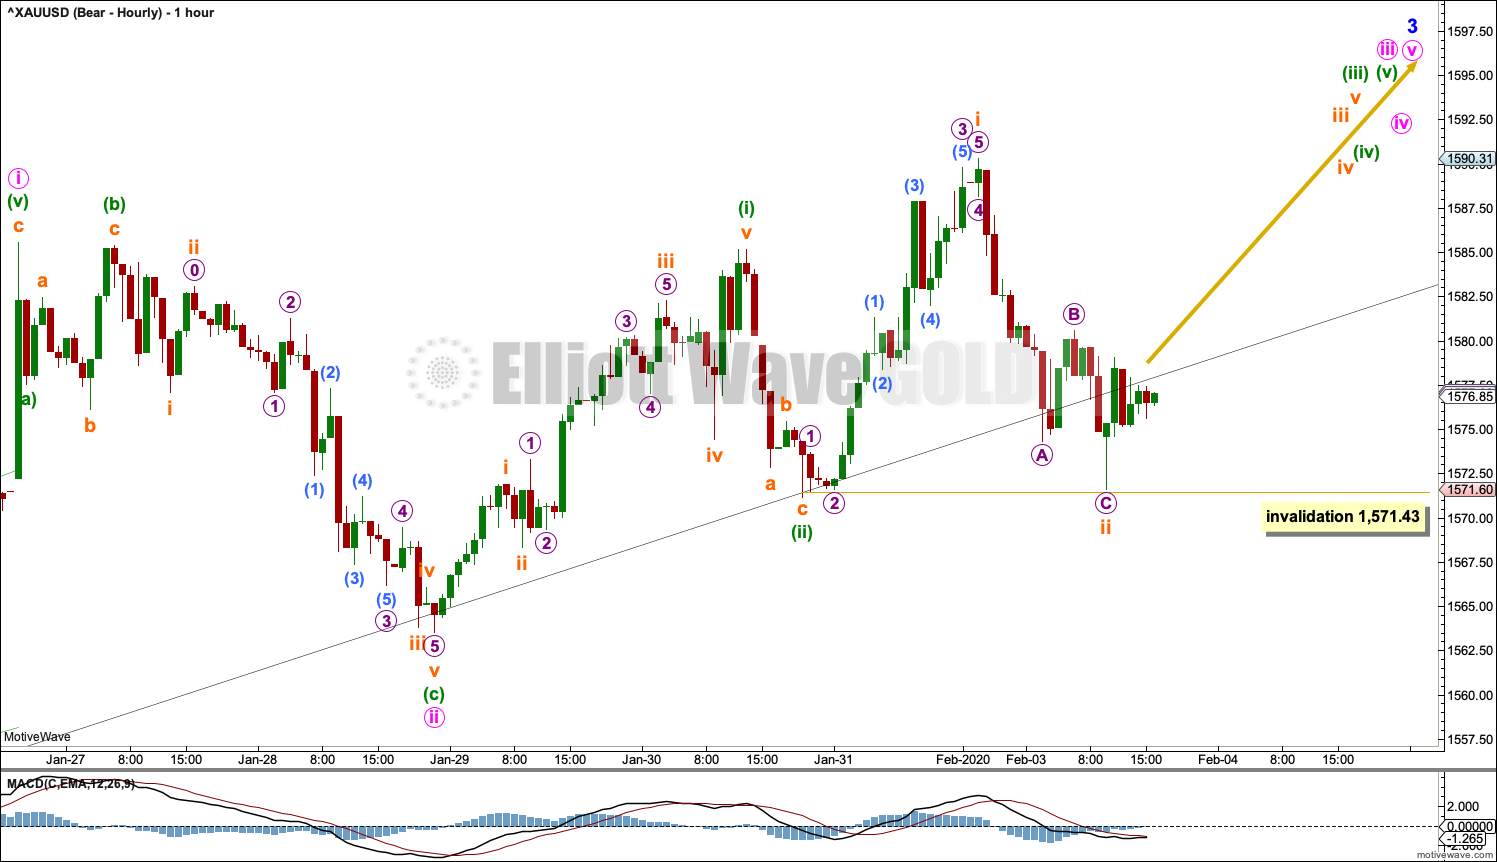
Today all hourly charts will show all movement from the high of the 27th of January.
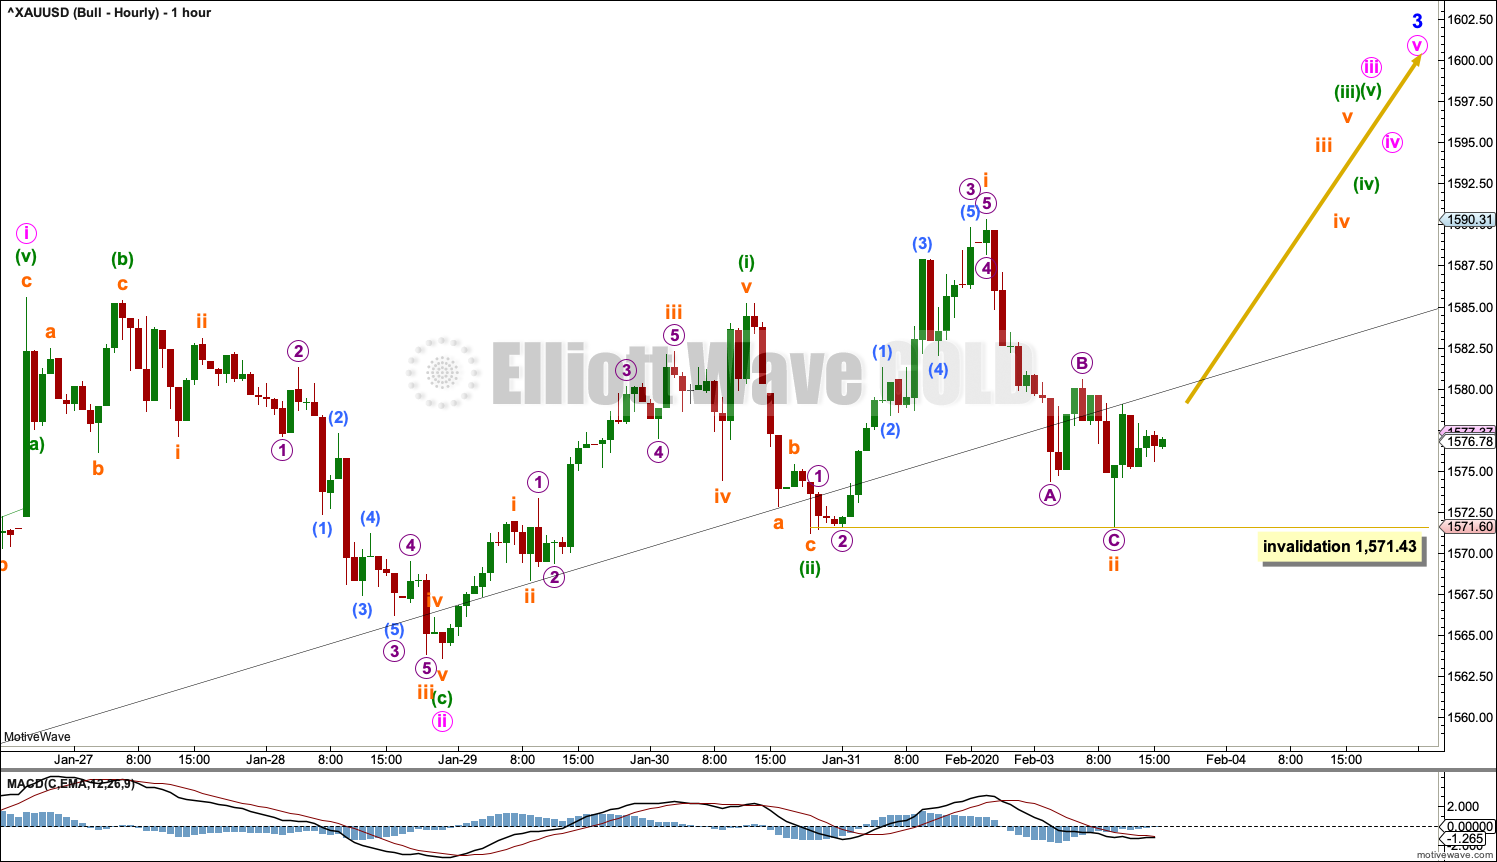
Intermediate wave (5) may only subdivide as a five wave structure, either an impulse or an ending diagonal. An impulse is much more common and so far that has a better fit.
Within intermediate wave (5), there may now be a series of four overlapping first and second waves: minor, minute, minuette and subminuette. If it continues lower, then subminuette wave ii may not move beyond the start of subminuette wave i below 1,571.43.
This wave count now expects an increase in upwards momentum as a third wave at four degrees unfolds.
At its end, intermediate wave (5) would be very likely to make at least a slight new high above the end of intermediate wave (3) at 1,609.12 to avoid a truncation.
ALTERNATE DAILY CHART
Click chart to enlarge.
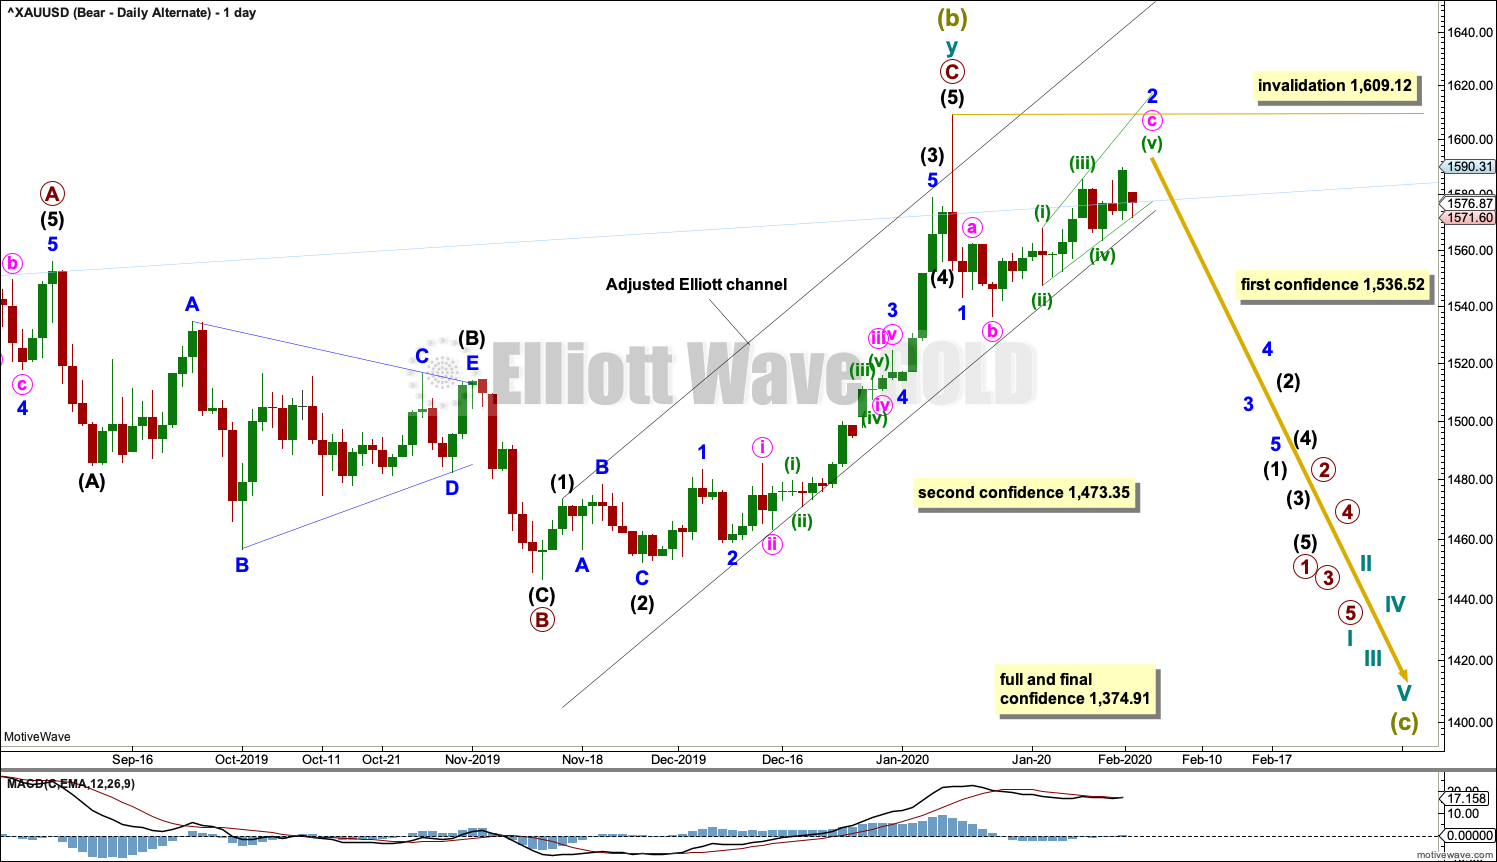
Alternatively, it is possible again that Super Cycle wave (b) may be complete and the bear market for Gold may have resumed.
A new low below 1,536.52 would invalidate the main bearish wave count and add some confidence in this alternate. A new low below 1,473.35 would add further confidence. Thereafter, a new low by any amount at any time frame below 1,374.91 would invalidate the bullish wave count below and add full and final confidence in this wave count. Targets for Super Cycle wave (c) would be calculated at that stage.
If Super Cycle wave (c) has begun, then it should develop a five wave structure downwards at all time frames up to and including monthly.
Minor wave 1 may be complete. Minor wave 2 may not move beyond the start of minor wave 1 above 1,609.12.
ALTERNATE HOURLY CHART
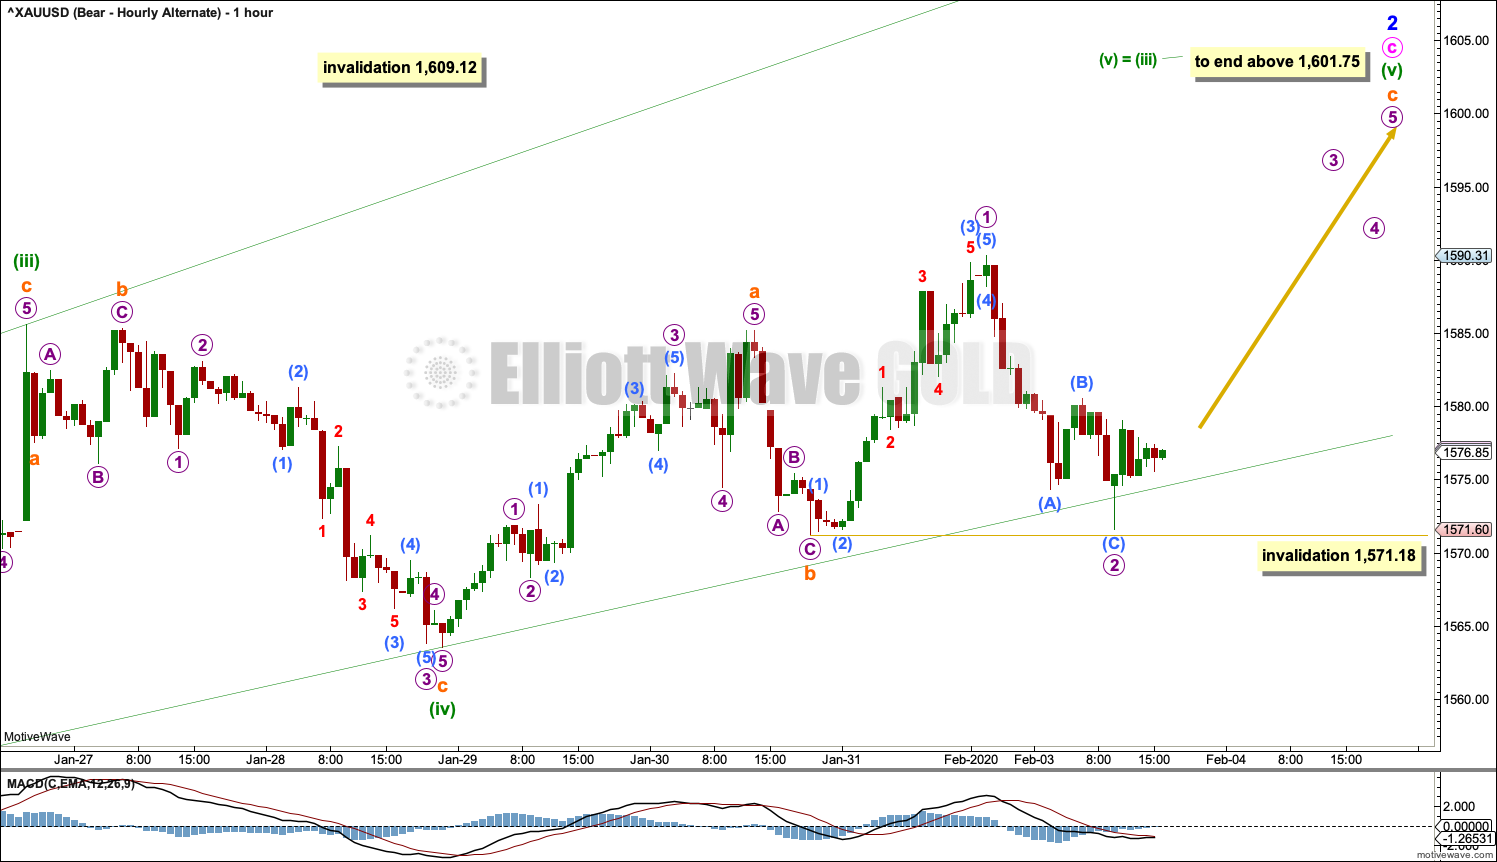
Click chart to enlarge.
Minor wave 2 may be still incomplete as an expanded flat. Within the expanded flat, minute wave c must subdivide as a five wave structure. Minute wave c may be unfolding as an ending expanding diagonal.
All sub-waves within an ending diagonal must subdivide as zigzags. Minuette wave (iv) must overlap into minuette wave (i) price territory.
The diagonal should be expanding: minuette wave (iii) is longer than minuette wave (i), and minuette wave (iv) is longer than minuette wave (ii). Minuette wave (v) must be longer than minuette wave (iii) in length for Elliott wave rules regarding expanding diagonals to be met. Minuette wave (v) would reach equality in length with minuette wave (iii) at 1,601.75.
Minor wave 2 may not move beyond the start of minor wave 1 above 1,609.12.
The first second wave correction within a new trend for Gold is often very deep, so this wave count still fits common behaviour.
BULLISH ELLIOTT WAVE COUNT
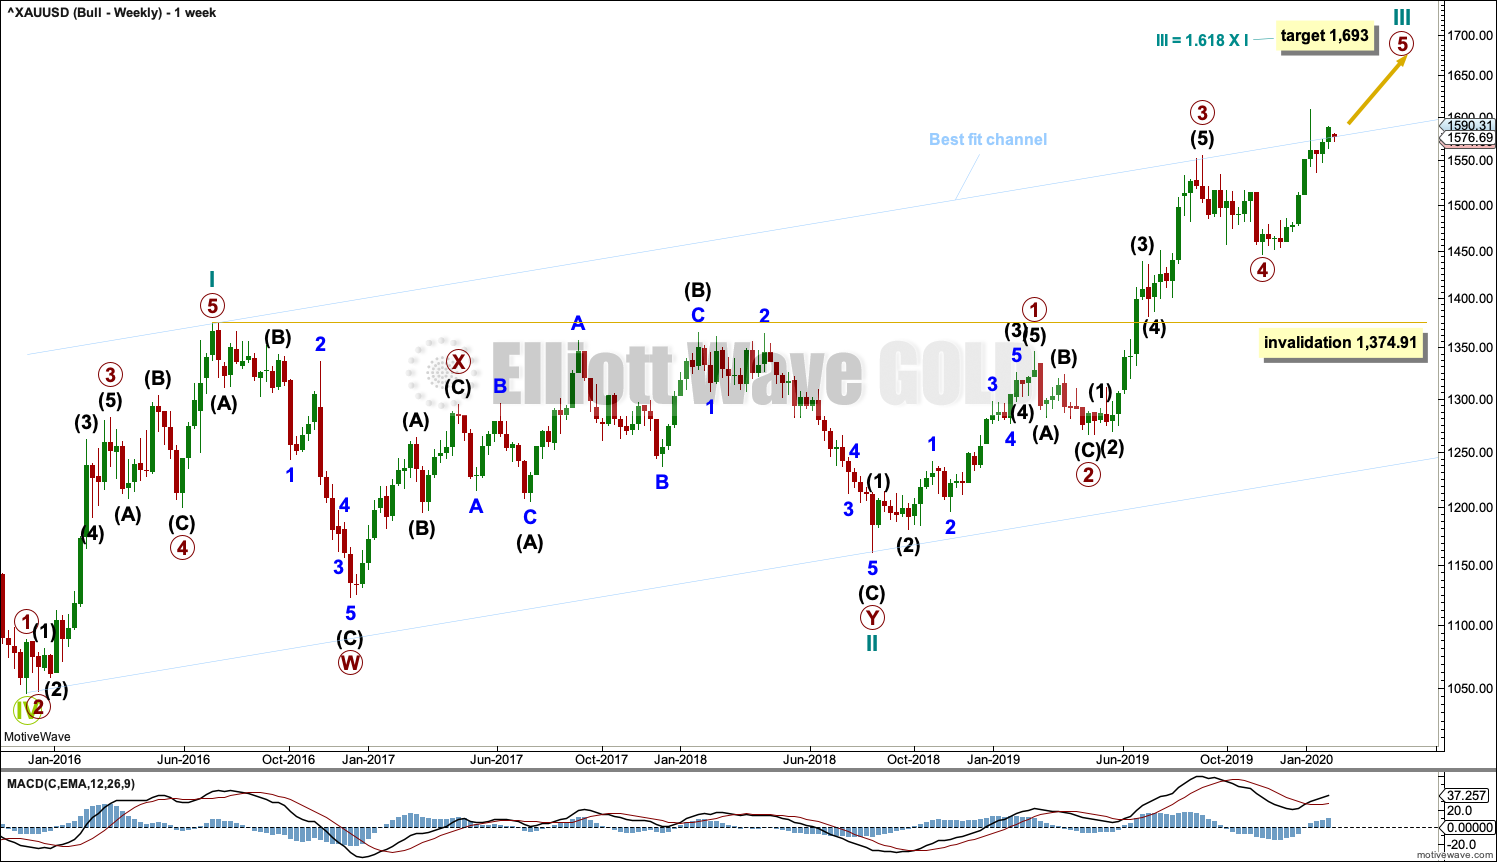
WEEKLY CHART
Click chart to enlarge.
This wave count sees the the bear market complete at the last major low for Gold on 3 December 2015.
If Gold is in a new bull market, then it should begin with a five wave structure upwards on the weekly chart. However, the biggest problem with this wave count is the structure labelled cycle wave I because this wave count must see it as a five wave structure, but it looks more like a three wave structure.
Commodities often exhibit swift strong fifth waves that force the fourth wave corrections coming just prior and just after to be more brief and shallow than their counterpart second waves. It is unusual for a commodity to exhibit a quick second wave and a more time consuming fourth wave, and this is how cycle wave I is labelled. This wave count still suffers from this very substantial problem, which is one reason why the bearish wave count is preferred because it has a better fit in terms of Elliott wave structure.
Cycle wave II subdivides well as a double combination: zigzag – X – expanded flat.
Cycle wave III may have begun. Within cycle wave III, primary waves 1 through to 4 may now be complete. Primary wave 5 may be complete at any stage now; this would complete the whole structure of cycle wave III. Cycle wave IV may not move into cycle wave I price territory below 1,374.91.
Add the wide best fit channel to weekly and daily charts.
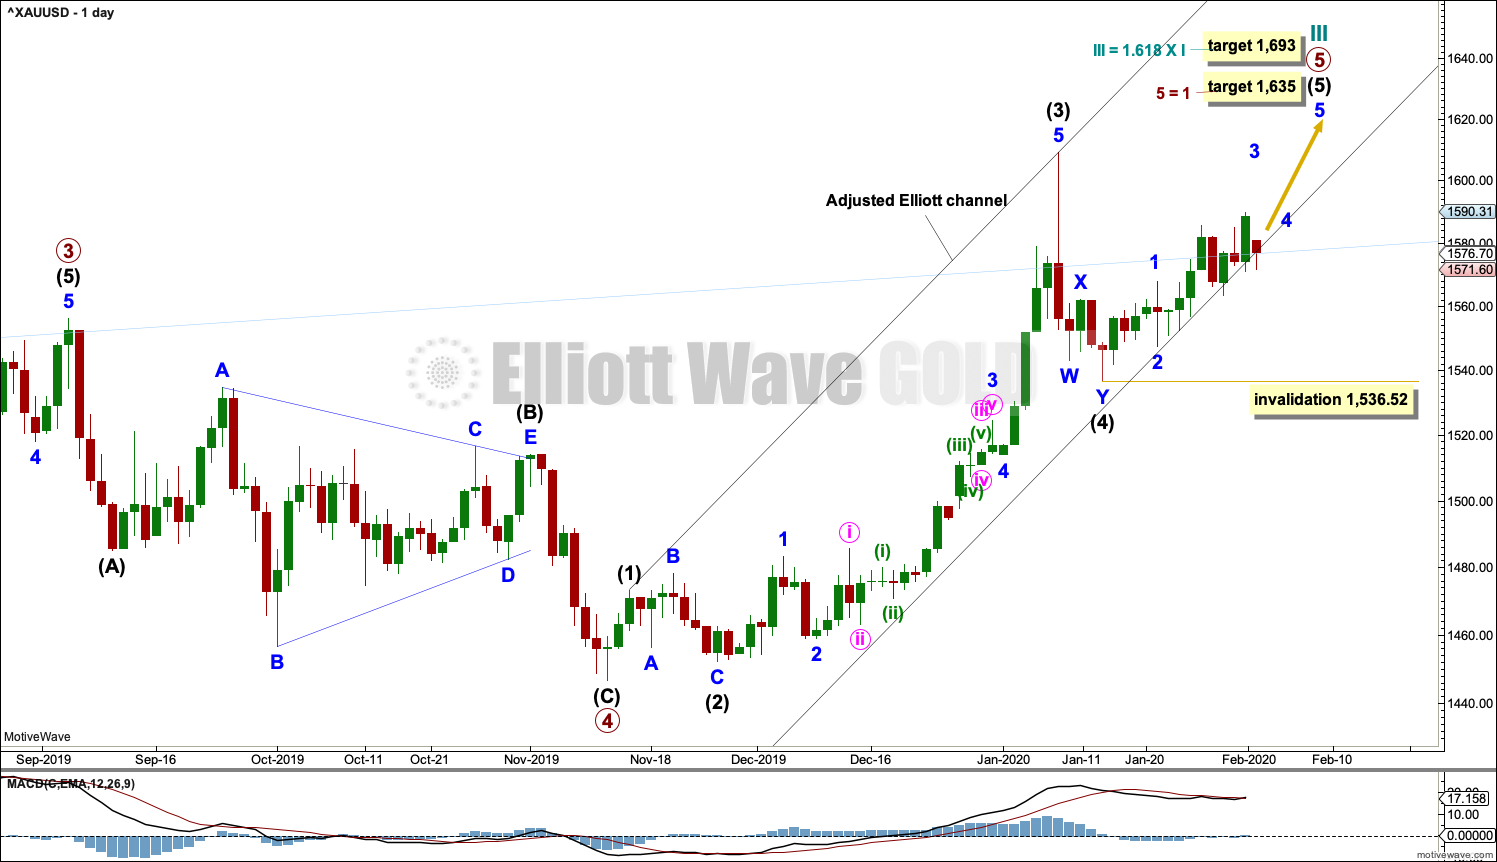
DAILY CHART
Click chart to enlarge.
A target for cycle wave III is calculated also now at primary degree. If price reaches the first target and keeps rising, then the second higher target may be used.
Primary wave 5 may only subdivide as a five wave structure, most likely an impulse. Within primary wave 5, intermediate waves (1) through to (4) may now be complete.
Draw an adjusted Elliott channel about primary wave 5. Intermediate wave (5) may find support at the lower edge as it moves higher.
This wave count for the next few weeks remains essentially the same as the main bearish wave count. Both wave counts see a fourth wave complete and a fifth wave now beginning and requiring more upwards movement.
HOURLY CHART
Click chart to enlarge.
Hourly charts are the same.
TECHNICAL ANALYSIS
WEEKLY CHART
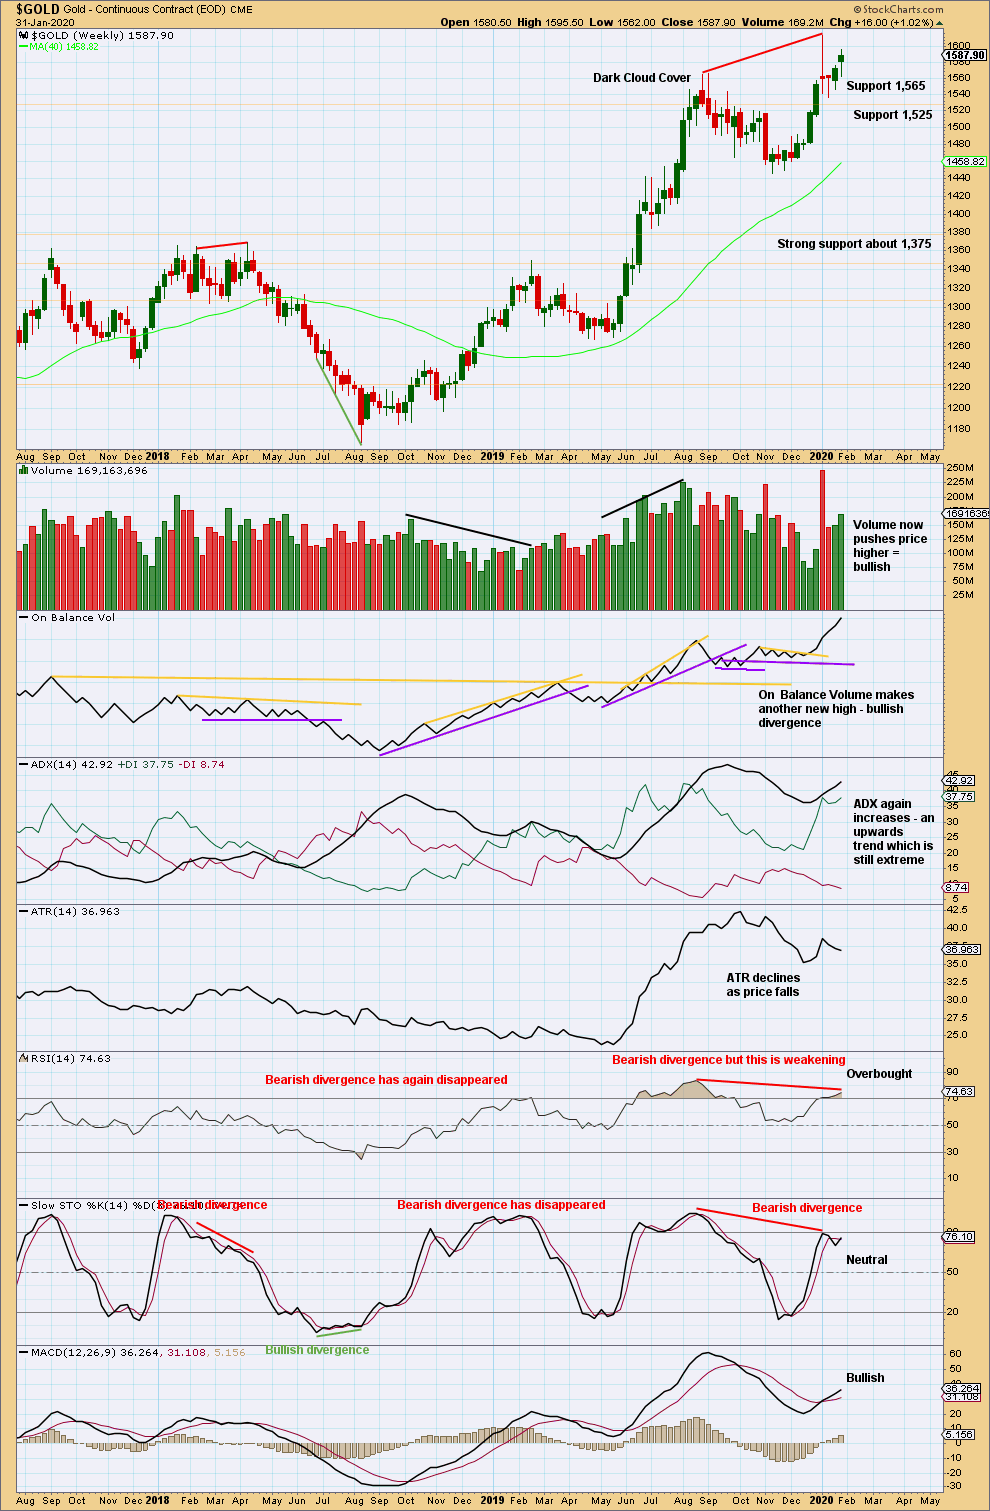
Click chart to enlarge. Chart courtesy of StockCharts.com.
Bullish divergence between price and On Balance Volume is contradicted by bearish divergence between price and RSI. More weight may be given to RSI as this tends to be slightly more reliable, particularly after it has reached extreme. This would support the alternate bearish wave count.
DAILY CHART
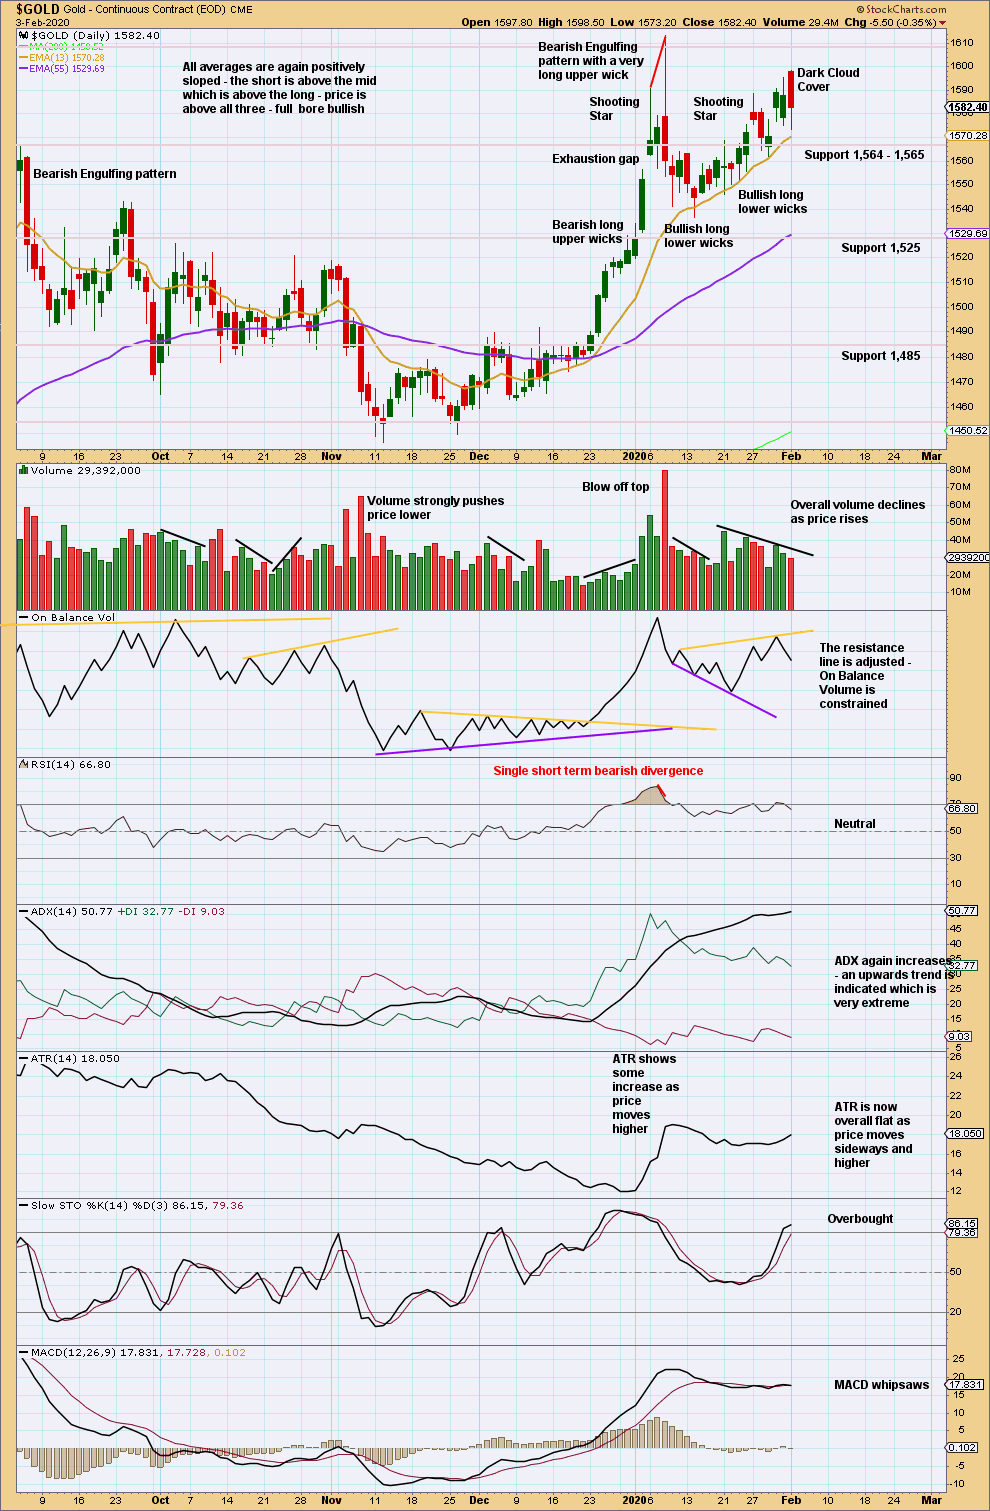
Click chart to enlarge. Chart courtesy of StockCharts.com.
The last Bearish Engulfing pattern has strong support from volume, which increases the bearish implications. Expect a trend change to either down or sideways.
Volume and On Balance Volume are bullish, but a very extreme ADX indicates upwards movement here may be limited.
Today a bearish candlestick reversal pattern in Dark Cloud Cover suggests this bounce may be over. But the long lower wick gives a bullish implication, and the reversal pattern is not supported by volume.
GDX WEEKLY CHART
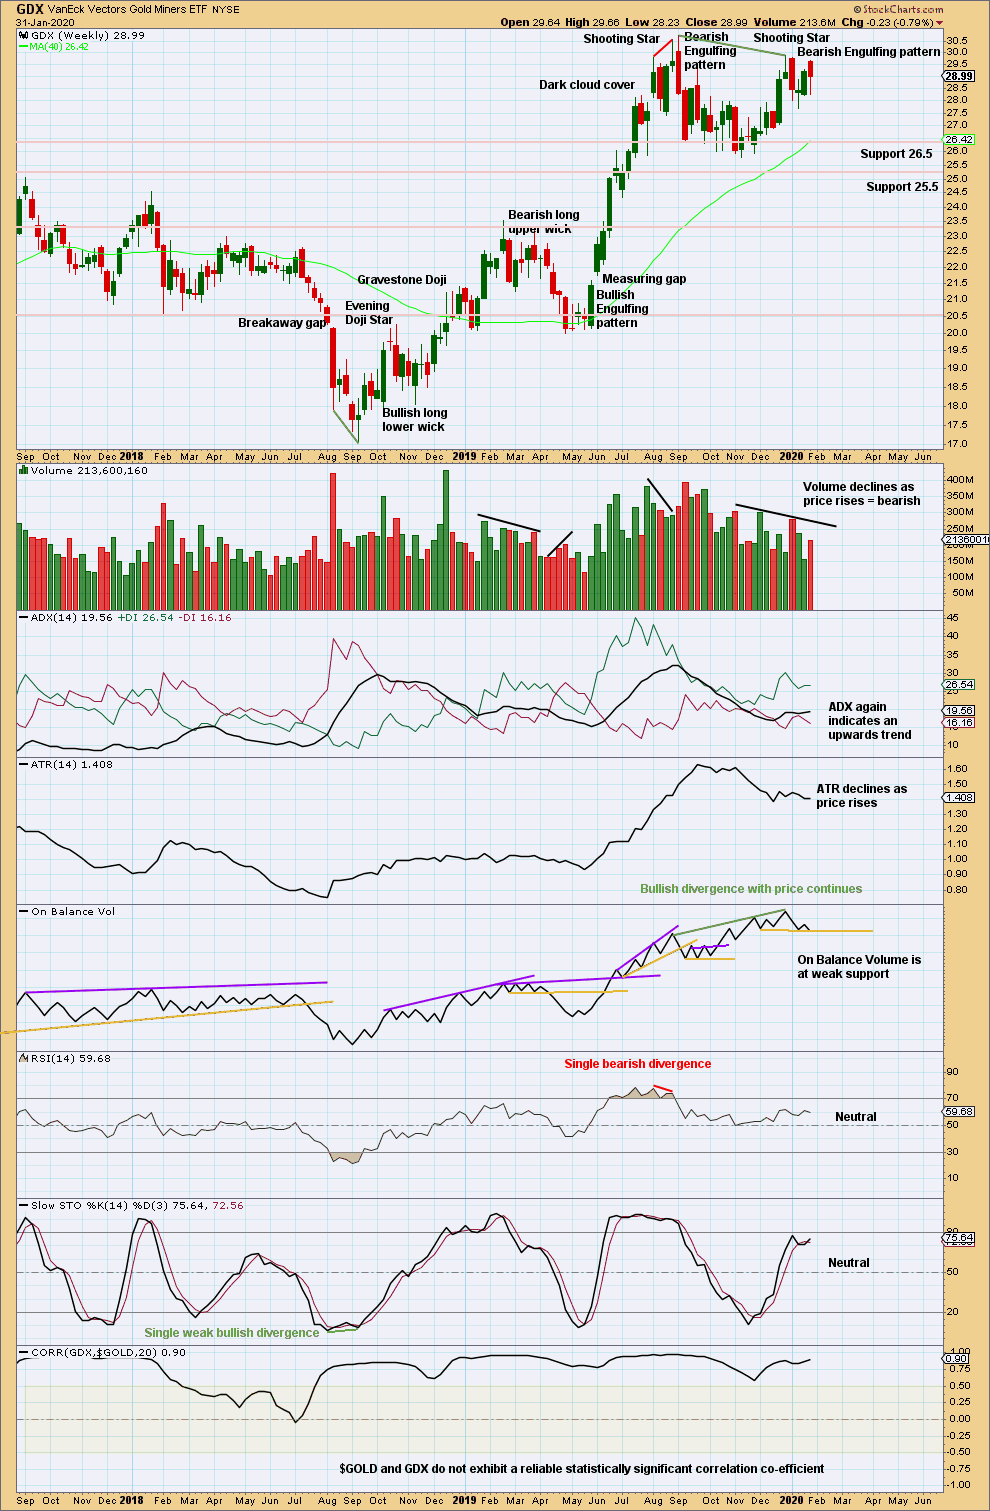
Click chart to enlarge. Chart courtesy of StockCharts.com.
Now two bearish candlestick patterns in a row, the second with support from volume, strongly suggest a trend change here to either down or sideways. The last Bearish Engulfing candlestick pattern has support from volume.
Volume and ATR are both declining as price rises from the last swing low in November 2029. This upwards movement so far has some weakness and looks likely to be a counter trend movement.
GDX DAILY CHART
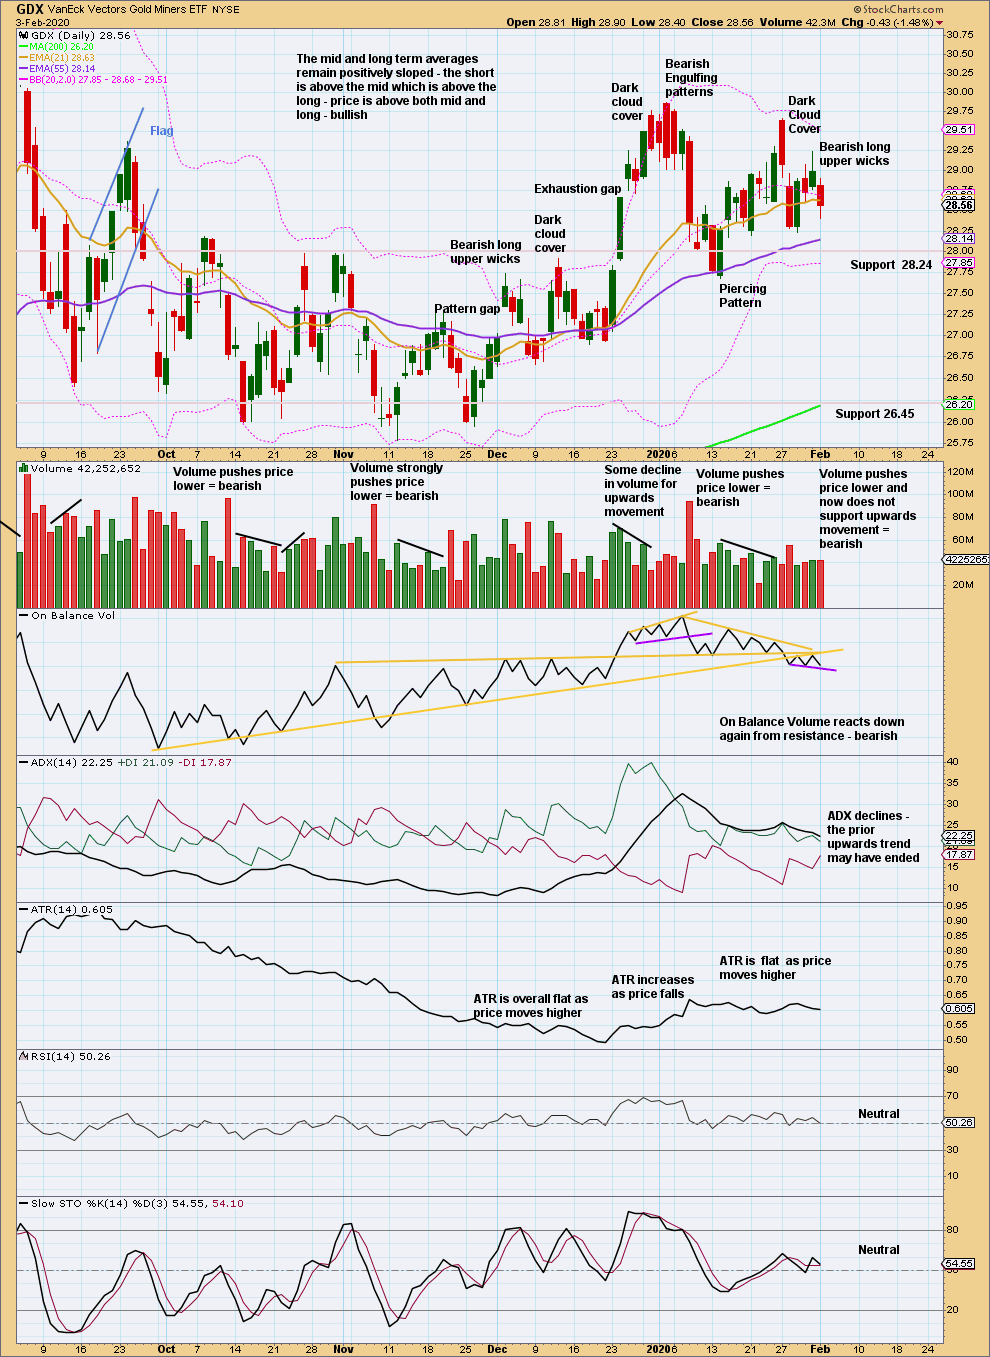
Click chart to enlarge. Chart courtesy of StockCharts.com.
A very strong bearish candlestick after an extreme upwards trend, along with closure of the last gap (now renamed an exhaustion gap) and now two bearish signals from On Balance Volume and volume supporting downwards movement and not upwards, strongly suggest GDX has found a high.
For the short term, GDX looks more clearly bearish than Gold.
Published @ 05:23 p.m. EST.
—
Careful risk management protects your trading account(s).
Follow my two Golden Rules:
1. Always trade with stops.
2. Risk only 1-5% of equity on any one trade.
—
New updates to this analysis are in bold.
Good morning.
The only wave count that really makes sense this morning is the alternate bear count.
The problem though with this count is the ending diagonal has minuette (iii) which is the longest of minuette (i), (iii) and (v).
I have long wondered if this EW rule should be re-written, and there is one other example for Gold where if the third wave within a diagonal is the longest (which, given the tendency of third waves makes sense) then the wave count would look so much better.
For now I’ll label minor 2 as an expanded flat, with minute c an ending expanding diagonal. I will look later today to see if there is a better way to label minor wave 2. If I can’t find a better way, then my years long suspicions will become firmer and I think the rule may need to be rewritten.
So that could be a leading diagonal for the main count?
Possibly. But I’m going to see if it can be labelled as an impulse first.
Interesting research paper on Gold price i post London Gold Pool in 1968.
In era of massive gold credit/derivatives affecting real gold price discovery: question is EW analysis really reliable?? EW was developed in a age of real price discovery for equities.
“Price gold bullion, not gold credit
Open letter to:
The Board of Directors, London Bullion Market Association
Dear Sir/Madam,” ..
https://www.hardmanandco.com/wp-content/uploads/2020/01/Gold-Hardman-Jan-2020.pdf
https://goldtadise.com/?p=455808
“Our detailed case study of the period October 2012-December 2015 (the False gold
bear market) shows that the 41% crash in the gold price (above chart) was in precisely the
opposite direction to identifiable fundamentals for gold bullion”
To me, and this is just my opinion, this looks like an emotional refusal to accept the fact of what price did. Also, maybe the fundamentals aren’t helpful in predicting price?
However, an interesting paper. I don’t think it means that EW can’t work on this market, as all you need for that is decent volume, and this market has that more than any other.
But it is very concerning for the future of the gold cash market, and very concerning for anyone wishing to buy and hold gold.
There are some trading accounts which do deliver the actual metal to you. I recall Verne mentioning one, but I don’t remember what it was.
This paper IMO outlines the importance for buyers to beware and hold the actual metal.