
GOLD: Elliott Wave and Technical Analysis | Charts – February 6, 2020
Both main and alternate Elliott wave counts expected a little more upwards movement for the last session, which is what has happened.
Summary: A new low below 1,536.52 would indicate a high was in place on the 8th of January and a downwards trend has begun. This is now the main wave count as price has strongly breached a channel containing prior upwards movement.
Grand SuperCycle analysis is here.
Monthly charts were last updated here.
BEARISH ELLIOTT WAVE COUNT
WEEKLY CHART
Click chart to enlarge.
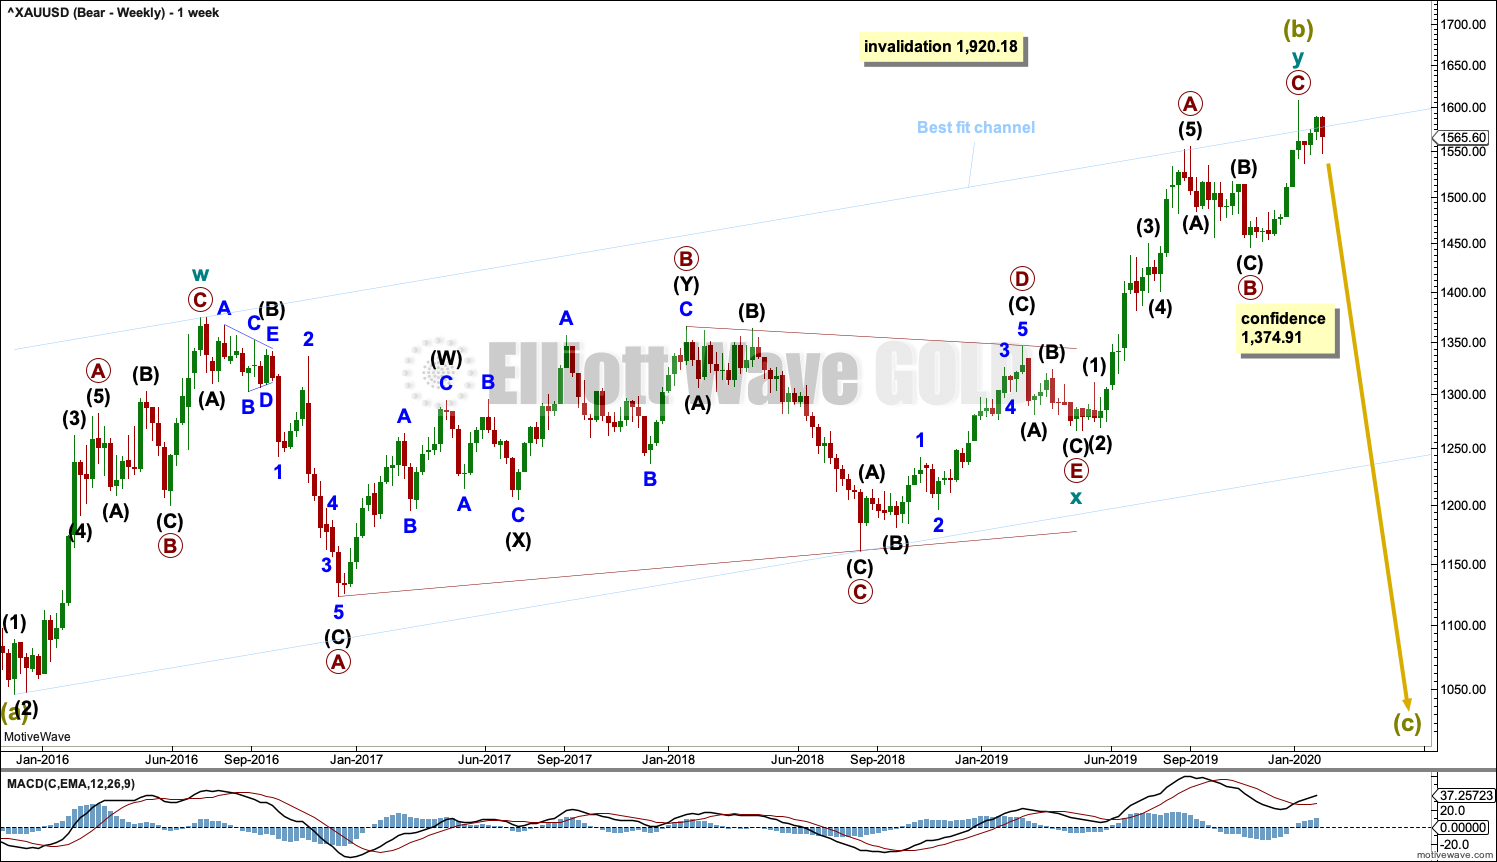
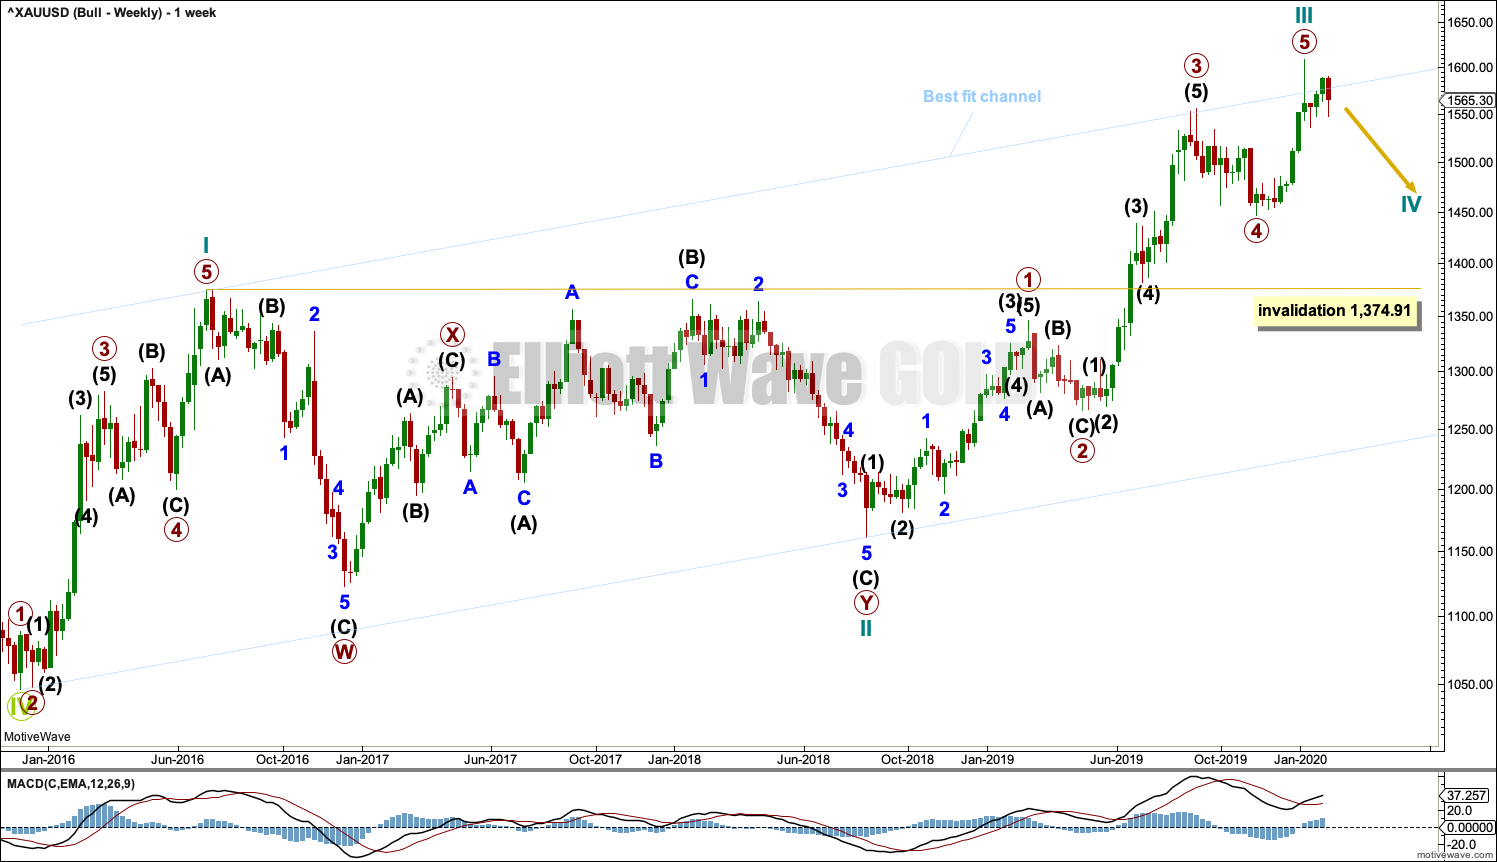
Super Cycle wave (b) may a complete double zigzag. But it is possible that it may be incomplete and may require one final high; this is outlined now in an alternate wave count below.
The first zigzag in the double is labelled cycle wave w. The double is joined by a three in the opposite direction, a triangle labelled cycle wave x. The second zigzag in the double is labelled cycle wave y.
The purpose of the second zigzag in a double is to deepen the correction. Cycle wave y has achieved this purpose.
A new low below 1,374.91 would add strong confidence to this wave count. At that stage, the bullish Elliott wave count would be invalidated. At that stage, targets for Super Cycle wave (c) would be calculated.
A wide best fit channel is added in light blue. Copy this channel over to daily charts. The upper edge of this channel has again been overshot and now price has returned back to within the channel.
DAILY CHART
Click chart to enlarge.
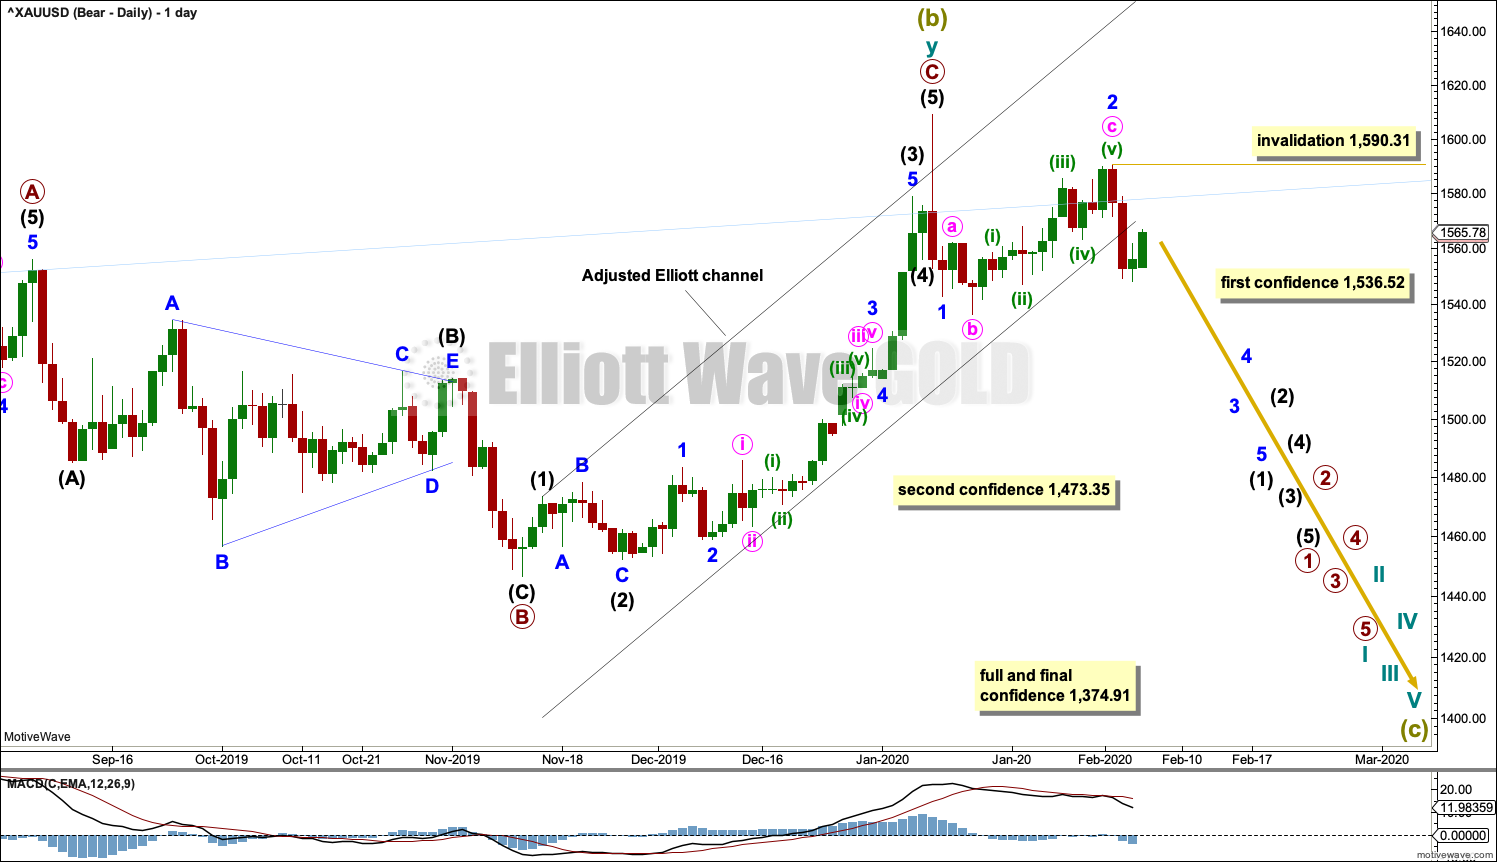
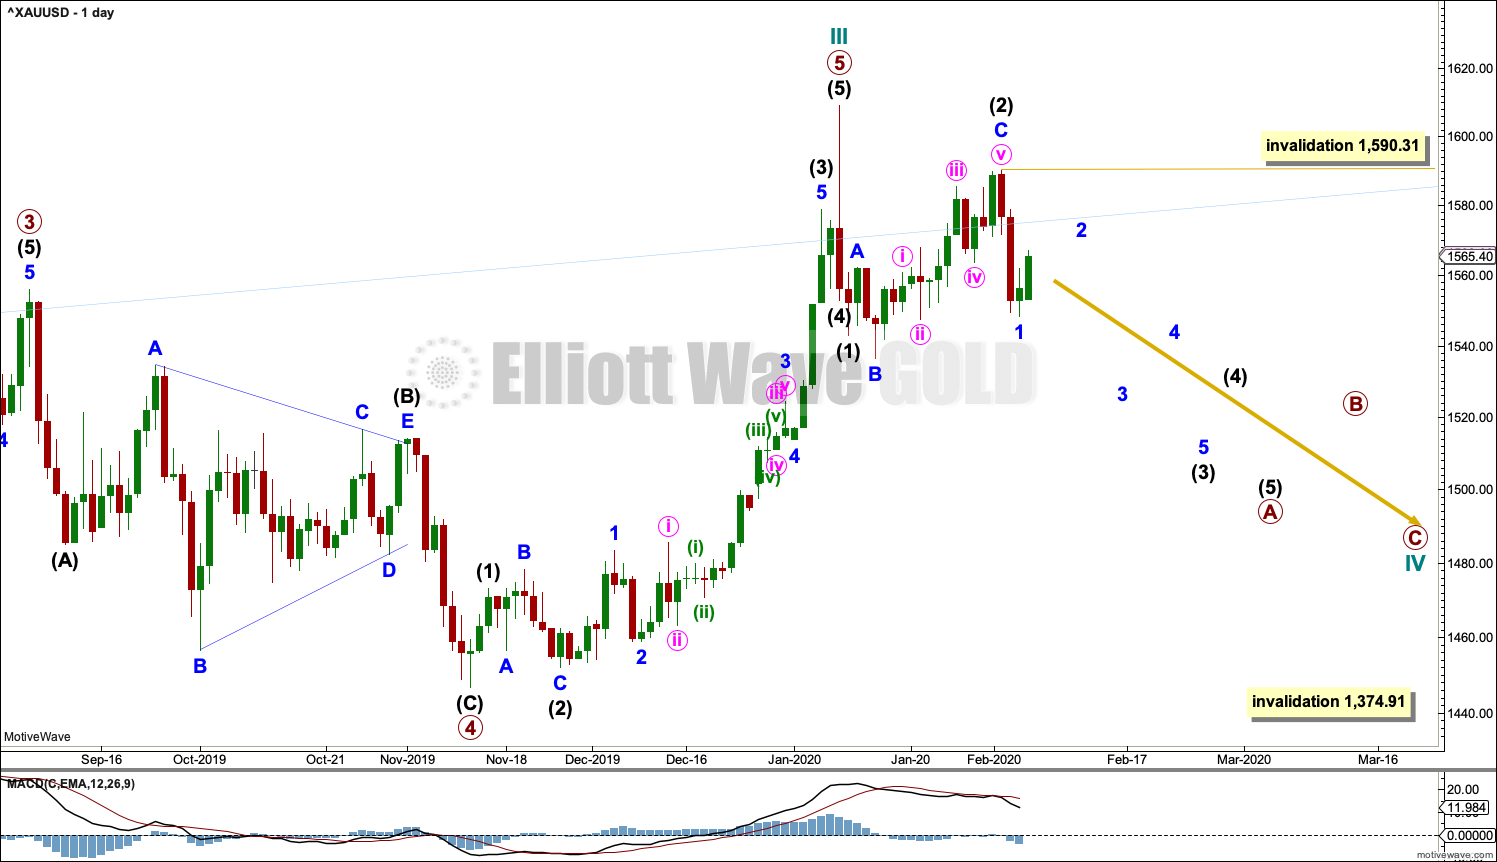
It is possible that Super Cycle wave (b) may be complete and the bear market for Gold may have resumed.
A new low below 1,536.52 would invalidate the alternate bearish wave count and add some confidence in this wave count. A new low below 1,473.35 would add further confidence. Thereafter, a new low by any amount at any time frame below 1,374.91 would invalidate the bullish wave count below and add full and final confidence in this wave count. Targets for Super Cycle wave (c) would be calculated at that stage.
If Super Cycle wave (c) has begun, then it should develop a five wave structure downwards at all time frames up to and including monthly.
Minor waves 1 and 2 may be complete. Within minor wave 3, no second wave correction may move beyond the start of its first wave above 1,590.31.
HOURLY CHART
Click chart to enlarge.
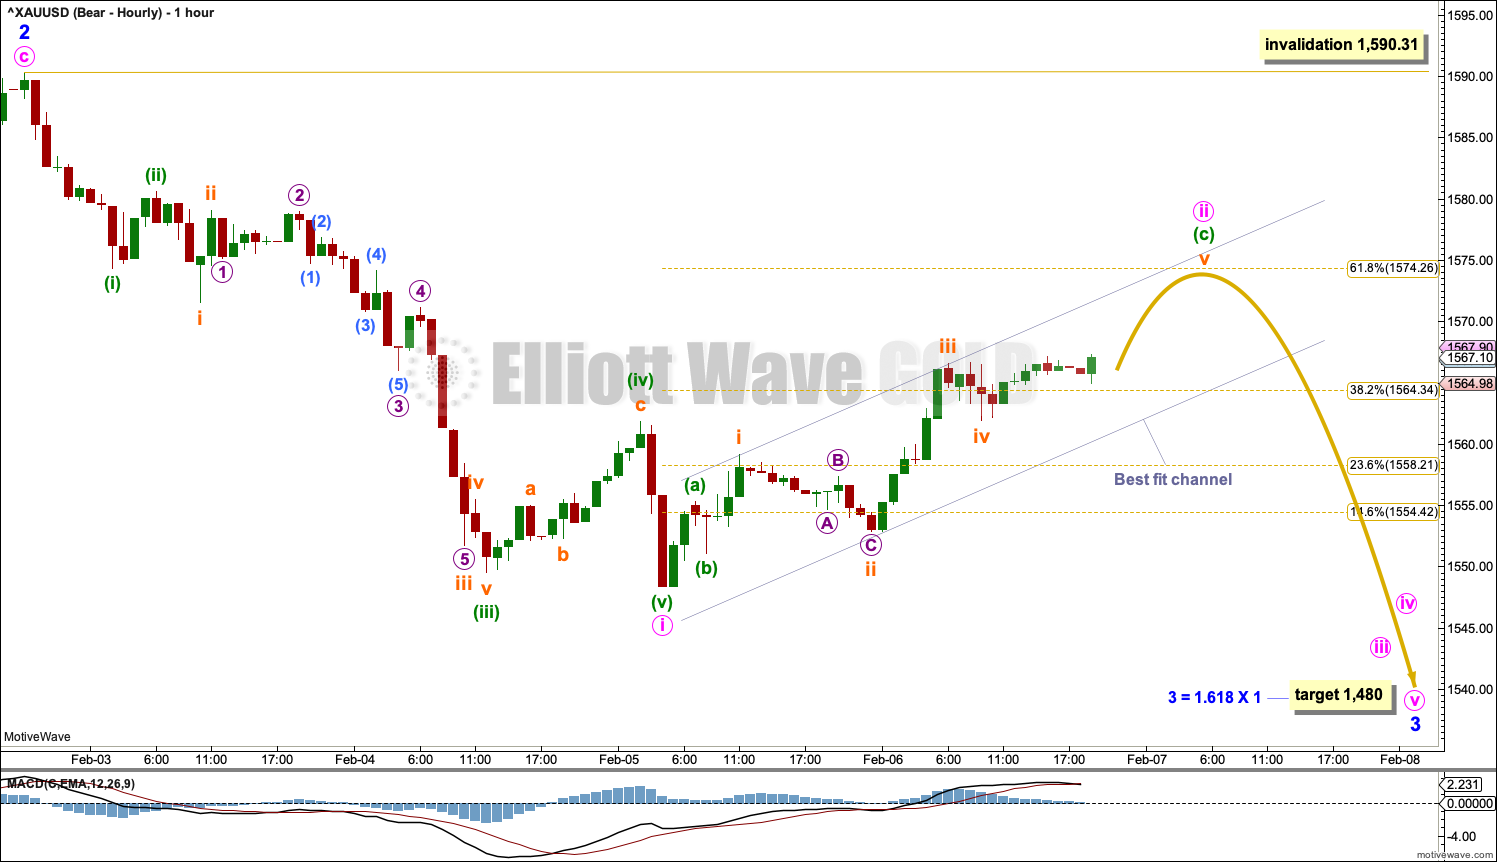
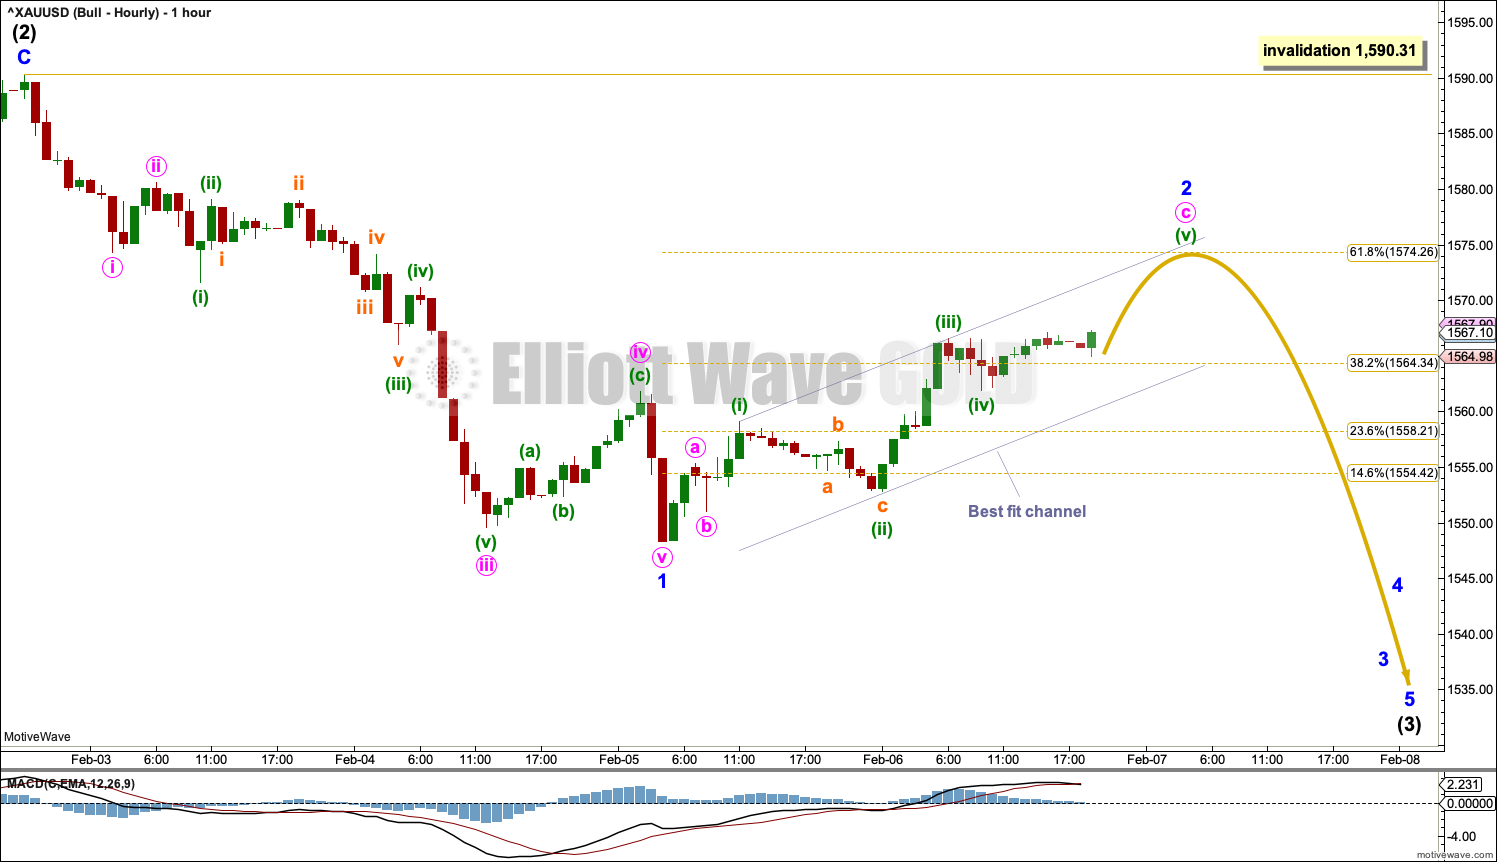
Today all hourly charts will show all movement from the high of the 2nd of February.
A target is calculated for minor wave 3 that expects a common Fibonacci ratio to minor wave 1.
Minor wave 3 may only subdivide as an impulse. Within minor wave 3, minute wave i may now be complete, and minute wave ii may now move higher to end about the 0.618 Fibonacci ratio.
A best fit channel is drawn about minute wave ii. When this channel is breached by downwards movement, that may indicate that minute wave ii is over and minute wave iii has begun. The next wave down is expected to be a third wave at two degrees, so it should exhibit an increase in momentum.
Minute wave ii may not move beyond the start of minute wave i above 1,590.31.
ALTERNATE DAILY CHART
Click chart to enlarge.
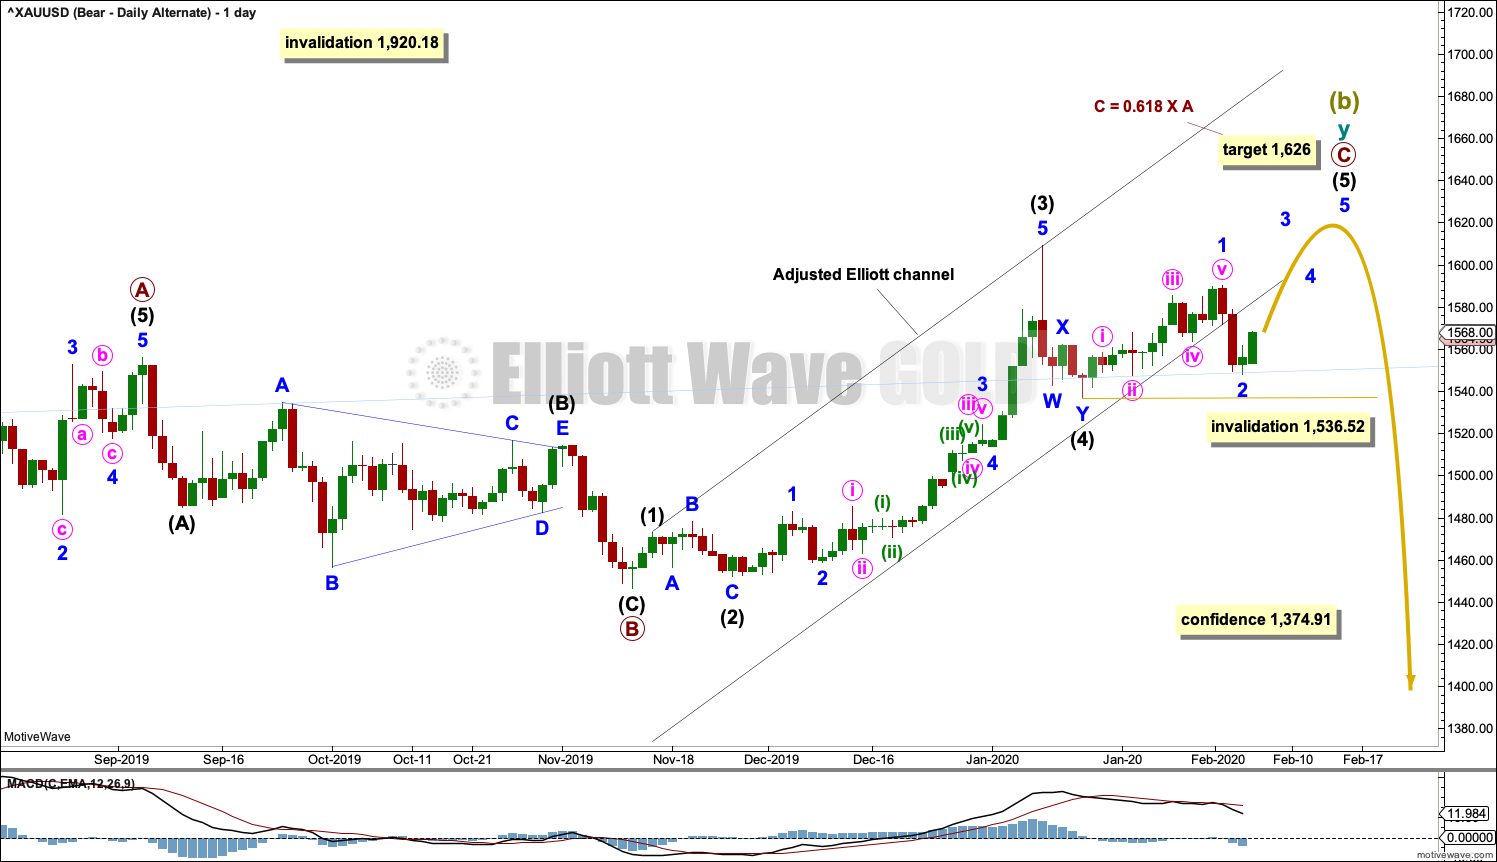
The double zigzag for Super Cycle wave (b) may be still incomplete.
Within cycle wave y, primary waves A and B are complete. Primary wave C must complete as a five wave structure. It is unfolding as an impulse. Within the impulse, intermediate waves (1) to (4) may now be complete.
Intermediate wave (2) was a deep 0.79 zigzag, which lasted 8 sessions. Intermediate wave (4) may have been a shallow 0.46 double zigzag lasting 4 sessions. Fourth waves are usually more brief than second waves for Gold.
Within intermediate wave (5), minor wave 2 may not move beyond the start of minor wave 1 below 1,536.52.
Drawn an Elliott channel about primary wave C and then pull the lower edge down to sit on recent lows. The lower edge may provide support to intermediate wave (5) as it continues higher. Copy this channel over to hourly charts.
BULLISH ELLIOTT WAVE COUNT
WEEKLY CHART
Click chart to enlarge.
This wave count sees the the bear market complete at the last major low for Gold on 3 December 2015.
If Gold is in a new bull market, then it should begin with a five wave structure upwards on the weekly chart. However, the biggest problem with this wave count is the structure labelled cycle wave I because this wave count must see it as a five wave structure, but it looks more like a three wave structure.
Commodities often exhibit swift strong fifth waves that force the fourth wave corrections coming just prior and just after to be more brief and shallow than their counterpart second waves. It is unusual for a commodity to exhibit a quick second wave and a more time consuming fourth wave, and this is how cycle wave I is labelled. This wave count still suffers from this very substantial problem, which is one reason why the bearish wave count is preferred because it has a better fit in terms of Elliott wave structure.
Cycle wave II subdivides well as a double combination: zigzag – X – expanded flat.
Cycle wave III may now be complete. Cycle wave IV may now move lower over several weeks to months.
Cycle wave II subdivides as a double combination, which lasted 110 weeks. Given the guideline of alternation, cycle wave IV may be expected to most likely subdivide as a zigzag. Cycle wave IV may be more brief than cycle wave II; Gold’s fourth waves tend to be more brief and zigzags tend to be more brief than combinations.
Cycle wave IV may not move into cycle wave I price territory below 1,374.91.
Add the wide best fit channel to weekly and daily charts.
DAILY CHART
Click chart to enlarge.
Cycle wave IV would most likely subdivide as a zigzag, which may last several weeks. Within a zigzag, primary wave A must subdivide as a five wave structure, most likely an impulse. Within the impulse, intermediate waves (1) and (2) may now most likely be complete. Within intermediate wave (3), minor wave 2 may not move beyond the start of minor wave 1 above 1,590.31.
HOURLY CHART
Click chart to enlarge.
A five down may be complete from the last high. This is labelled minor wave 1.
Minor wave 2 may now move higher to end about the 0.618 Fibonacci ratio.
TECHNICAL ANALYSIS
WEEKLY CHART
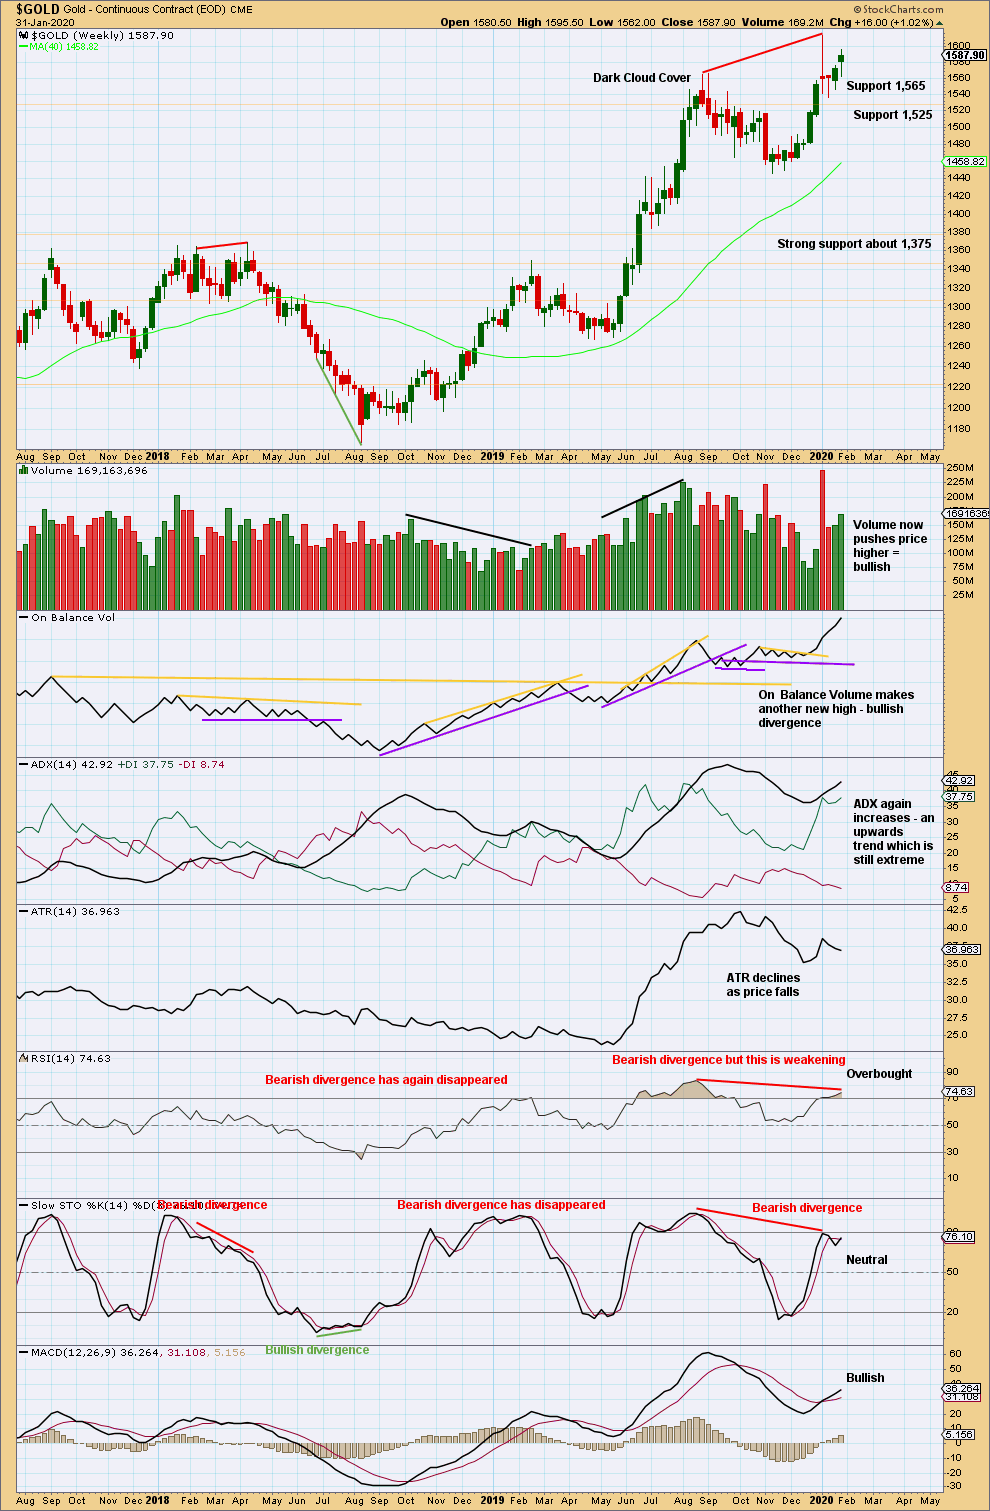
Click chart to enlarge. Chart courtesy of StockCharts.com.
Bullish divergence between price and On Balance Volume is contradicted by bearish divergence between price and RSI. More weight may be given to RSI as this tends to be slightly more reliable, particularly after it has reached extreme. This would support the alternate bearish wave count.
DAILY CHART
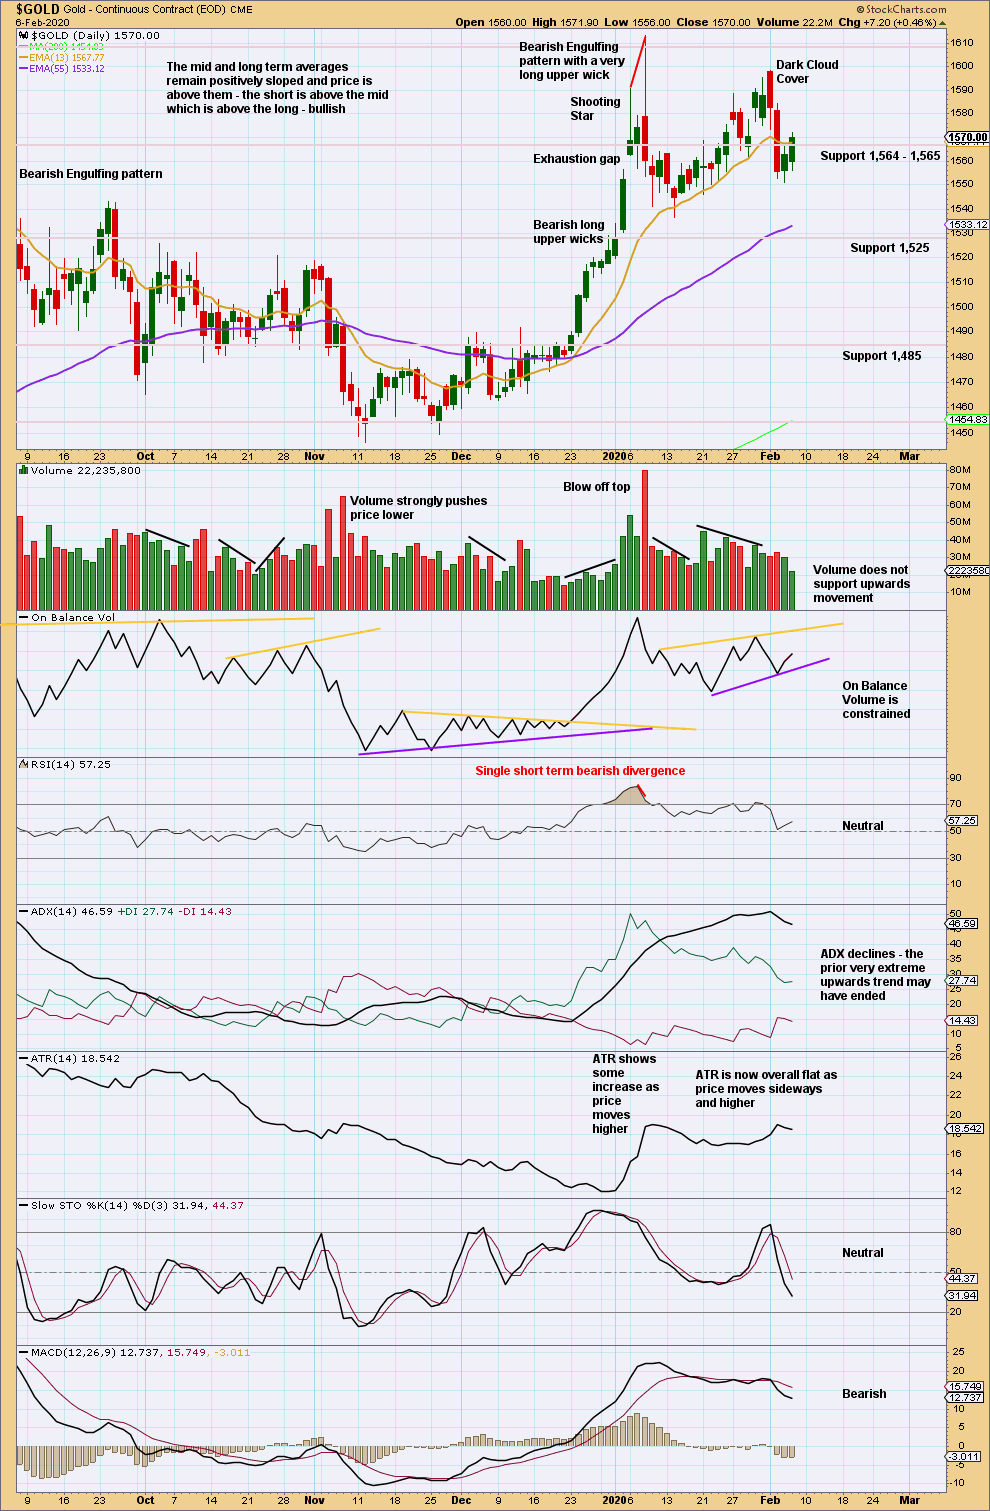
Click chart to enlarge. Chart courtesy of StockCharts.com.
The last Bearish Engulfing pattern has strong support from volume, which increases the bearish implications. Expect a trend change to either down or sideways.
Now a strong downwards day after Dark Cloud Cover reinforces the view that a sustainable high may be in place.
The last upwards session is weak; volume does not support upwards movement. This looks like a counter trend bounce.
GDX WEEKLY CHART
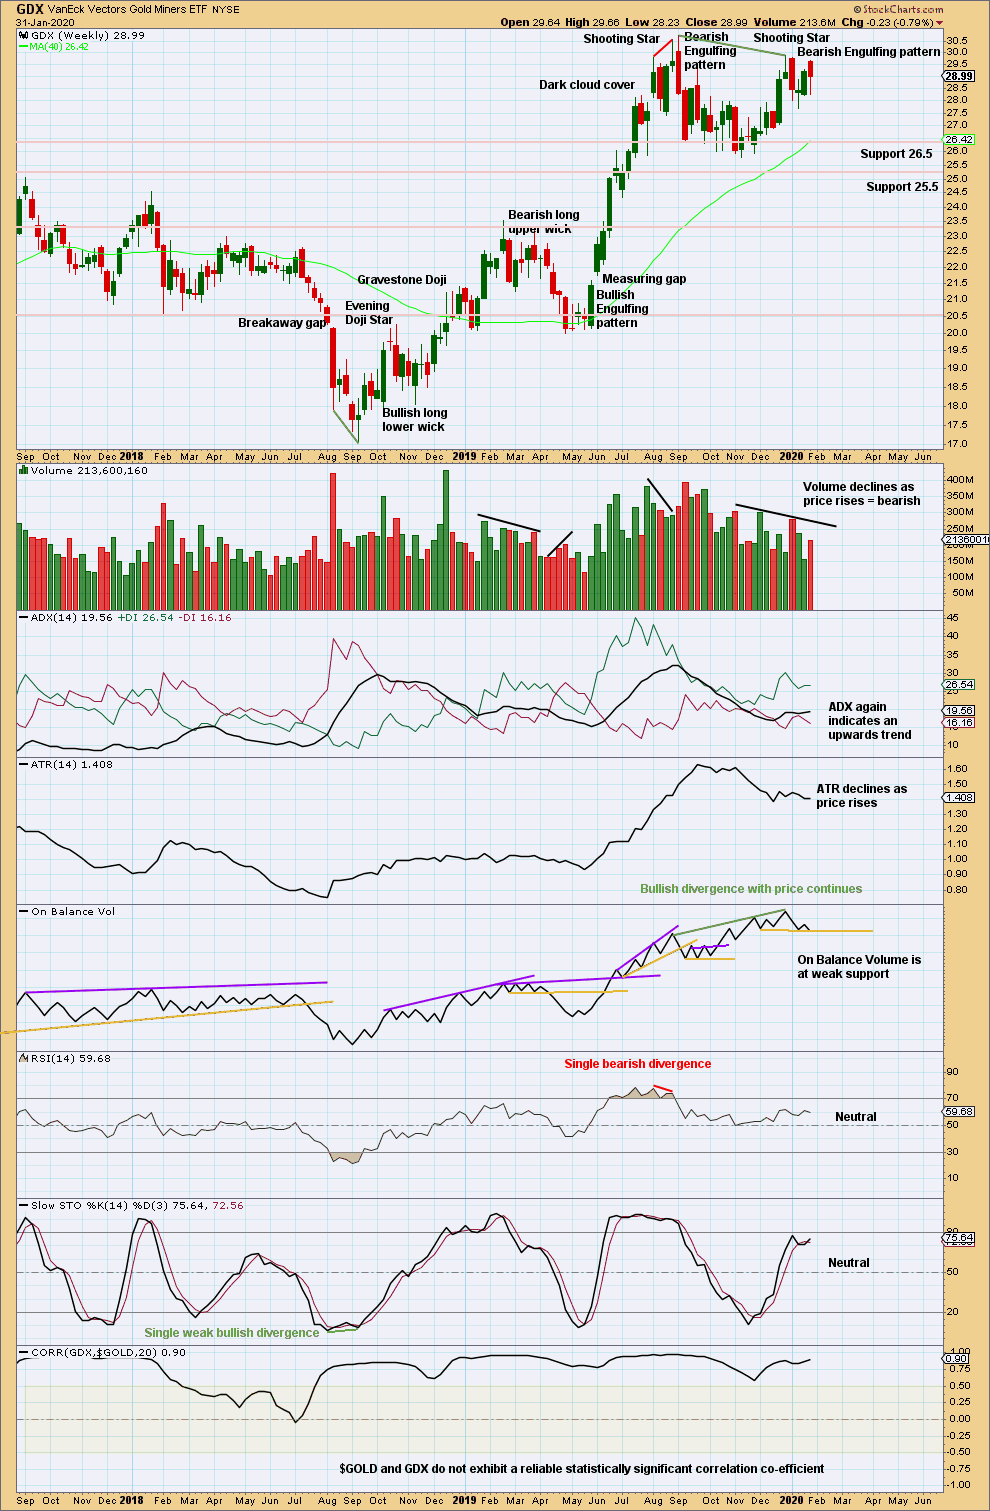
Click chart to enlarge. Chart courtesy of StockCharts.com.
Now two bearish candlestick patterns in a row, the second with support from volume, strongly suggest a trend change here to either down or sideways. The last Bearish Engulfing candlestick pattern has support from volume.
Volume and ATR are both declining as price rises from the last swing low in November 2029. This upwards movement so far has some weakness and looks likely to be a counter trend movement.
GDX DAILY CHART
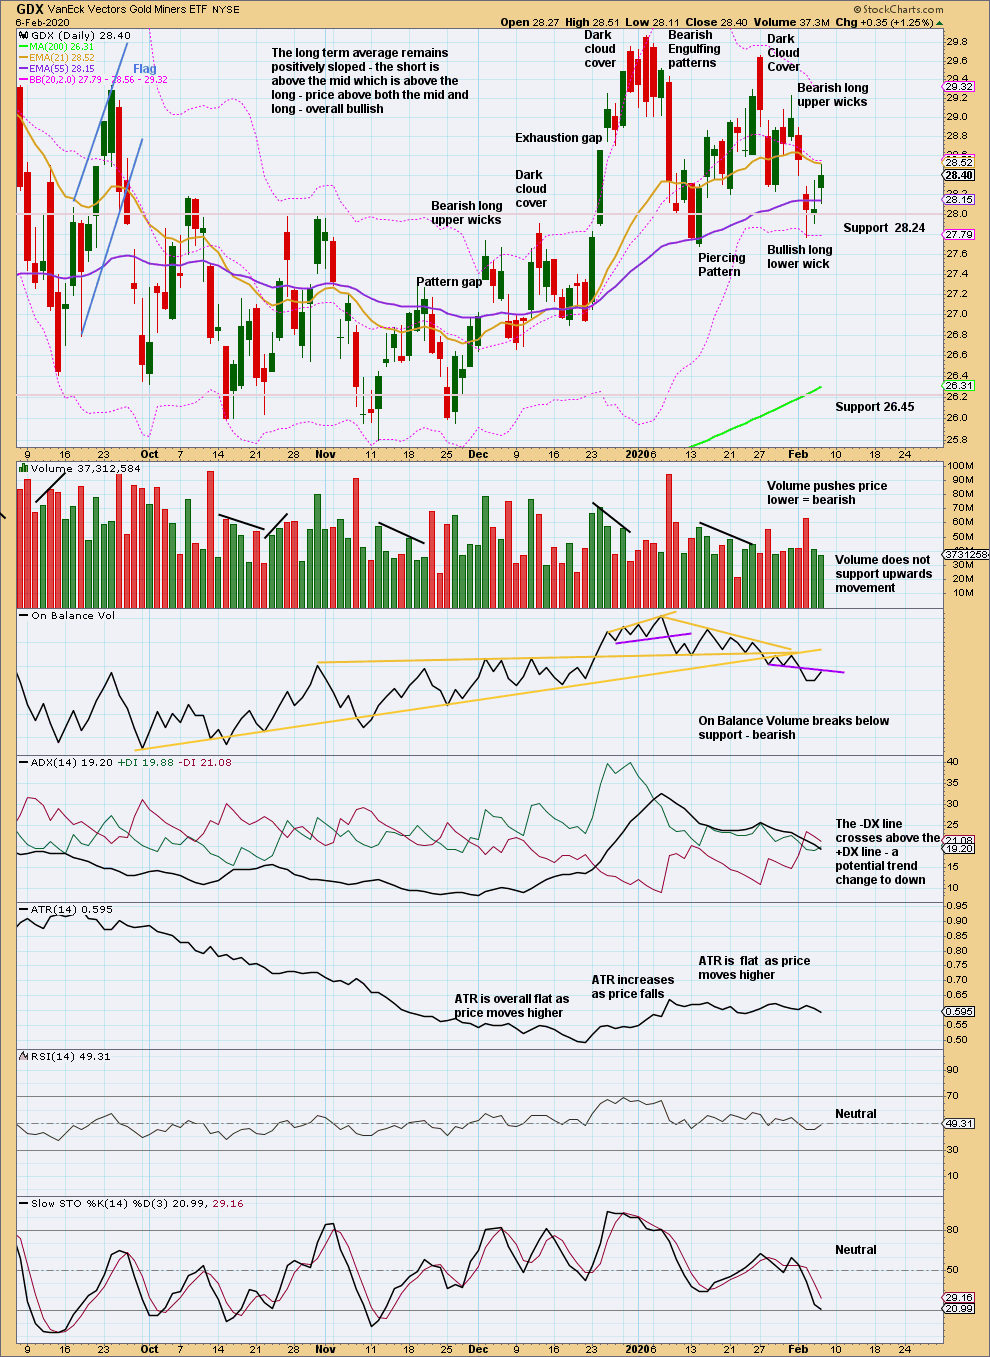
Click chart to enlarge. Chart courtesy of StockCharts.com.
A very strong bearish candlestick after an extreme upwards trend, along with closure of the last gap (now renamed an exhaustion gap) and now two bearish signals from On Balance Volume and volume supporting downwards movement and not upwards, strongly suggest GDX has found a high.
The last gap is now closed, so it may now be considered a pattern gap.
Price is range bound. The volume profile during this consolidation is bearish.
Published @ 10:00 p.m. EST.
—
Careful risk management protects your trading account(s).
Follow my two Golden Rules:
1. Always trade with stops.
2. Risk only 1-5% of equity on any one trade.
—
New updates to this analysis are in bold.
Hourly chart updated:
The zigzag of minute ii is relabelled. It may be complete, but for confidence I’d wait until the best fit channel is breached by downwards movement.
Hi Lara,
Do you have a mid afternoon hourly update? Thx