
GOLD: Elliott Wave and Technical Analysis | Charts – February 17, 2020
New York is closed for Washington’s Birthday. A very small range inside day leaves the analysis unchanged.
Summary: Downwards movement may resume with strength this week.
A new low below 1,536.52 would indicate a high was in place on the 8th of January and a downwards trend has begun. This is now the main wave count as price has strongly breached a channel containing prior upwards movement.
A third wave down at two degrees may begin in another one to very few days.
Grand SuperCycle analysis is here.
Monthly charts were last updated here.
BEARISH ELLIOTT WAVE COUNT
WEEKLY CHART
Click chart to enlarge.
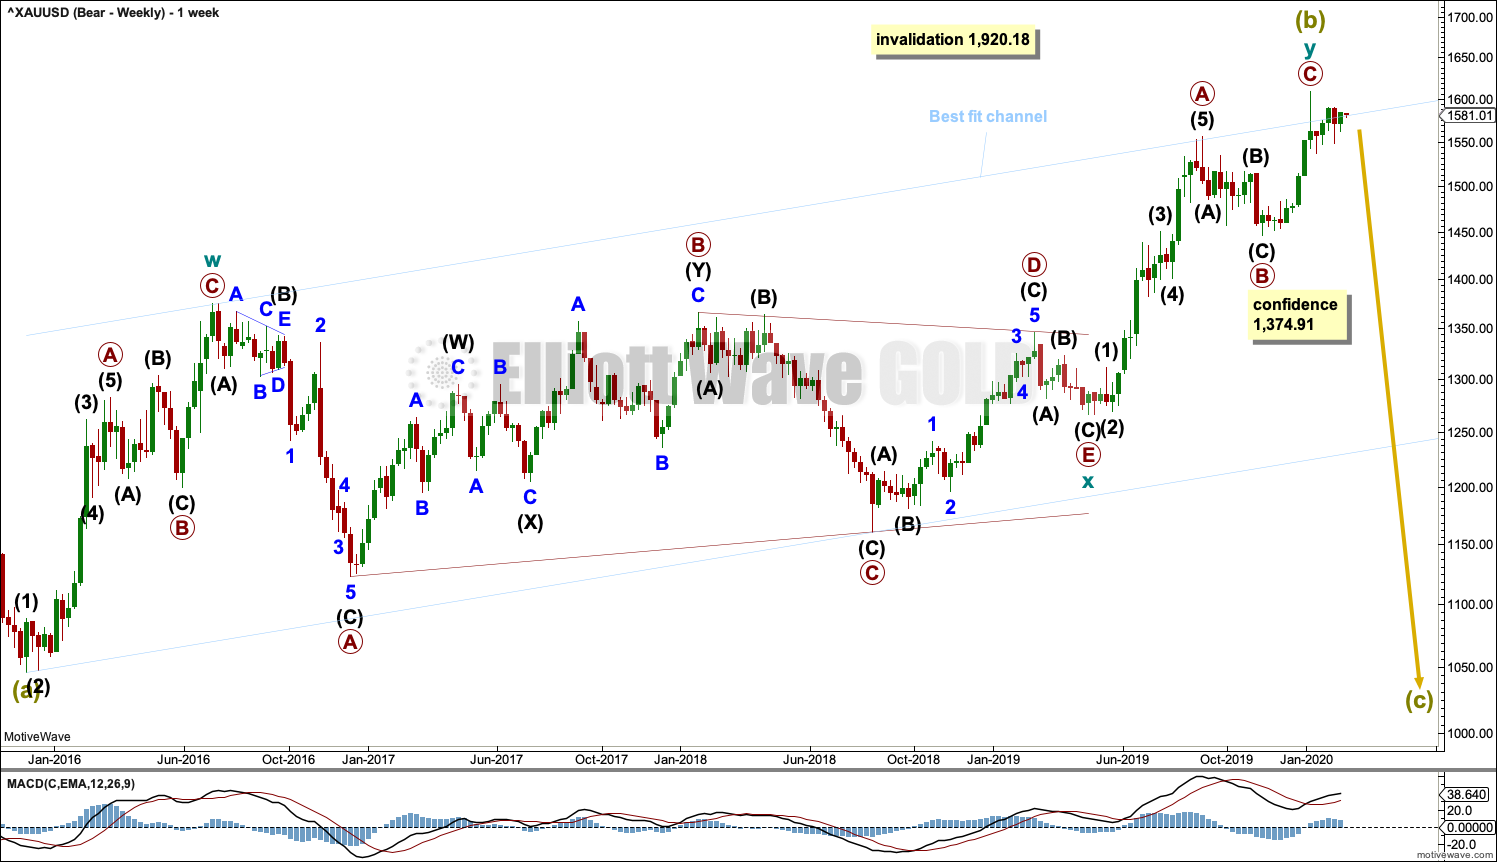
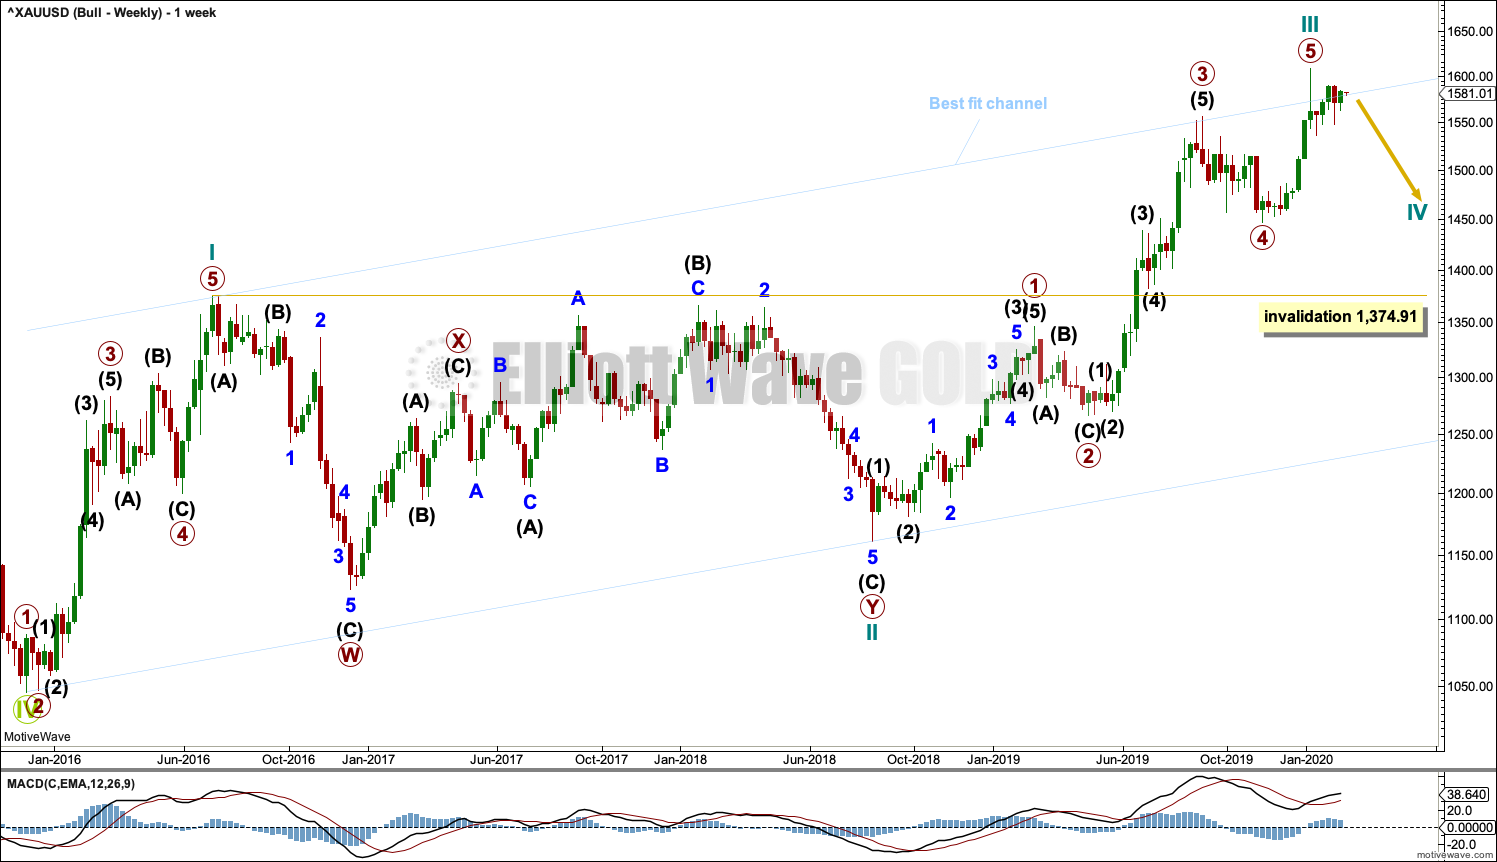
Super Cycle wave (b) may a complete double zigzag. But it is possible that it may be incomplete and may require one final high; this is outlined now in an alternate wave count below.
The first zigzag in the double is labelled cycle wave w. The double is joined by a three in the opposite direction, a triangle labelled cycle wave x. The second zigzag in the double is labelled cycle wave y.
The purpose of the second zigzag in a double is to deepen the correction. Cycle wave y has achieved this purpose.
A new low below 1,374.91 would add strong confidence to this wave count. At that stage, the bullish Elliott wave count would be invalidated. At that stage, targets for Super Cycle wave (c) would be calculated.
A wide best fit channel is added in light blue. Copy this channel over to daily charts. Price is again very close to the upper edge of this channel, which may provide resistance.
DAILY CHART
Click chart to enlarge.
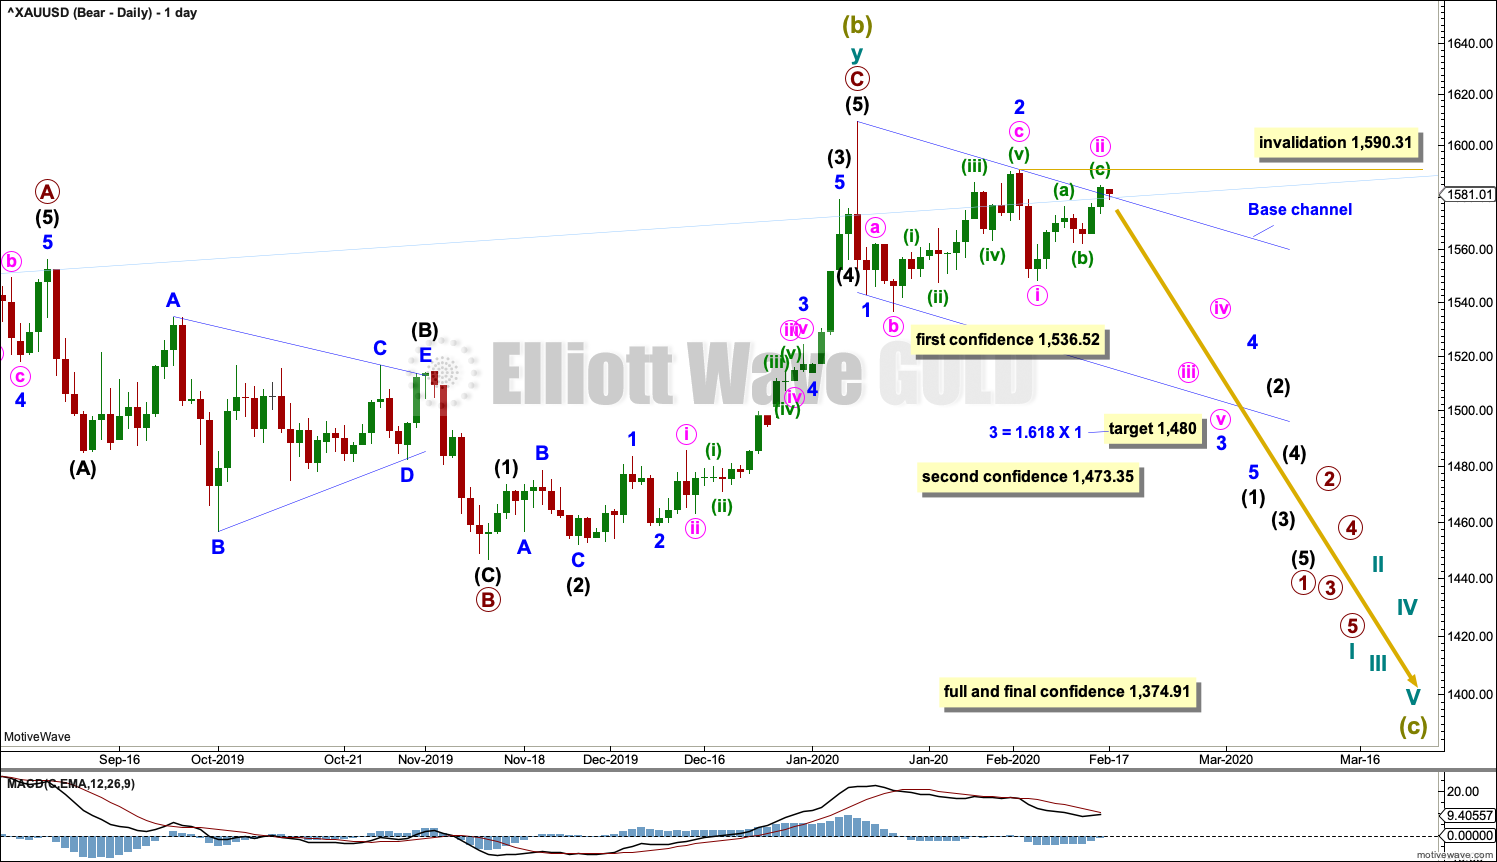
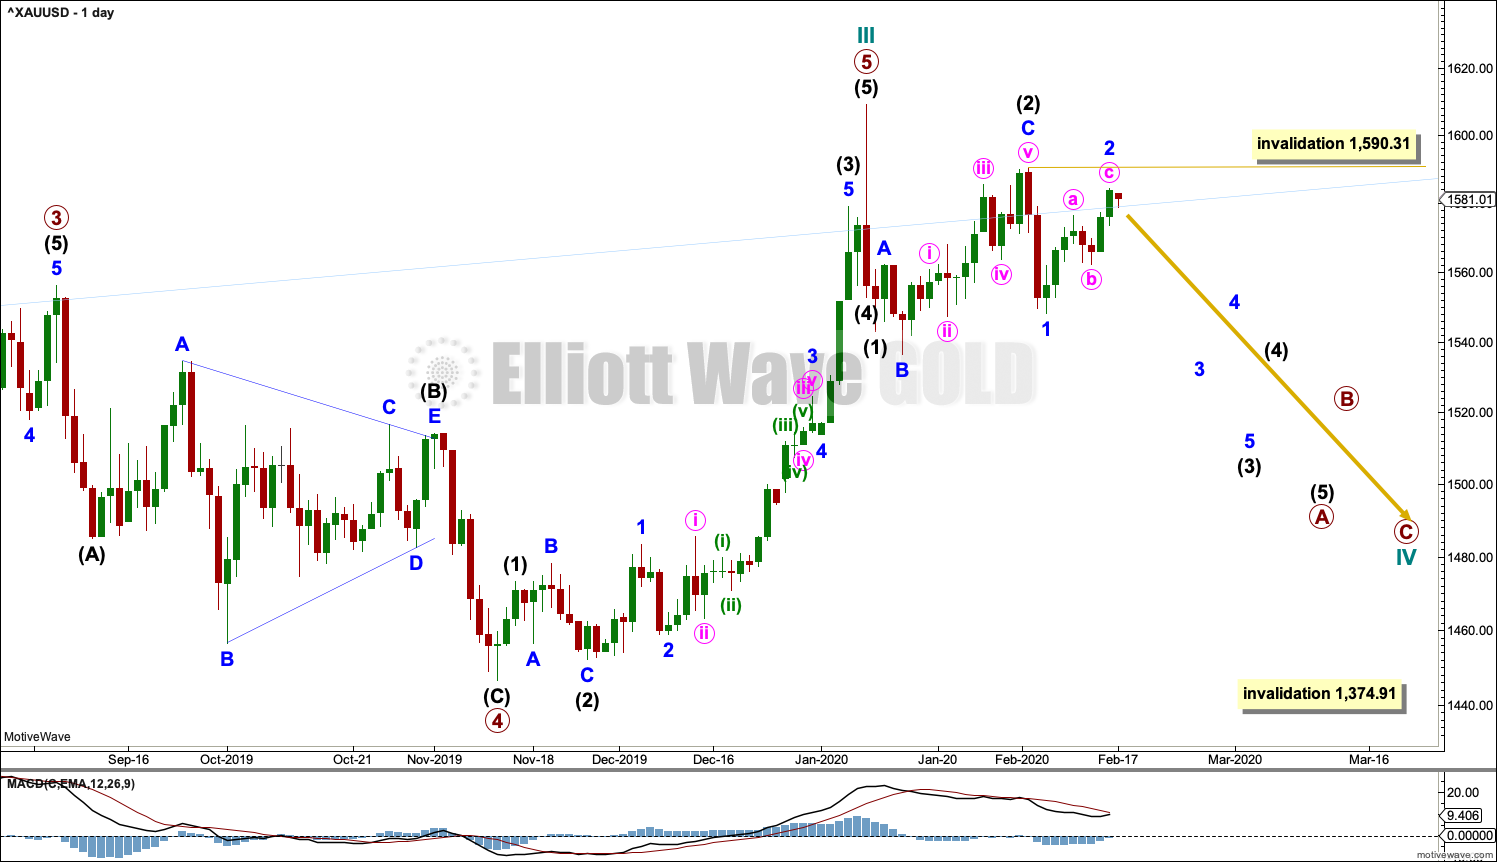
It is possible that Super Cycle wave (b) may be complete and the bear market for Gold may have resumed.
A new low below 1,536.52 would invalidate the alternate bearish wave count and add some confidence in this wave count. A new low below 1,473.35 would add further confidence. Thereafter, a new low by any amount at any time frame below 1,374.91 would invalidate the bullish wave count below and add full and final confidence in this wave count. Targets for Super Cycle wave (c) would be calculated at that stage.
If Super Cycle wave (c) has begun, then it should develop a five wave structure downwards at all time frames up to and including monthly.
Minor waves 1 and 2 may be complete. Within minor wave 3, minute wave ii may not move beyond the start of minute wave i above 1,590.31.
Minute wave ii may find resistance about the upper edge of the base channel and the best fit channel.
Draw a base channel about minor waves 1 and 2. Draw the first trend line from the start of minor wave 1 to the end of minor wave 2, then place a parallel copy on the end of minor wave 1. Early in new trends Gold often but not always fits within base channels. Because it has a tendency to begin new trends slowly with deep and time consuming second waves, a close above this base channel on Friday is not of great concern.
HOURLY CHART
Click chart to enlarge.
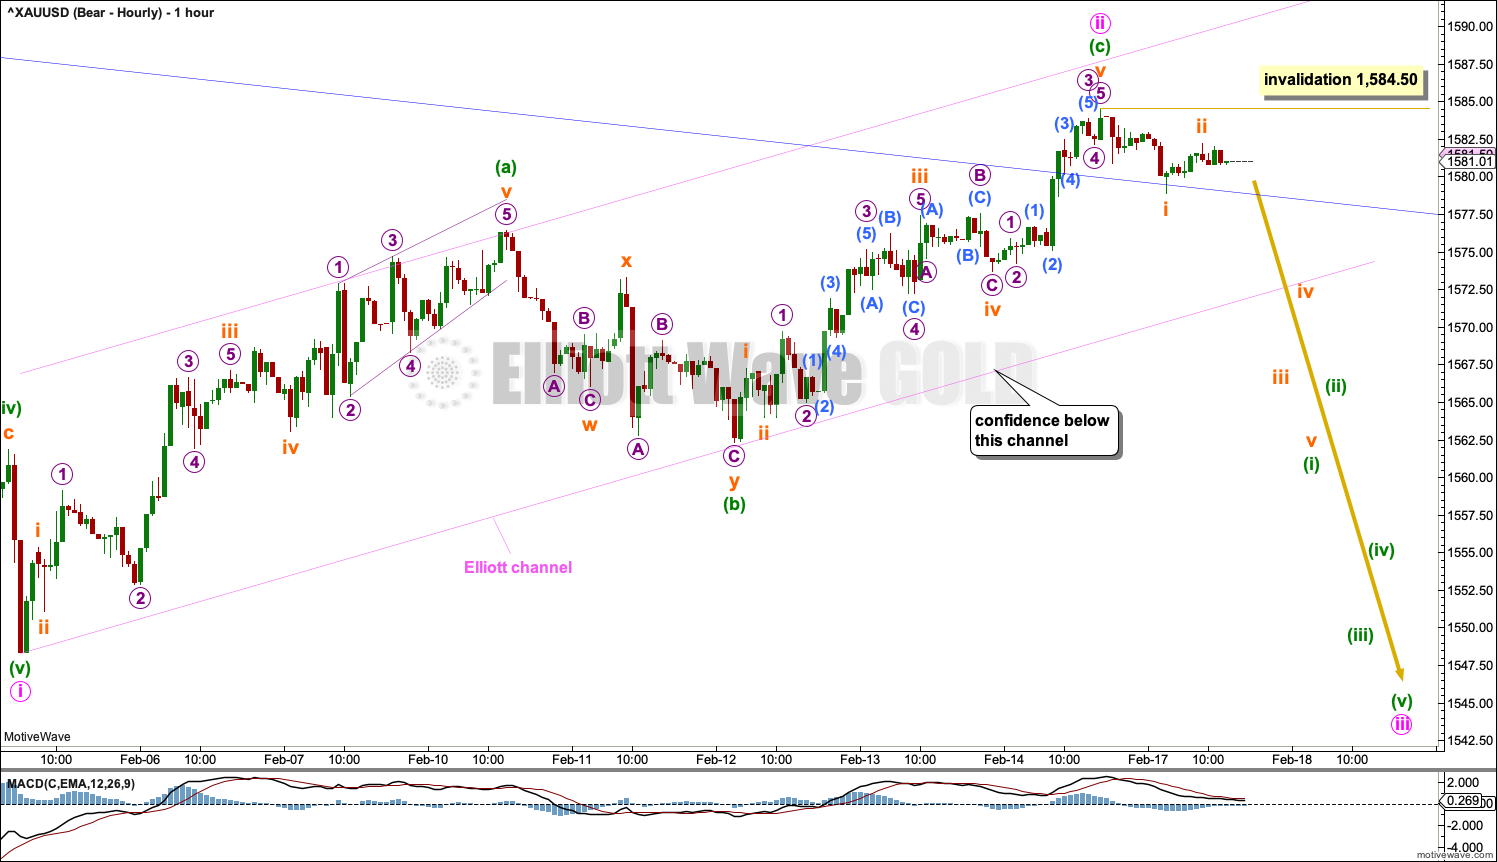
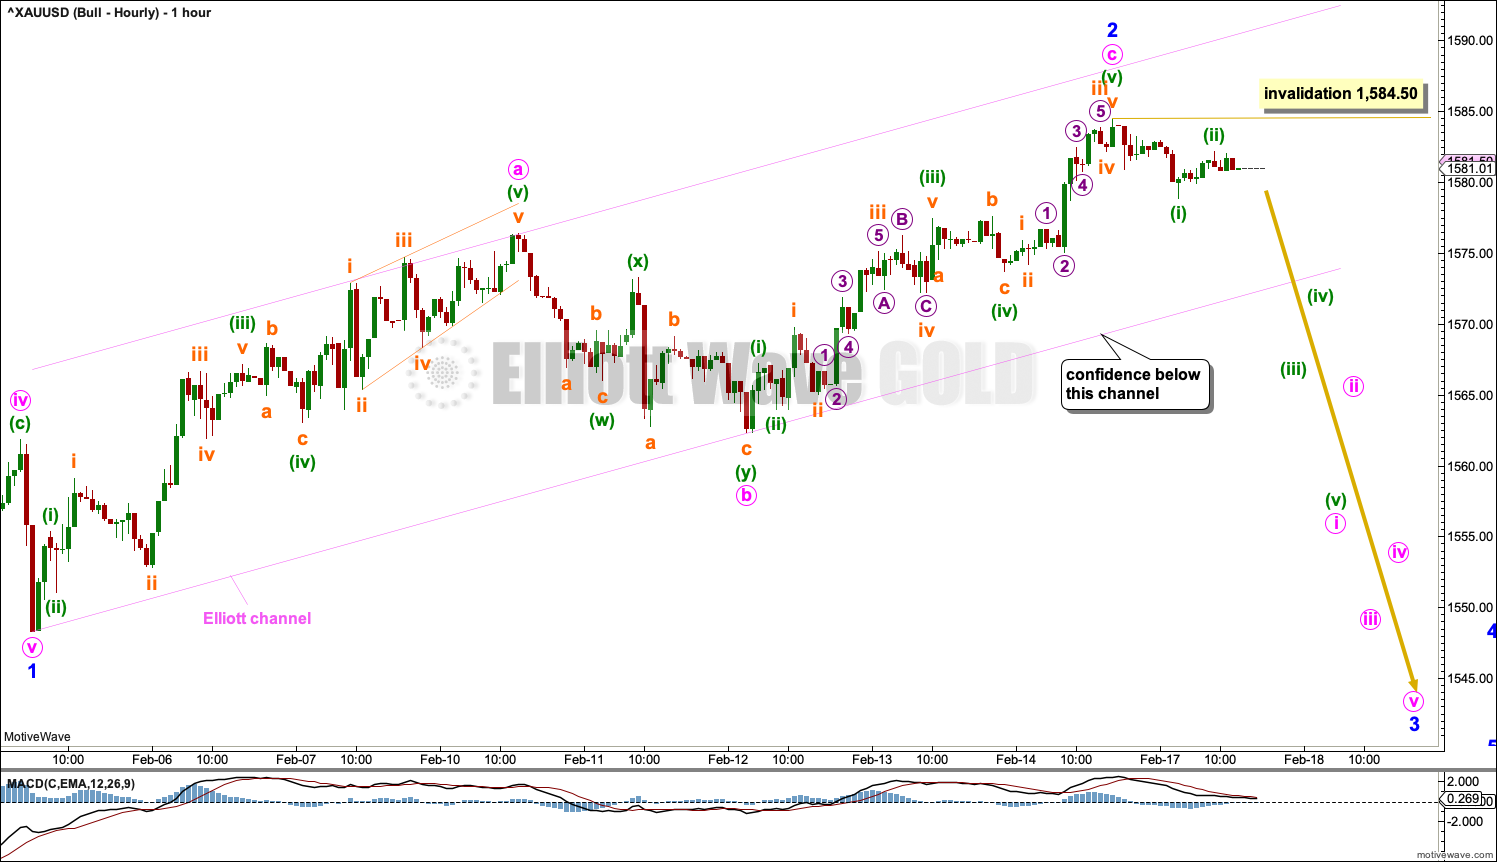
Today all hourly charts will show all movement from the low of the 5th of February.
Minor wave 3 may only subdivide as an impulse. Within minor wave 3, minute waves i and ii may be complete.
Within minute wave iii, subminuette wave ii may not move beyond the start of subminuette wave i above 1,584.50.
Draw the Elliott channel about minute wave ii. If this channel is breached by downwards movement, then that may indicate that minute wave ii is over and minute wave iii downwards may have begun. Use this channel for this purpose in the next 24 trading hours.
The next wave down may be a third wave at two degrees. It may exhibit an increase in momentum and have push from volume.
ALTERNATE DAILY CHART
Click chart to enlarge.
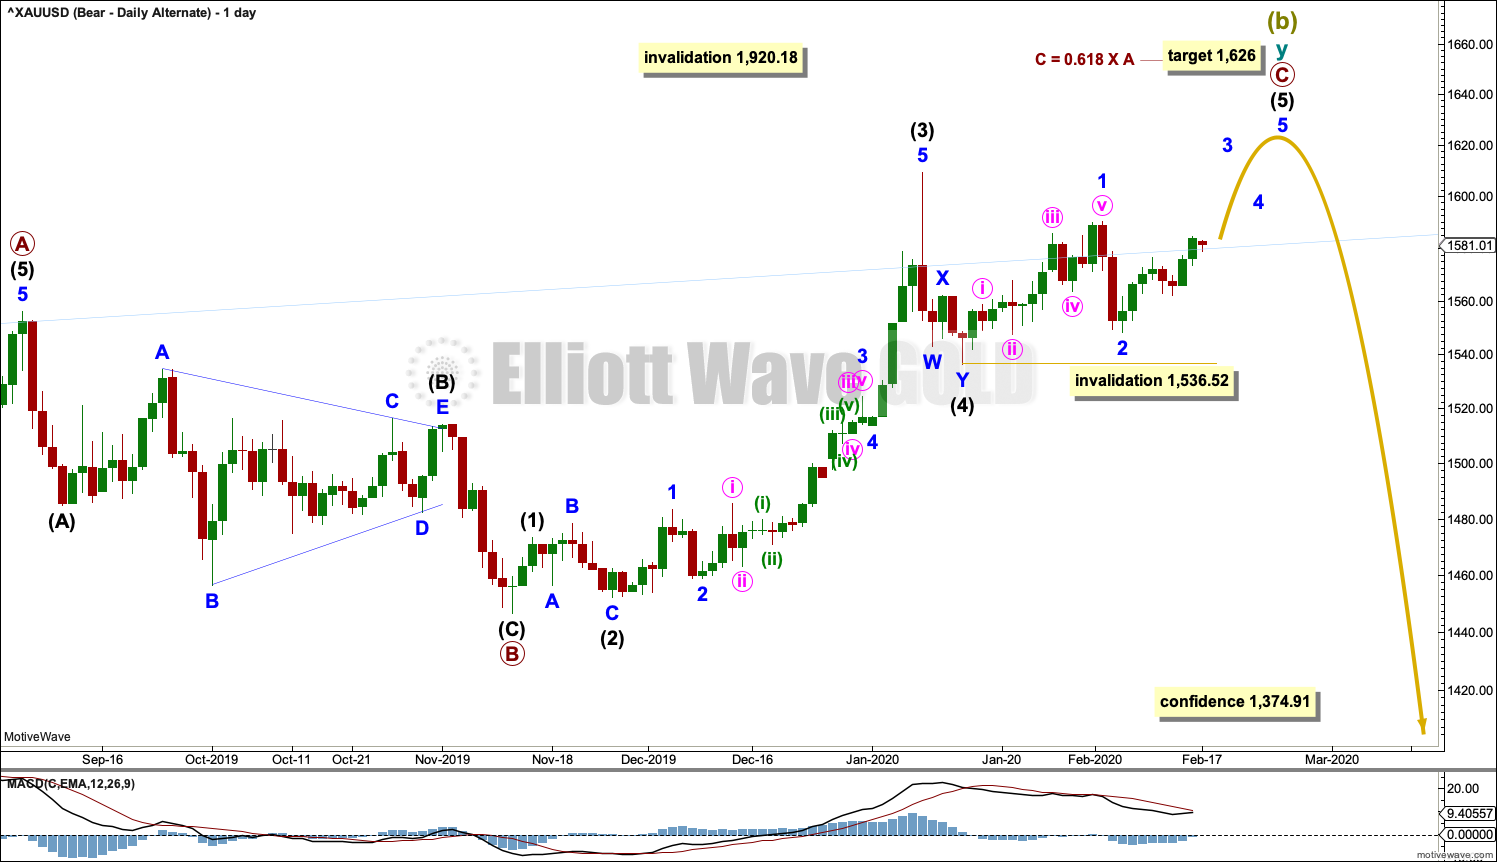
The double zigzag for Super Cycle wave (b) may be still incomplete.
Within cycle wave y, primary waves A and B are complete. Primary wave C must complete as a five wave structure. It is unfolding as an impulse. Within the impulse, intermediate waves (1) to (4) may now be complete.
Intermediate wave (2) was a deep 0.79 zigzag, which lasted 8 sessions. Intermediate wave (4) may have been a shallow 0.46 double zigzag lasting 4 sessions. Fourth waves are usually more brief than second waves for Gold.
Within intermediate wave (5), minor wave 2 may not move beyond the start of minor wave 1 below 1,536.52.
Sideways and downwards movement of the last few weeks is now too large to look like a normal part of primary wave C. This wave count now does not have the right look. Its probability is low.
BULLISH ELLIOTT WAVE COUNT
WEEKLY CHART
Click chart to enlarge.
This wave count sees the the bear market complete at the last major low for Gold on 3 December 2015.
If Gold is in a new bull market, then it should begin with a five wave structure upwards on the weekly chart. However, the biggest problem with this wave count is the structure labelled cycle wave I because this wave count must see it as a five wave structure, but it looks more like a three wave structure.
Commodities often exhibit swift strong fifth waves that force the fourth wave corrections coming just prior and just after to be more brief and shallow than their counterpart second waves. It is unusual for a commodity to exhibit a quick second wave and a more time consuming fourth wave, and this is how cycle wave I is labelled. This wave count still suffers from this very substantial problem, which is one reason why the bearish wave count is preferred because it has a better fit in terms of Elliott wave structure.
Cycle wave II subdivides well as a double combination: zigzag – X – expanded flat.
Cycle wave III may now be complete. Cycle wave IV may now move lower over several weeks to months.
Cycle wave II subdivides as a double combination, which lasted 110 weeks. Given the guideline of alternation, cycle wave IV may be expected to most likely subdivide as a zigzag. Cycle wave IV may be more brief than cycle wave II; Gold’s fourth waves tend to be more brief and zigzags tend to be more brief than combinations.
Cycle wave IV may not move into cycle wave I price territory below 1,374.91.
Add the wide best fit channel to weekly and daily charts.
DAILY CHART
Click chart to enlarge.
Cycle wave IV would most likely subdivide as a zigzag, which may last several months. Within a zigzag, primary wave A must subdivide as a five wave structure, most likely an impulse. Within the impulse, intermediate waves (1) and (2) may now most likely be complete. Within intermediate wave (3), minor wave 2 may not move beyond the start of minor wave 1 above 1,590.31.
HOURLY CHART
Click chart to enlarge.
Hourly charts are essentially the same with the exception of targets and now the degree of labelling.
TECHNICAL ANALYSIS
StockCharts data is New York session only. With New York closed today for Washington’s Birthday, there is no new data to update this technical analysis.
WEEKLY CHART
Click chart to enlarge. Chart courtesy of StockCharts.com.
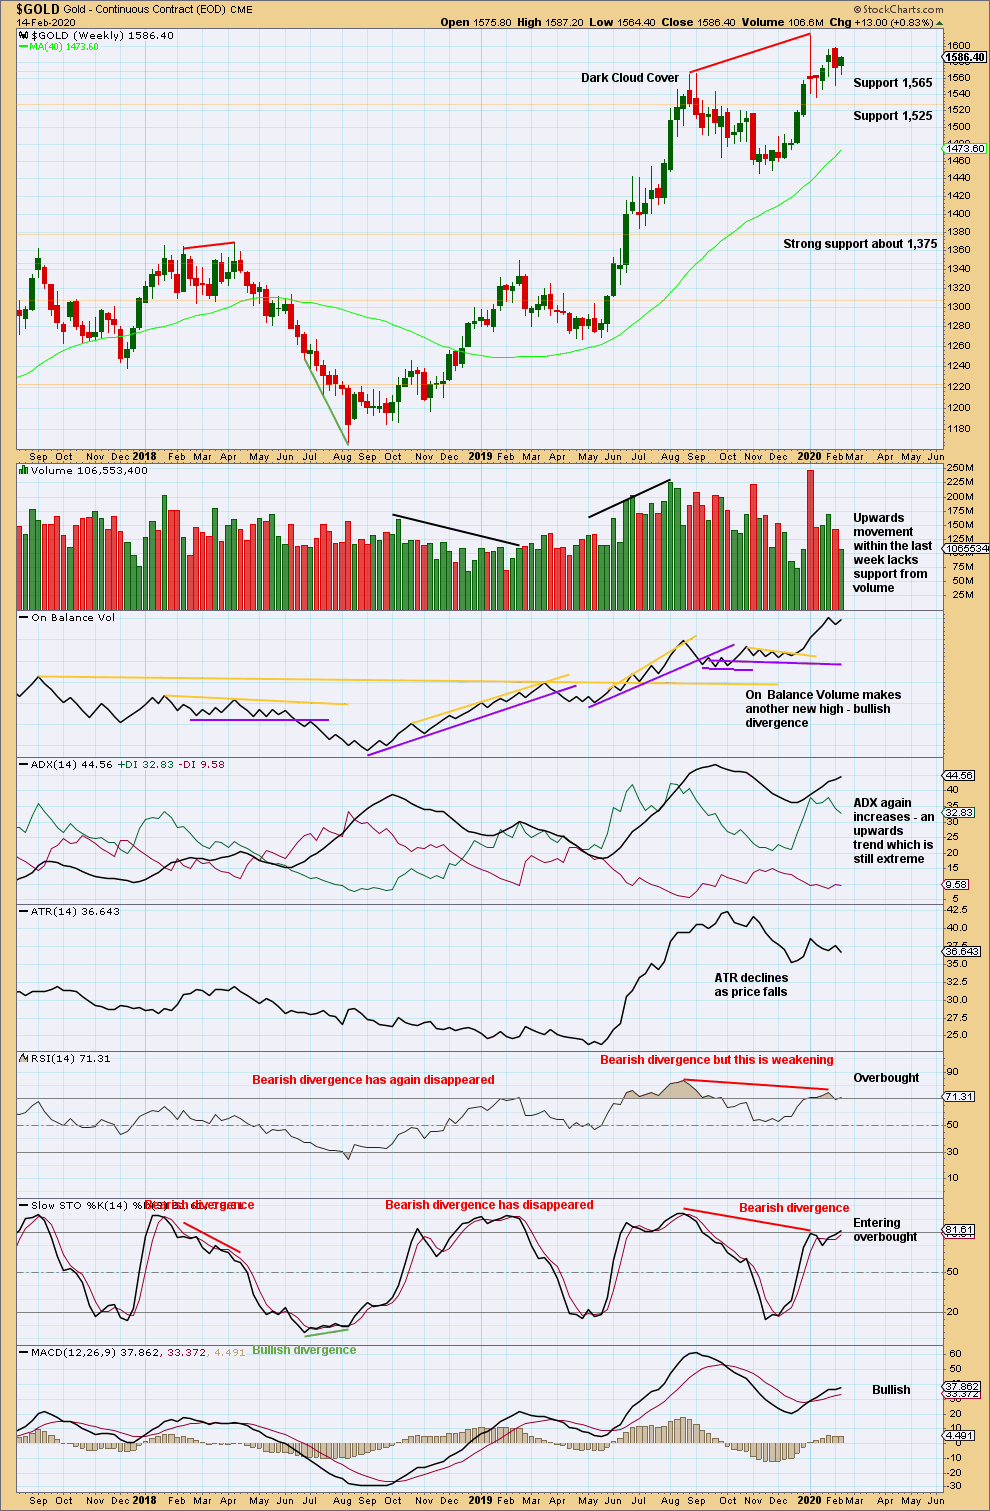
Bullish divergence between price and On Balance Volume is contradicted by bearish divergence between price and RSI. More weight may be given to RSI as this tends to be slightly more reliable, particularly after it has reached extreme. This would support the main bearish wave count.
The upwards trend reached extreme and RSI reached overbought. After reaching overbought, RSI then exhibited bearish divergence. This set up is often (not always) seen at major trend changes.
A small range inside week closes green. The lack of support last week for upwards movement supports the main Elliott wave count.
DAILY CHART
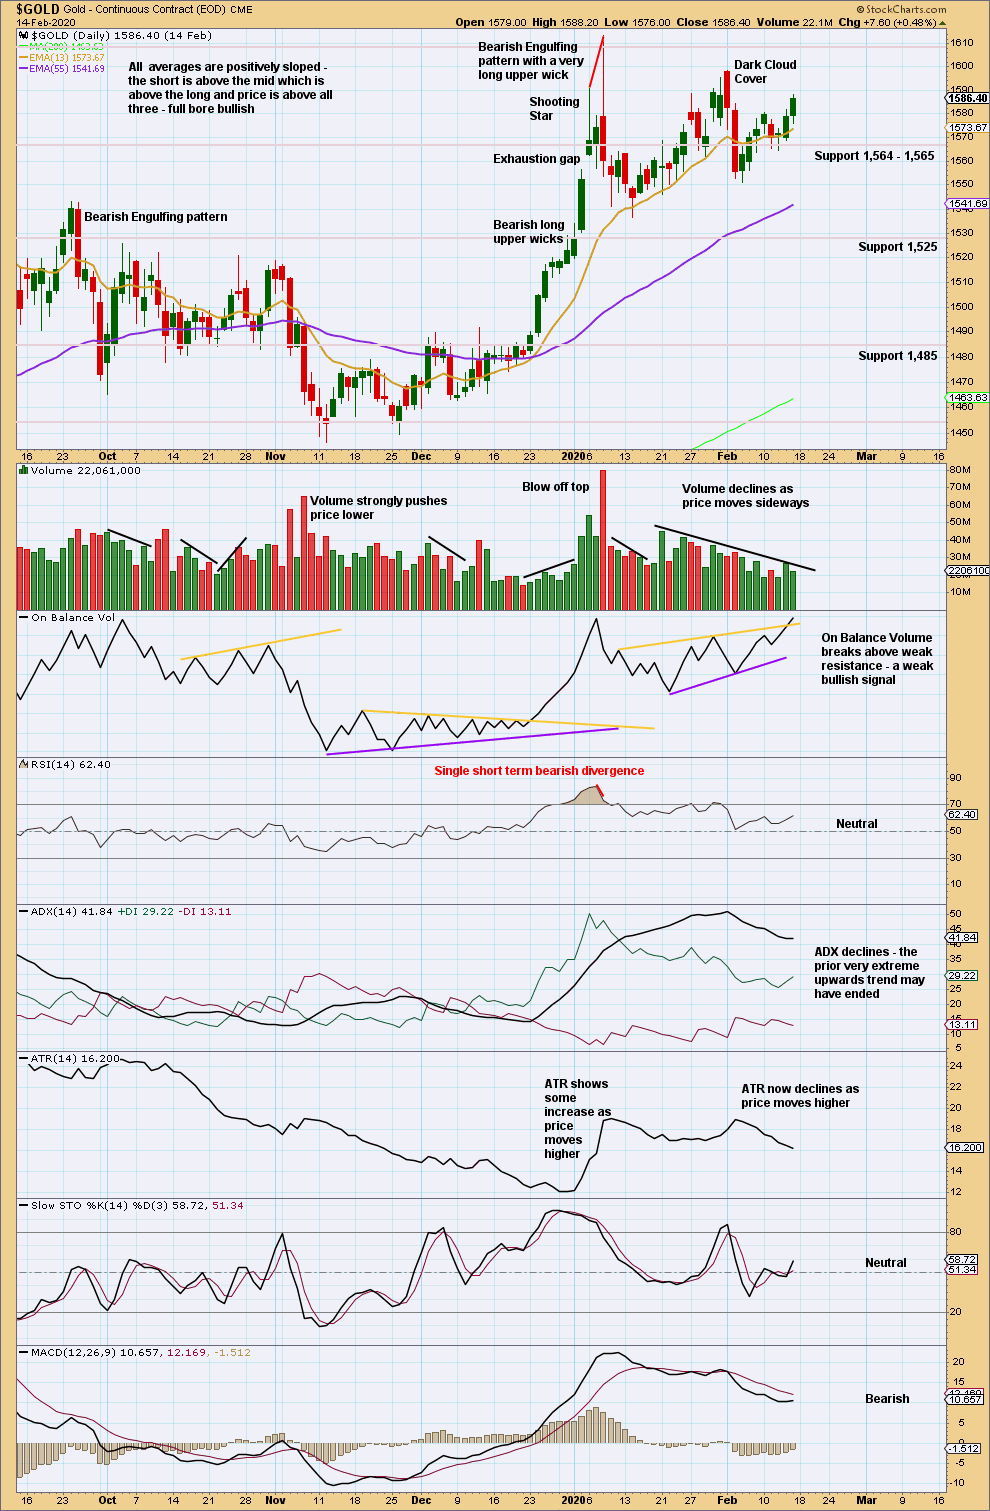
Click chart to enlarge. Chart courtesy of StockCharts.com.
The last Bearish Engulfing pattern has strong support from volume, which increases the bearish implications. Expect a trend change to either down or sideways.
Now a strong downwards day after Dark Cloud Cover reinforces the view that a sustainable high may be in place.
Upwards movement shows increasing weakness; volume does not support upwards movement and range is declining. This looks like a counter trend bounce.
A decline in volume for the last upwards session suggests the counter trend bounce may be over here or over very soon.
GDX WEEKLY CHART
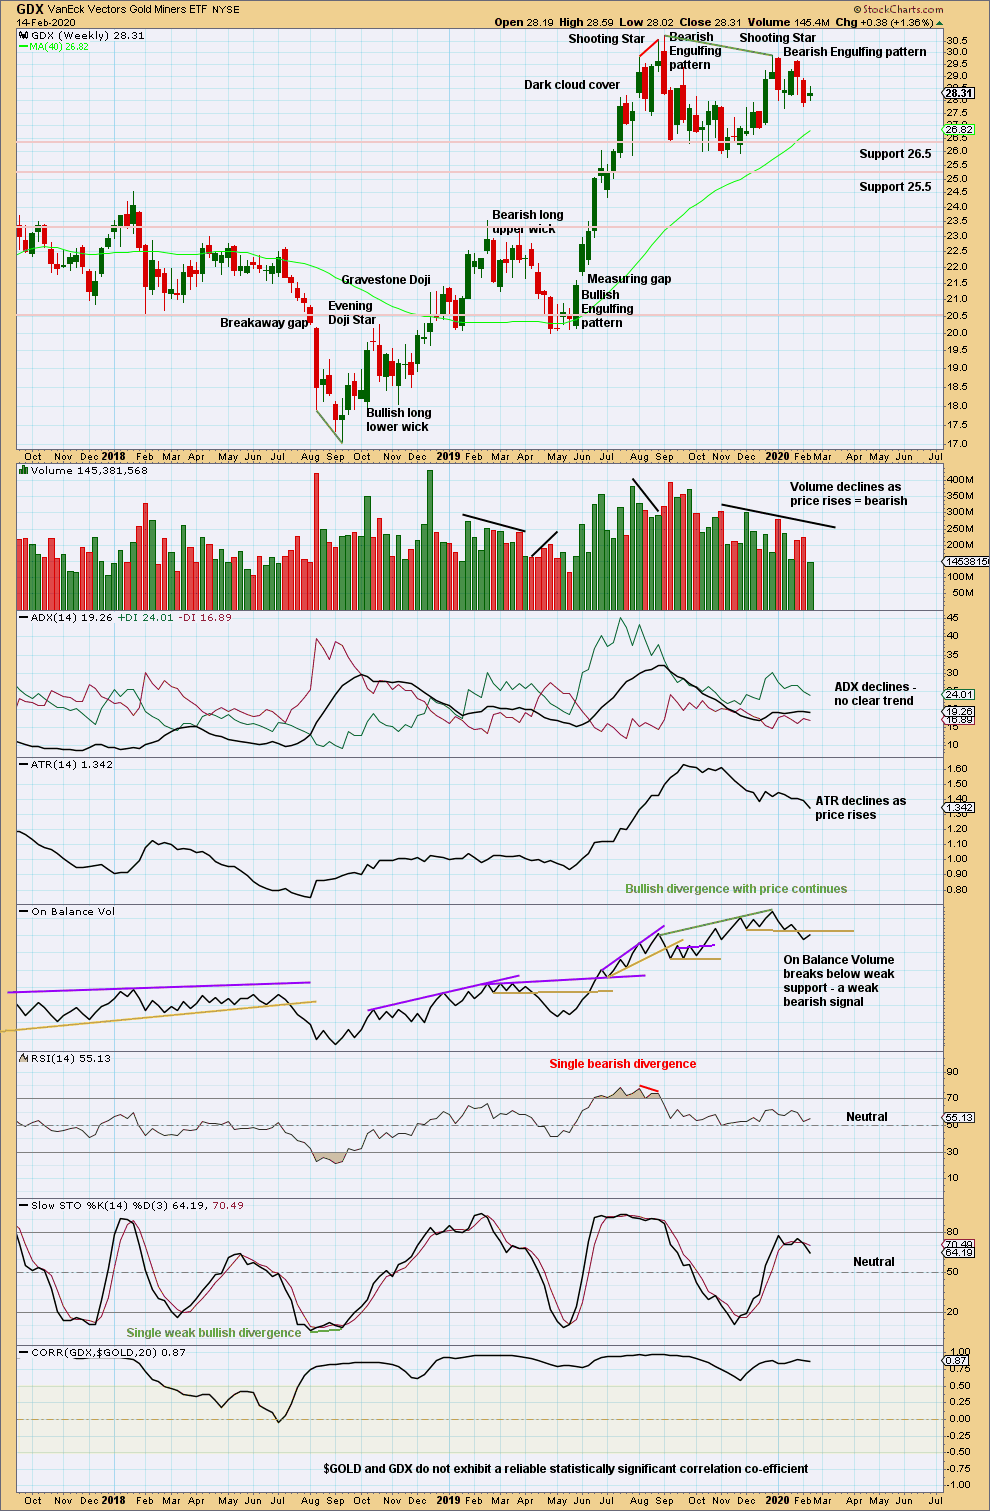
Click chart to enlarge. Chart courtesy of StockCharts.com.
Now two bearish candlestick patterns in a row, the second with support from volume, strongly suggest a trend change here to either down or sideways. The last Bearish Engulfing candlestick pattern has support from volume.
Volume and ATR are both declining as price rises from the last swing low in November 2029. This upwards movement so far has some weakness and looks likely to be a counter trend movement. An inside week that has closed green and has weak volume does not change this view.
GDX DAILY CHART
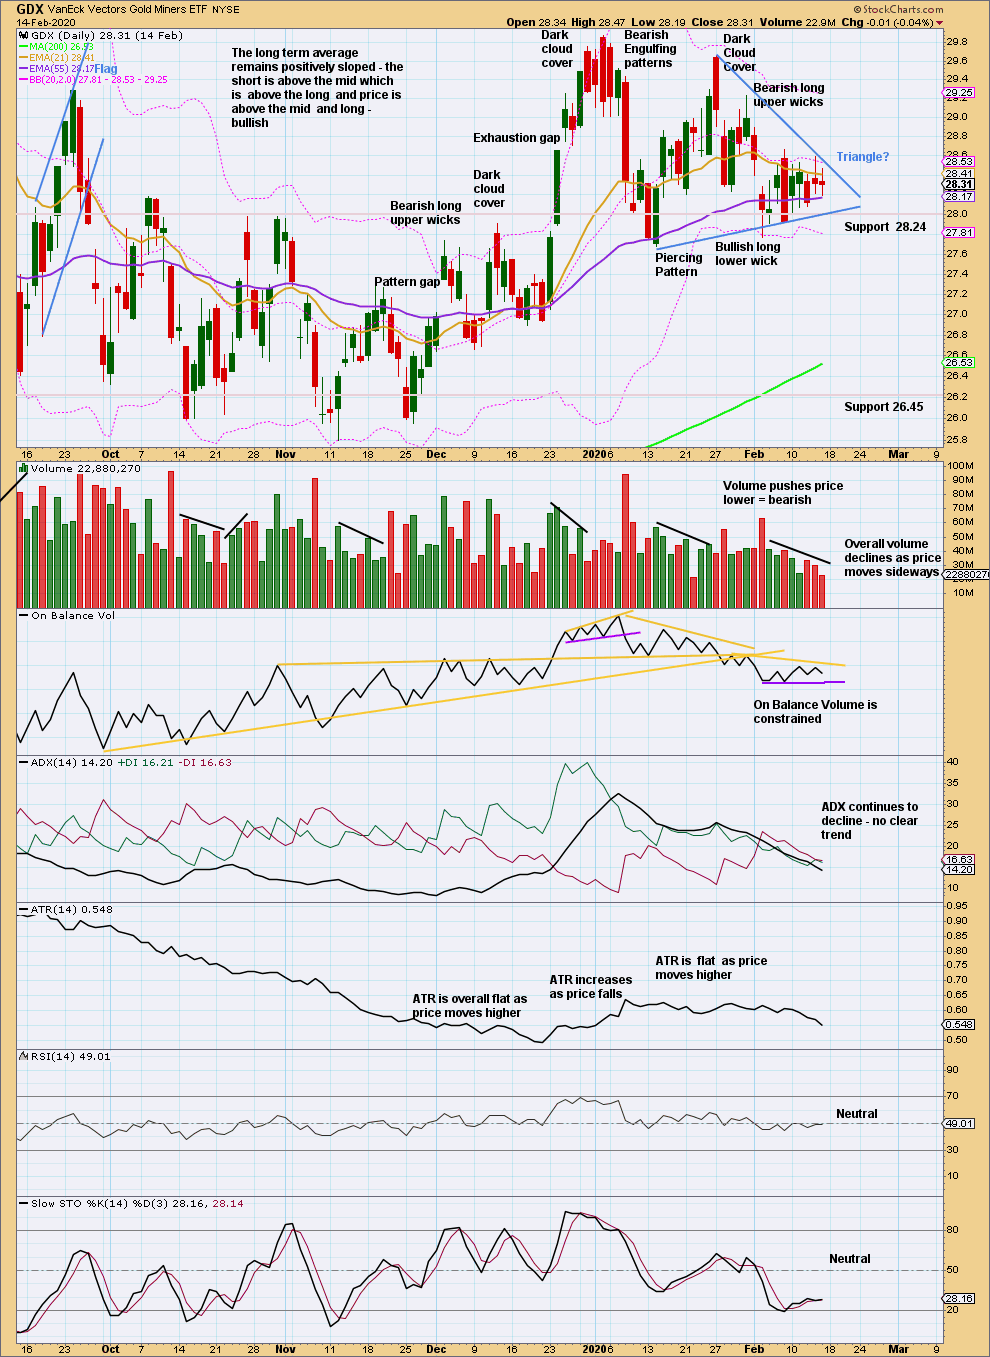
Click chart to enlarge. Chart courtesy of StockCharts.com.
A very strong bearish candlestick after an extreme upwards trend, along with closure of the last gap (now renamed an exhaustion gap) and now two bearish signals from On Balance Volume and volume supporting downwards movement and not upwards, strongly suggest GDX has found a high.
Price is range bound. The volume profile during this consolidation is bearish. This consolidation may be a classic symmetrical triangle. The breakout from these patterns is upwards 54% of the time (Kirkpatrick and Dhalquist – “Technical Analysis”).
Published @ 05:55 p.m. EST.
—
Careful risk management protects your trading account(s).
Follow my two Golden Rules:
1. Always trade with stops.
2. Risk only 1-5% of equity on any one trade.
—
New updates to this analysis are in bold.
quite a lot of volume today. I’m voting for the bull count!
Lara, I have some concerns about my account. I somehow signed up twice and was double billed for 4 months. I was hoping for some resolution, but I have had no answer from your contact website. Please put me in contact with someone by email that can resolve my issue.
We have emailed you and have refunded you $320 on the 15th of February.
We have also been emailing you from admin@elliottwavegold.com and webmaster@elliottwavegold.com. Please check your spam and junk folders and please add our emails to your address book / whitelist.
Please check your paypal account for 15th February and email me when you have found the refund.
zebrahunt, I have just emailed you a .pdf of the payment to your paypal account.
Please respond so I know you have received it.
Thanks Lara. For some reason it had gone to junk. The other emails usually make it to my regular email. I did receive it. I appreciate your response.
Daily chart update
This will remain the main count until there is a new high.
Thought it looked like a blooming continuation triangle – arghhhh
Here’s the idea charted.
Intermediate (2) lasted 8 sessions, intermediate (4) as a triangle would have lasted 25 sessions. The gross disproportion doesn’t give the wave count the right look.
This alternate idea remains as low probability as the alternate in the analysis above.
both ideas need a new high above 1,609.12 for confidence. If that happens the target would be 1,626.
Any new upside targets?
That’s what the alternate is for. But it still needs confidence above 1,609.12.
looks like main count has been invalidated