
GOLD: Elliott Wave and Technical Analysis | Charts – February 18, 2020
Upwards movement has breached the short-term invalidation point but has not made a new high.
Summary: The predominant view of this analysis will remain bearish while price remains below 1,609.12.
A new low below 1,576.43 would indicate a sustainable high may have been place on the 8th of January and a downwards trend has begun. This remains the main wave count as price has strongly breached a channel containing prior upwards movement on the daily chart.
A new high above 1,609.12 would confirm more upwards movement. The initial target would be at 1,626.
A third wave down at two degrees may begin in another one to very few days.
Grand SuperCycle analysis is here.
Monthly charts were last updated here.
BEARISH ELLIOTT WAVE COUNT
WEEKLY CHART
Click chart to enlarge.
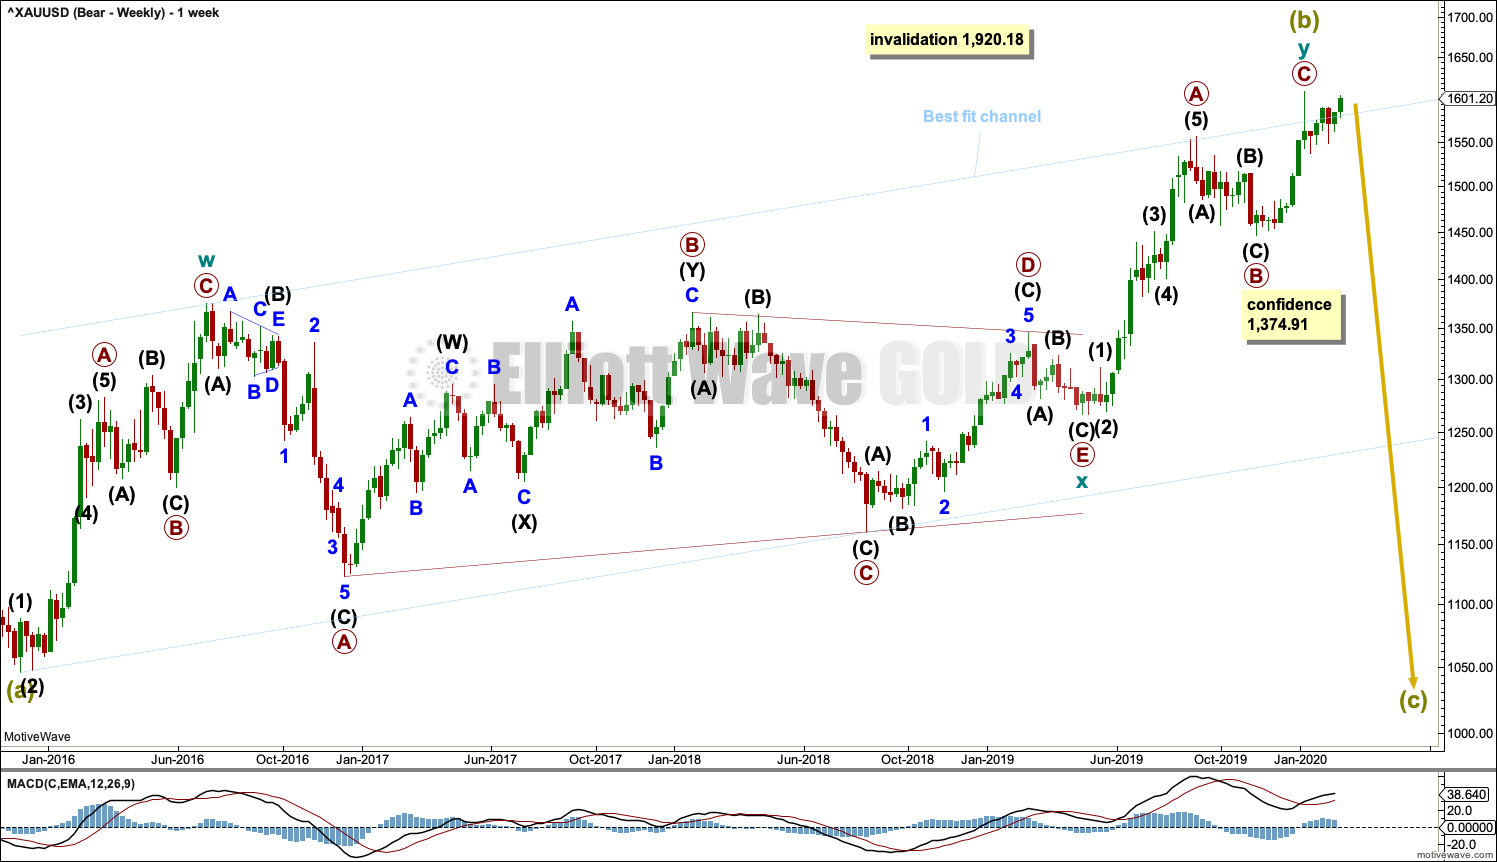
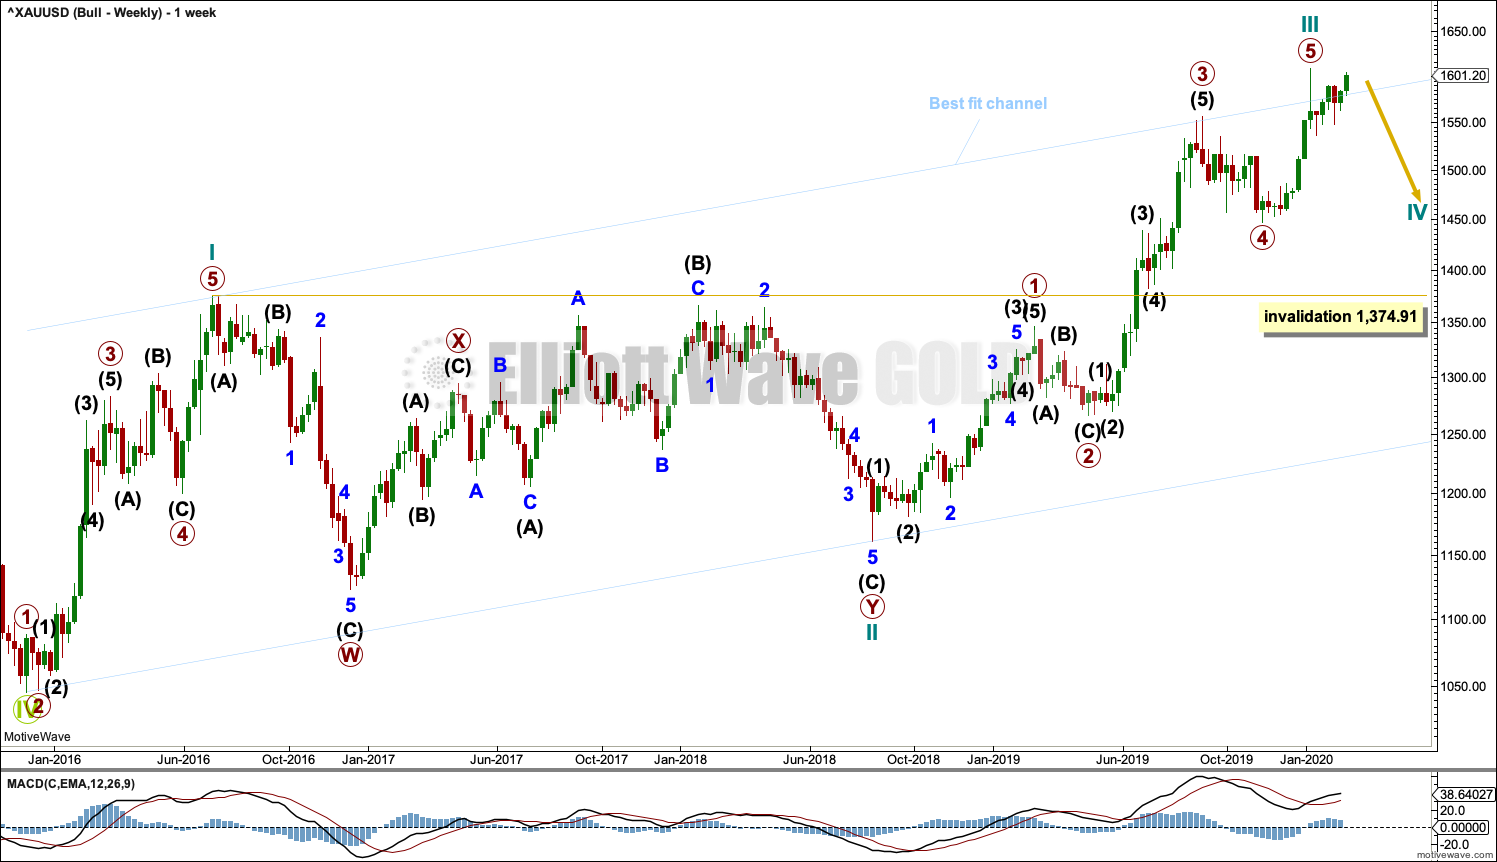
Super Cycle wave (b) may a complete double zigzag. But it is possible that it may be incomplete and may require one final high; this is outlined in an alternate wave count below.
The first zigzag in the double is labelled cycle wave w. The double is joined by a three in the opposite direction, a triangle labelled cycle wave x. The second zigzag in the double is labelled cycle wave y.
The purpose of the second zigzag in a double is to deepen the correction. Cycle wave y has achieved this purpose.
A new low below 1,374.91 would add strong confidence to this wave count. At that stage, the bullish Elliott wave count would be invalidated. At that stage, targets for Super Cycle wave (c) would be calculated.
A wide best fit channel is added in light blue. Copy this channel over to daily charts. Price is again very close to the upper edge of this channel, which may provide resistance.
DAILY CHART
Click chart to enlarge.
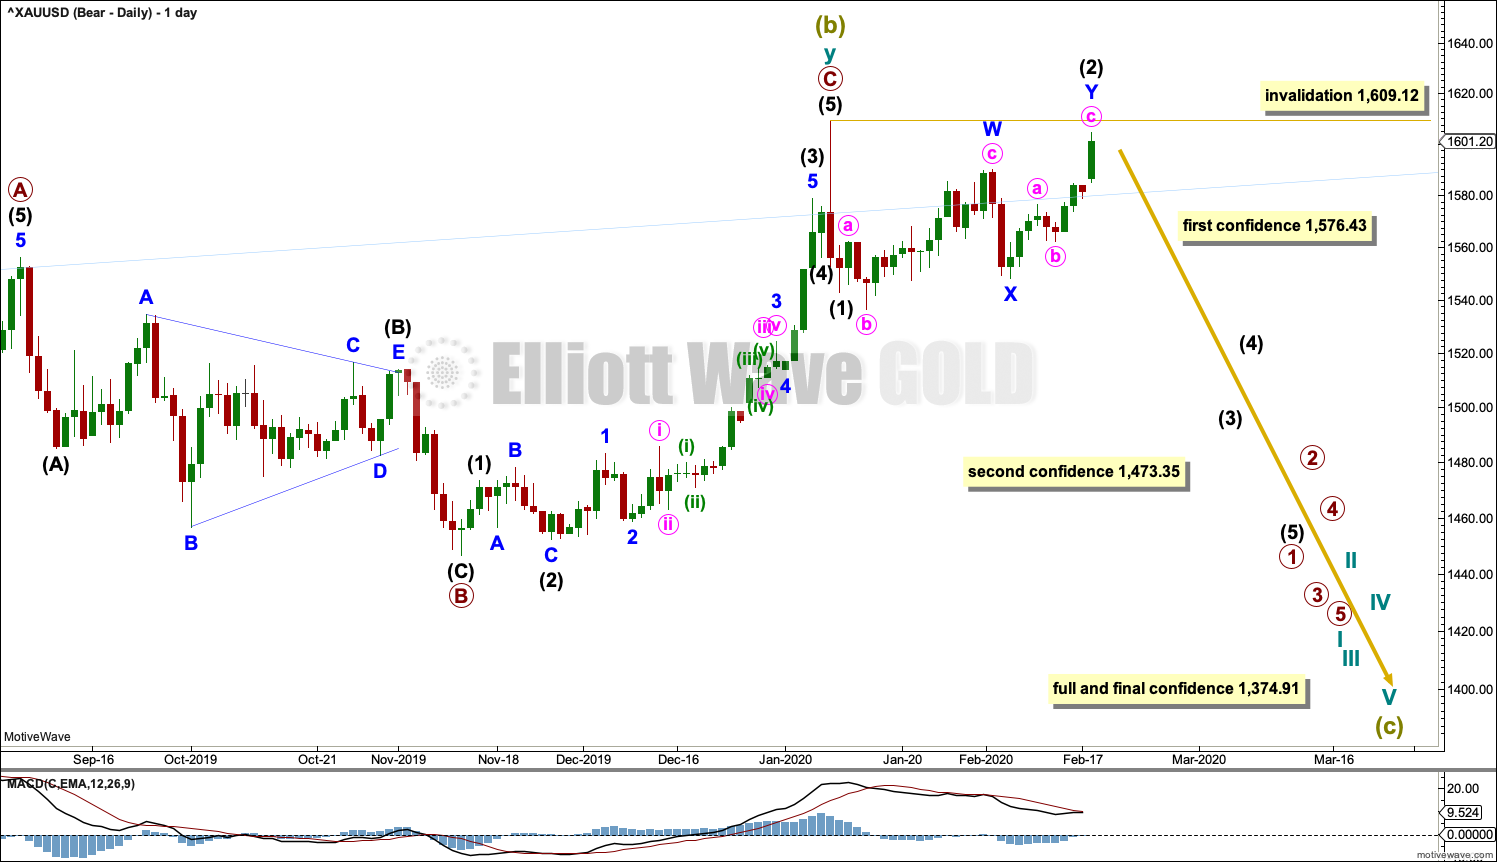
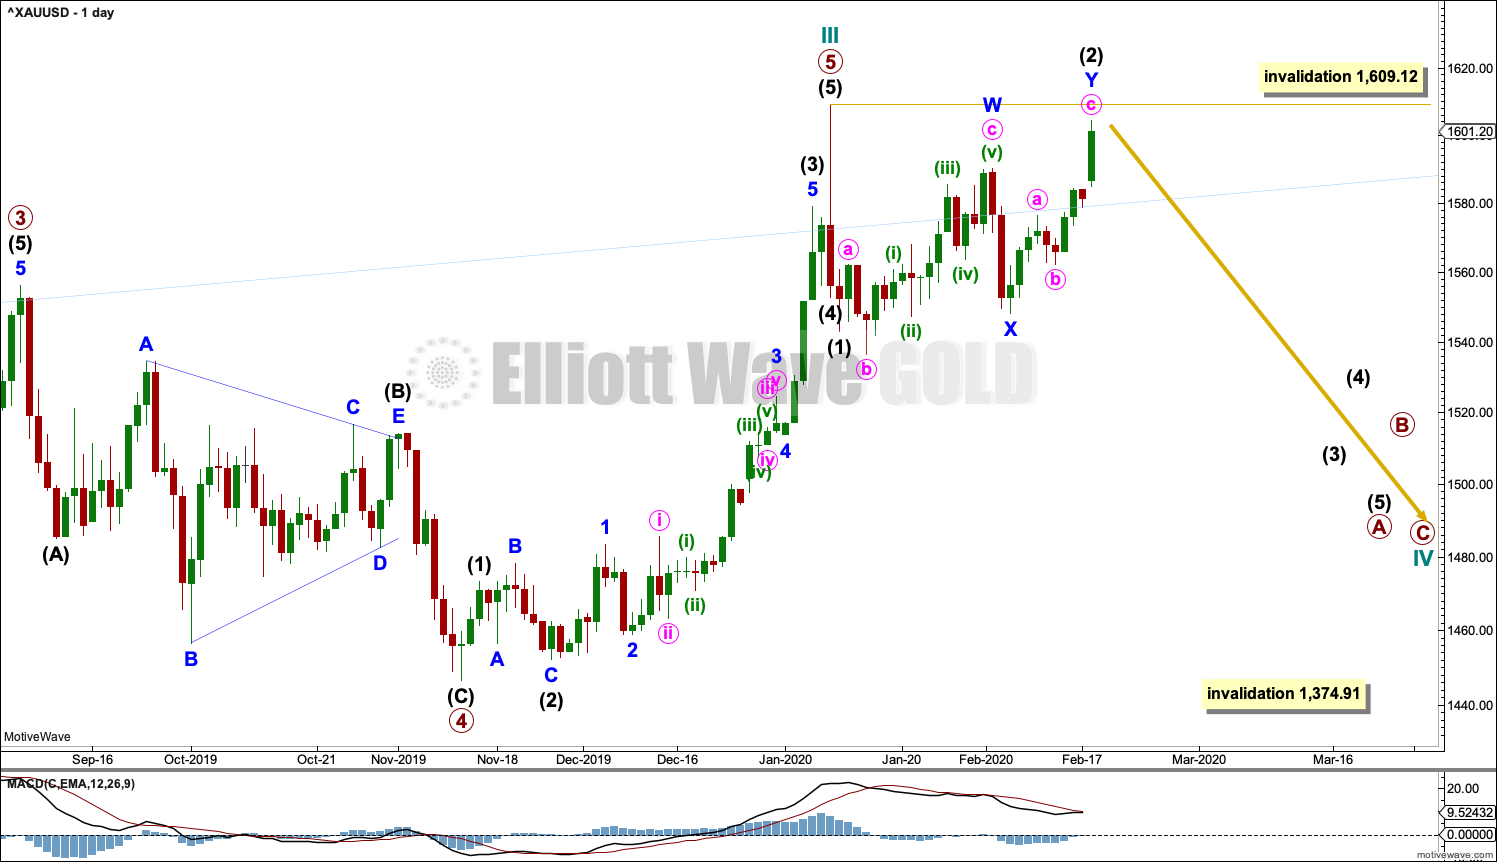
It is possible that Super Cycle wave (b) may be complete and the bear market for Gold may have resumed.
A new low below 1,536.52 would invalidate the alternate bearish wave count and add some confidence in this wave count. A new low below 1,473.35 would add further confidence. Thereafter, a new low by any amount at any time frame below 1,374.91 would invalidate the bullish wave count below and add full and final confidence in this wave count. Targets for Super Cycle wave (c) would be calculated at that stage.
If Super Cycle wave (c) has begun, then it should develop a five wave structure downwards at all time frames up to and including monthly.
Within Super Cycle wave (c), primary wave 1 may be incomplete. Within primary wave 1, intermediate wave (1) may be complete and intermediate wave (2) may be very close to completion. Intermediate wave (2) may not move beyond the start of intermediate wave (1) above 1,609.12. Intermediate wave (2) may be unfolding as a combination: flat – X – zigzag.
Gold typically exhibits very deep and time consuming second wave corrections at the start of a new trend. So far this wave count still has the right look and expects typical behaviour for this market.
HOURLY CHART
Click chart to enlarge.
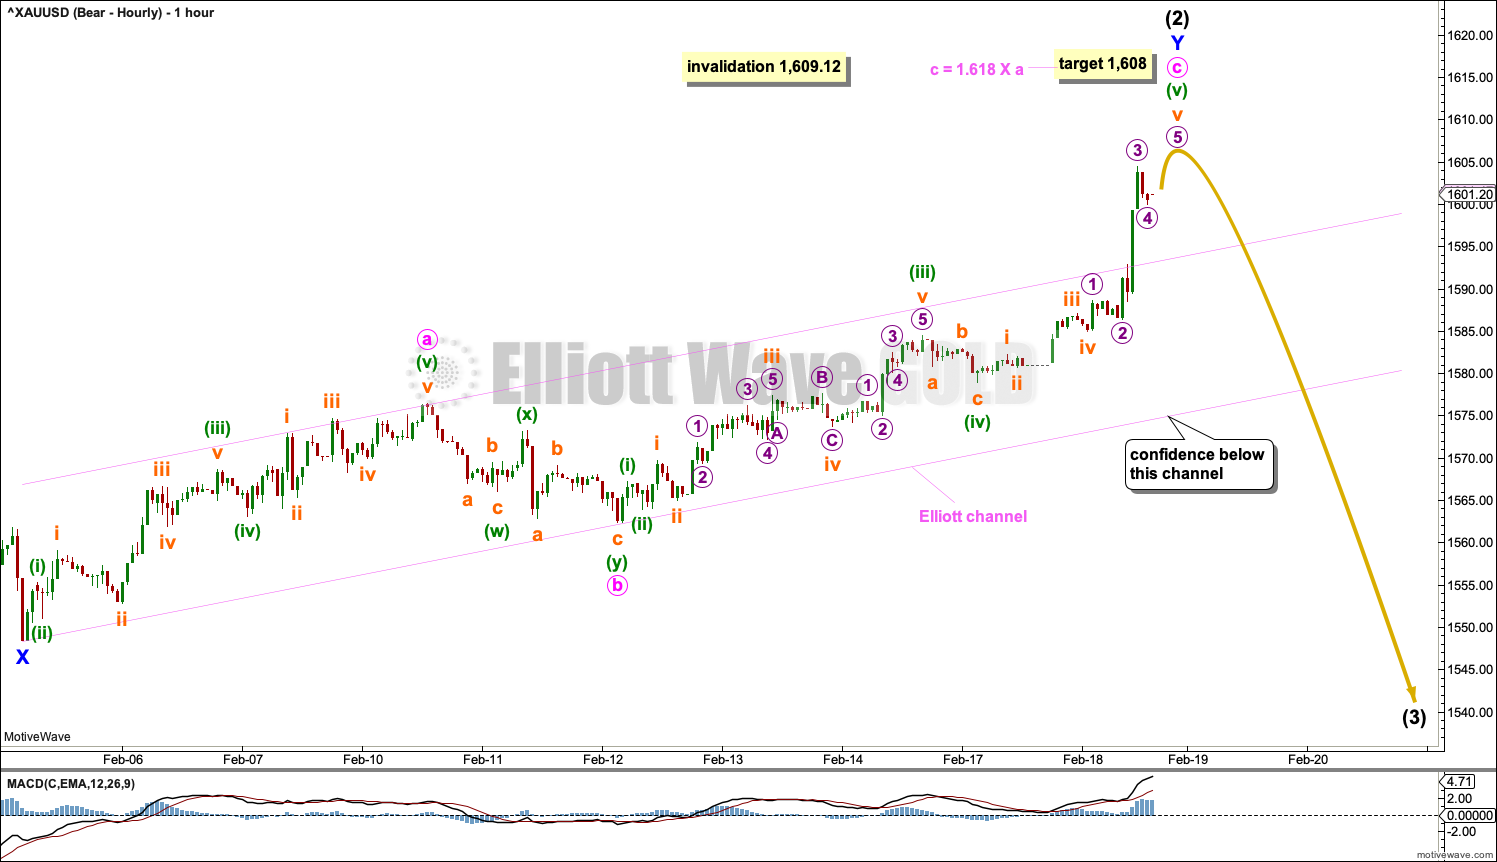
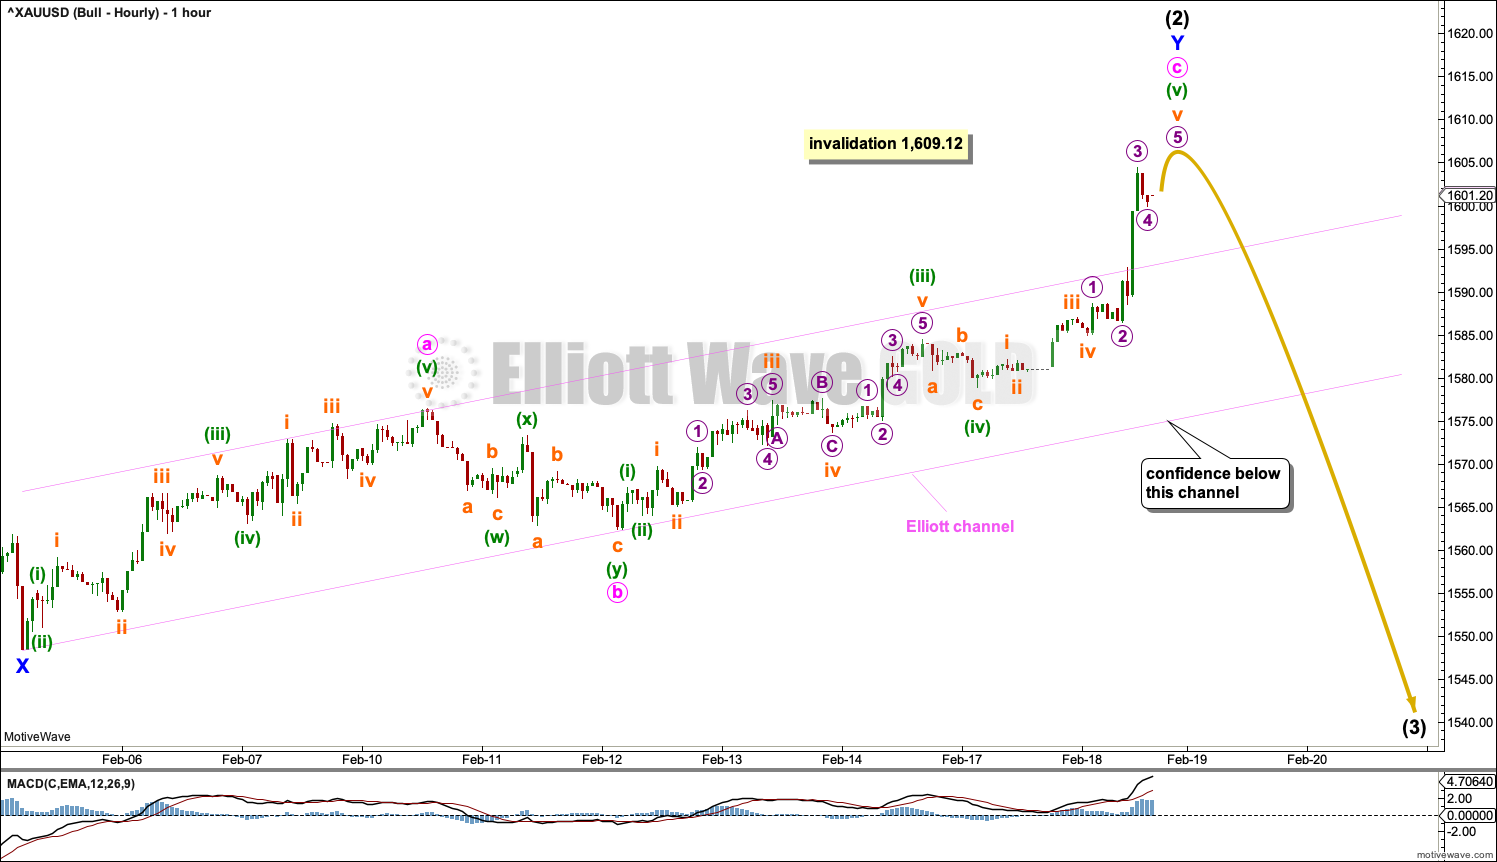
The hourly chart focusses on minor wave Y as a zigzag. Within minor wave Y, at 1,608 minute wave c would reach 1.618 the length of minute wave a. This may be a reasonable target for upwards movement to end.
When intermediate wave (2) may be complete, then a third wave down would be expected for this wave count.
ALTERNATE DAILY CHART
Click chart to enlarge.
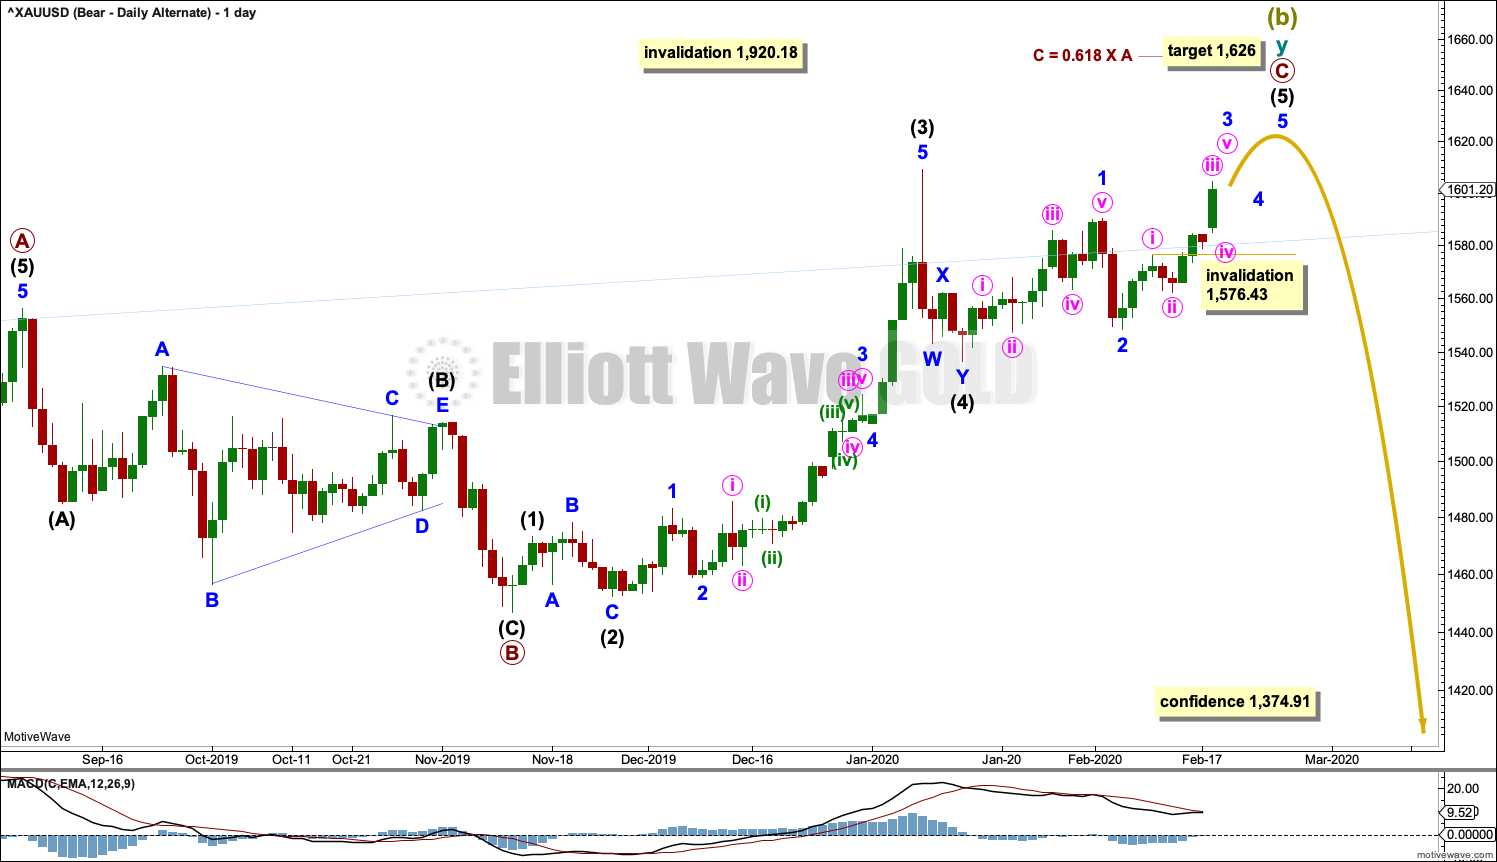
The double zigzag for Super Cycle wave (b) may be still incomplete.
Within cycle wave y, primary waves A and B are complete. Primary wave C must complete as a five wave structure. It is unfolding as an impulse. Within the impulse, intermediate waves (1) to (4) may now be complete.
Intermediate wave (2) was a deep 0.79 zigzag, which lasted 8 sessions. Intermediate wave (4) may have been a shallow 0.46 double zigzag lasting 4 sessions. Fourth waves are usually more brief than second waves for Gold.
Within intermediate wave (5), minor wave 2 may not move beyond the start of minor wave 1 below 1,536.52.
Sideways and downwards movement of the last few weeks is now too large to look like a normal part of primary wave C. This wave count now does not have the right look. Its probability is low.
I have charted and considered the possibility that intermediate wave (4) continued sideways as a triangle and is now complete, but this idea suffers from the same problem of proportion as the idea in the alternate chart above. There is no difference in expected direction.
BULLISH ELLIOTT WAVE COUNT
WEEKLY CHART
Click chart to enlarge.
This wave count sees the the bear market complete at the last major low for Gold on 3 December 2015.
If Gold is in a new bull market, then it should begin with a five wave structure upwards on the weekly chart. However, the biggest problem with this wave count is the structure labelled cycle wave I because this wave count must see it as a five wave structure, but it looks more like a three wave structure.
Commodities often exhibit swift strong fifth waves that force the fourth wave corrections coming just prior and just after to be more brief and shallow than their counterpart second waves. It is unusual for a commodity to exhibit a quick second wave and a more time consuming fourth wave, and this is how cycle wave I is labelled. This wave count still suffers from this very substantial problem, which is one reason why the bearish wave count is preferred because it has a better fit in terms of Elliott wave structure.
Cycle wave II subdivides well as a double combination: zigzag – X – expanded flat.
Cycle wave III may now be complete. Cycle wave IV may now move lower over several weeks to months.
Cycle wave II subdivides as a double combination, which lasted 110 weeks. Given the guideline of alternation, cycle wave IV may be expected to most likely subdivide as a zigzag. Cycle wave IV may be more brief than cycle wave II; Gold’s fourth waves tend to be more brief and zigzags tend to be more brief than combinations.
Cycle wave IV may not move into cycle wave I price territory below 1,374.91.
Add the wide best fit channel to weekly and daily charts.
DAILY CHART
Click chart to enlarge.
Cycle wave IV would most likely subdivide as a zigzag, which may last several months. Within a zigzag, primary wave A must subdivide as a five wave structure, most likely an impulse. Within the impulse, intermediate waves (1) and (2) may now most likely be complete. Within intermediate wave (3), minor wave 2 may not move beyond the start of minor wave 1 above 1,590.31.
A new downwards trend at cycle degree should begin with a five wave structure downwards at the daily chart level. That would still be incomplete.
HOURLY CHART
Click chart to enlarge.
Hourly charts are the same.
TECHNICAL ANALYSIS
WEEKLY CHART
Click chart to enlarge. Chart courtesy of StockCharts.com.
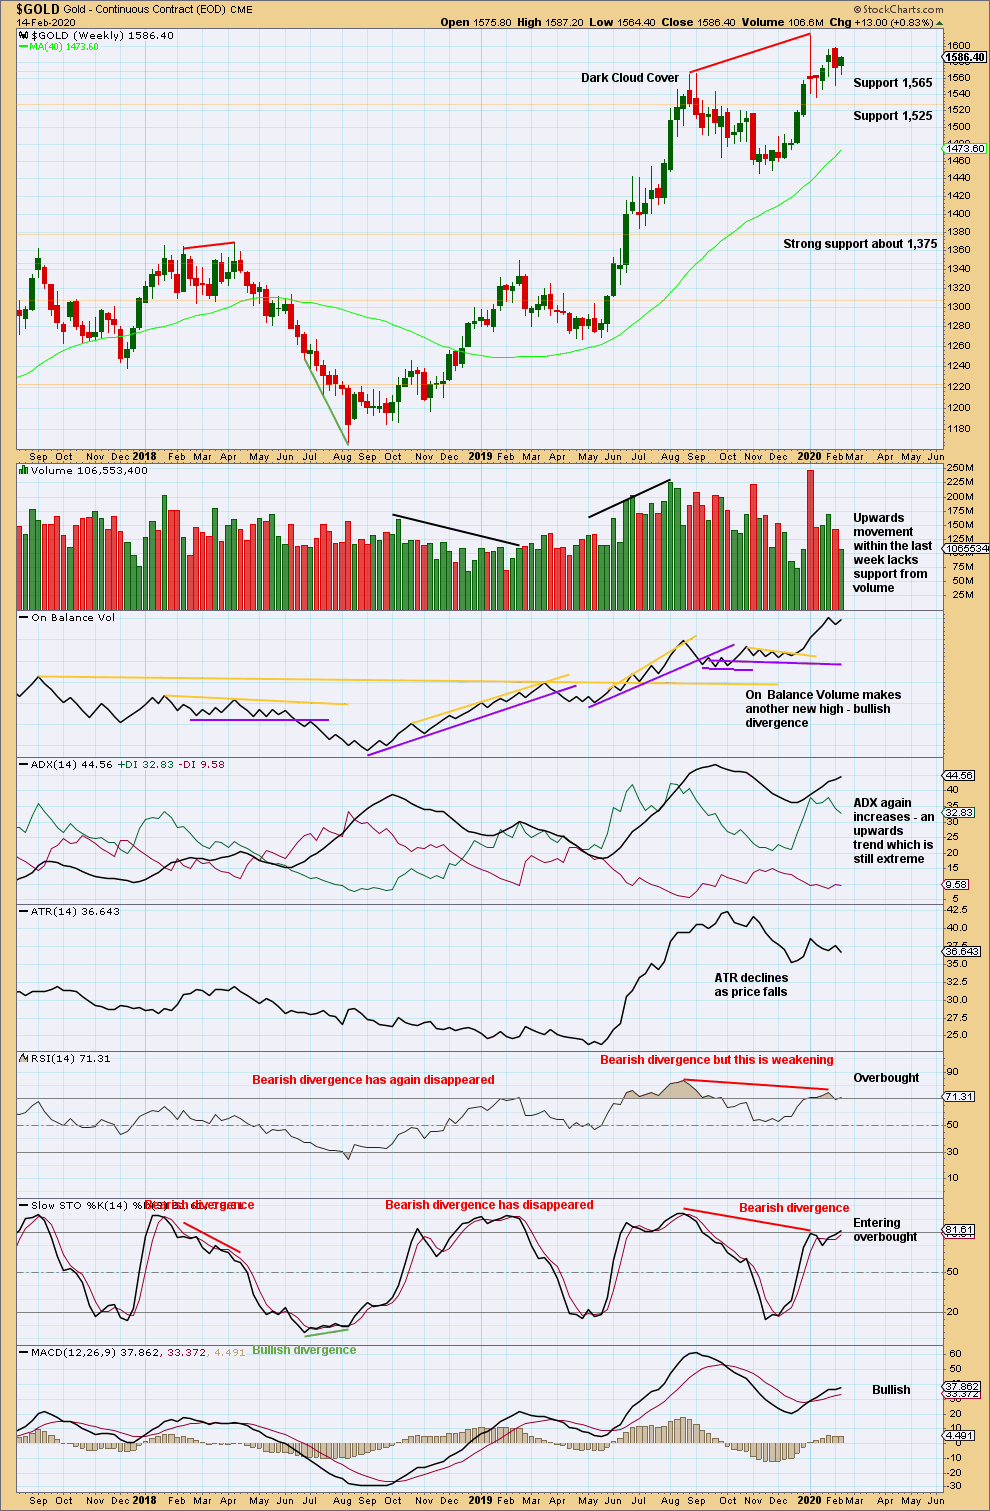
Bullish divergence between price and On Balance Volume is contradicted by bearish divergence between price and RSI. More weight may be given to RSI as this tends to be slightly more reliable, particularly after it has reached extreme. This would support the main bearish wave count.
The upwards trend reached extreme and RSI reached overbought. After reaching overbought, RSI then exhibited bearish divergence. This set up is often (not always) seen at major trend changes.
A small range inside week closes green. The lack of support last week for upwards movement supports the main Elliott wave count.
DAILY CHART
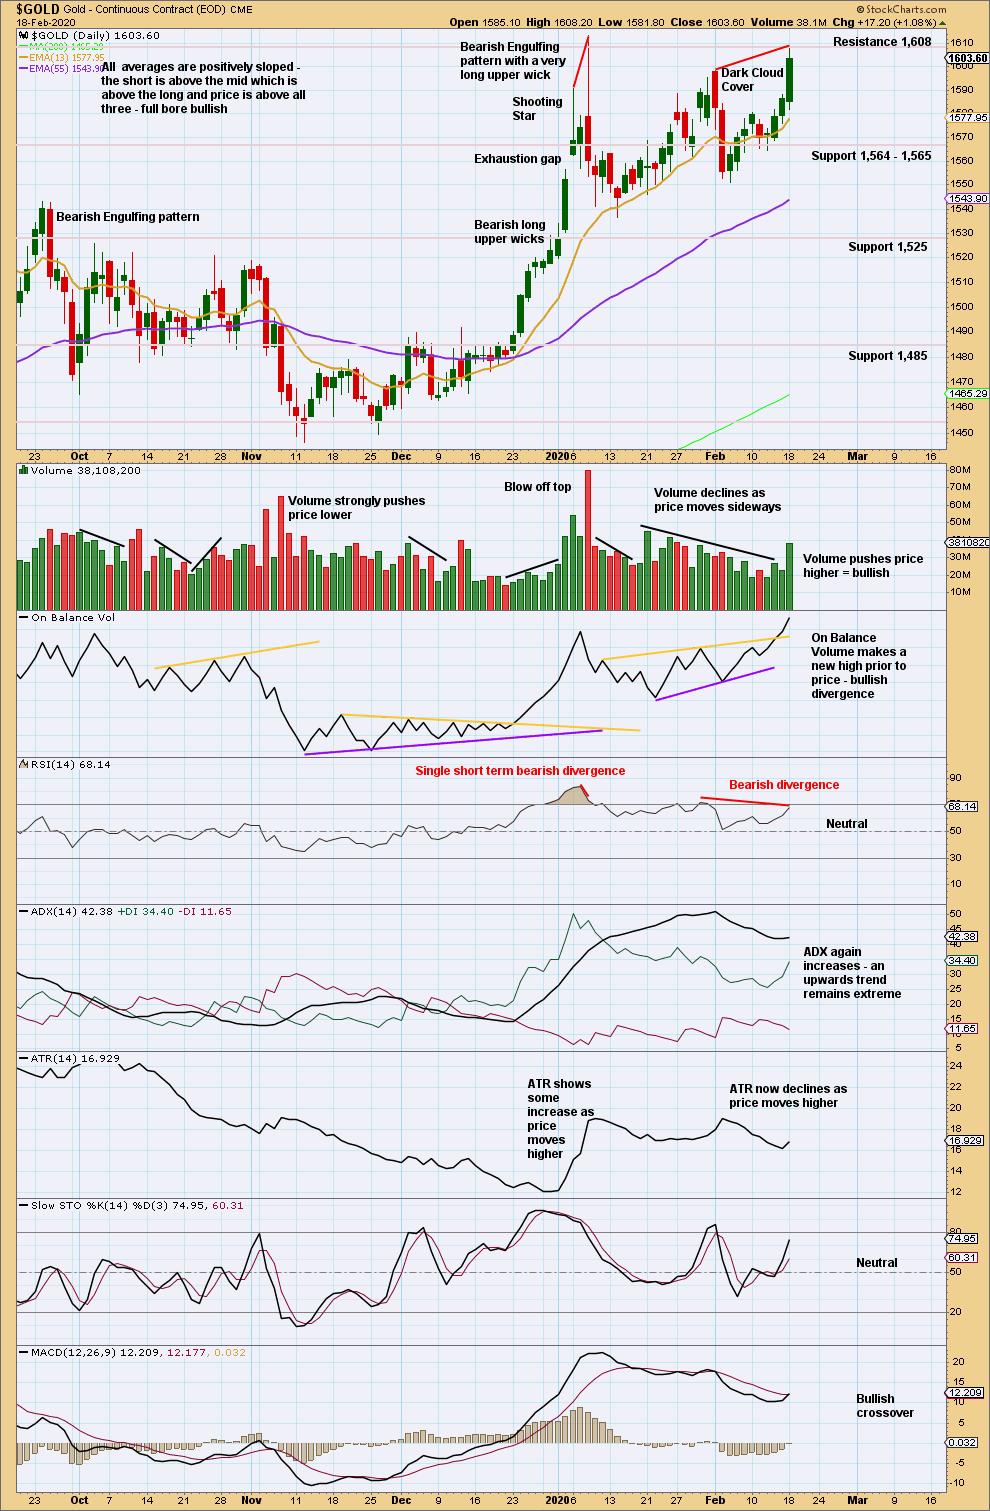
Click chart to enlarge. Chart courtesy of StockCharts.com.
Upwards movement of the last session exhibits some strength from volume and bullishness from On Balance Volume. However, sideways movement since 8th January has not been long or deep enough to resolve extreme ADX. If price can overcome resistance here, then upwards movement may be limited by extreme conditions.
GDX WEEKLY CHART
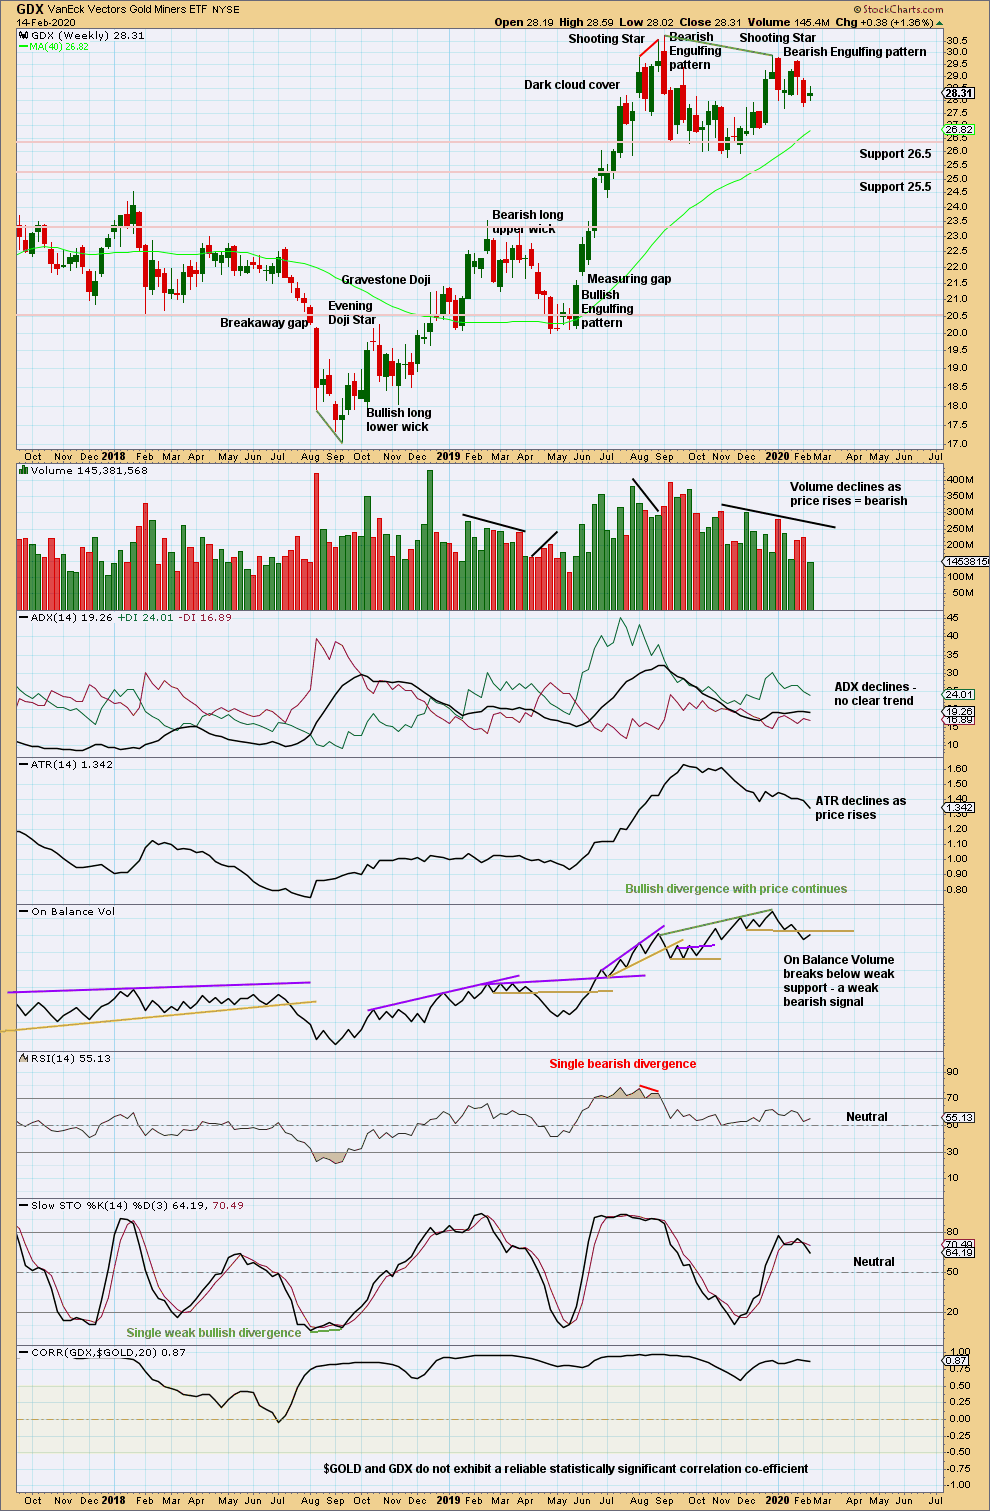
Click chart to enlarge. Chart courtesy of StockCharts.com.
Now two bearish candlestick patterns in a row, the second with support from volume, strongly suggest a trend change here to either down or sideways. The last Bearish Engulfing candlestick pattern has support from volume.
Volume and ATR are both declining as price rises from the last swing low in November 2029. This upwards movement so far has some weakness and looks likely to be a counter trend movement. An inside week that has closed green and has weak volume does not change this view.
GDX DAILY CHART
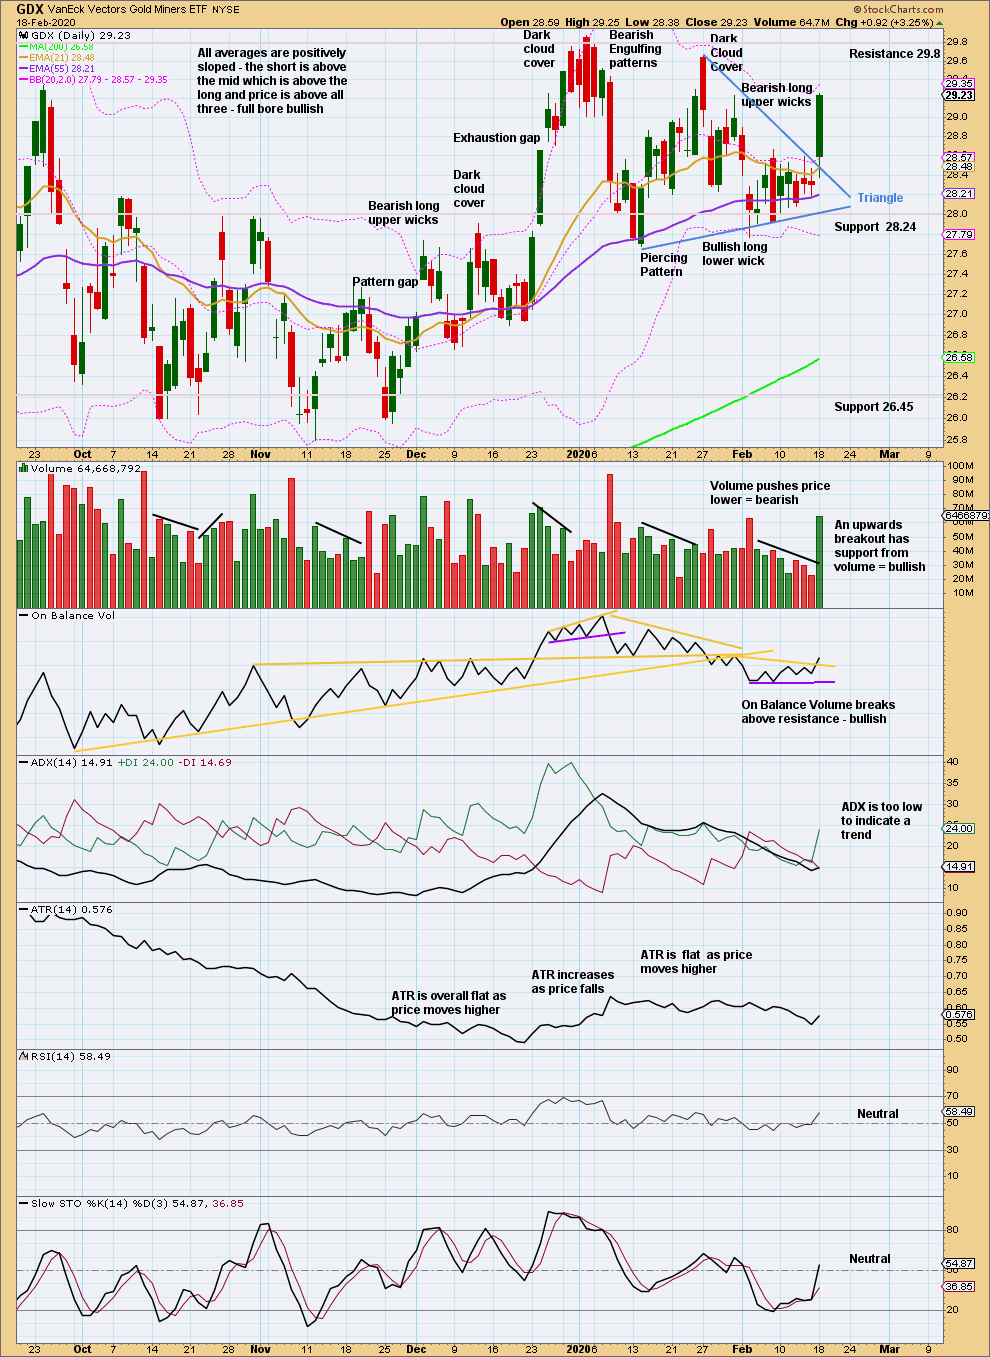
Click chart to enlarge. Chart courtesy of StockCharts.com.
Today fits the definition of an upwards breakout from a symmetrical triangle. A target calculated from the triangle is at 30.47.
Published @ 07:08 p.m. EST.
—
Careful risk management protects your trading account(s).
Follow my two Golden Rules:
1. Always trade with stops.
2. Risk only 1-5% of equity on any one trade.
—
New updates to this analysis are in bold.
Hello Lara, Just noticed that you updated with 2.no new charts, as i was uploading. Thanks
I’m liking your triangle chart best here, let’s see how it plays out.
I’m thinking we’re pushing higher from a triangle at 1564.90. Using waves 1 through 3, and then using a 38.2% fib extn, wave (i) of (v) target i have is at 1626.40 > 1641.30
Just looking to push higher through that 1619.20 for final confirmation though, sometime soon.
Updated daily bear alt chart, now the main count.
Target remains the same.
Updated bull chart
This one looks at the triangle idea.
The target is back to the old target of cycle III = 1.618 X cycle I
Main count now invalidated on a cash basis, but not futures.
Think that’s that then – Lara works on cash
Dear Lara, appreciate if you could comment on my count posted about a week ago: https://elliottwavegold.com/2020/02/gold-elliott-wave-and-technical-analysis-charts-february-10-2020/
thank you for your time.
I have replied there. Thank you.
Gotcha. Thanks a lot.