
GOLD: Elliott Wave and Technical Analysis | Charts – February 20, 2020
Upwards movement has continued today towards the targets. Targets for a bullish and a bearish Elliott wave count are close together.
Summary: The target is about 1,626 to 1,630.
Conditions remain extreme and upwards movement here may be limited.
Grand SuperCycle analysis is here.
Monthly charts were last updated here.
BEARISH ELLIOTT WAVE COUNT
WEEKLY CHART
Click chart to enlarge.
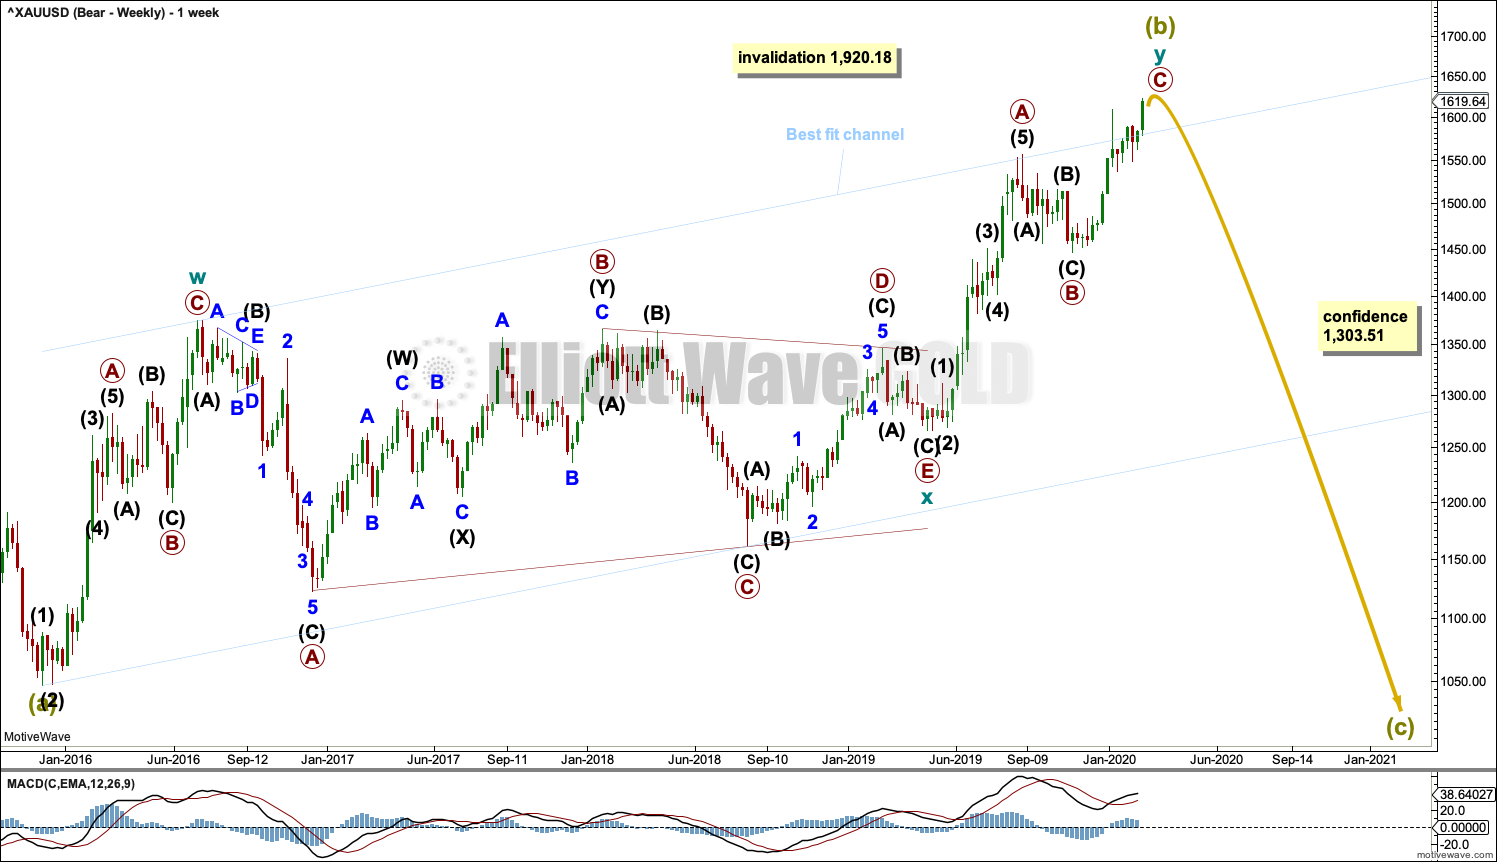
Super Cycle wave (b) may be an incomplete double zigzag.
The first zigzag in the double is labelled cycle wave w. The double is joined by a three in the opposite direction, a triangle labelled cycle wave x. The second zigzag in the double is labelled cycle wave y.
The purpose of the second zigzag in a double is to deepen the correction. Cycle wave y has achieved this purpose.
A wide best fit channel is added in light blue. Copy this channel over to daily charts. Price is again very close to the upper edge of this channel, which may provide resistance.
DAILY CHART
Click chart to enlarge.
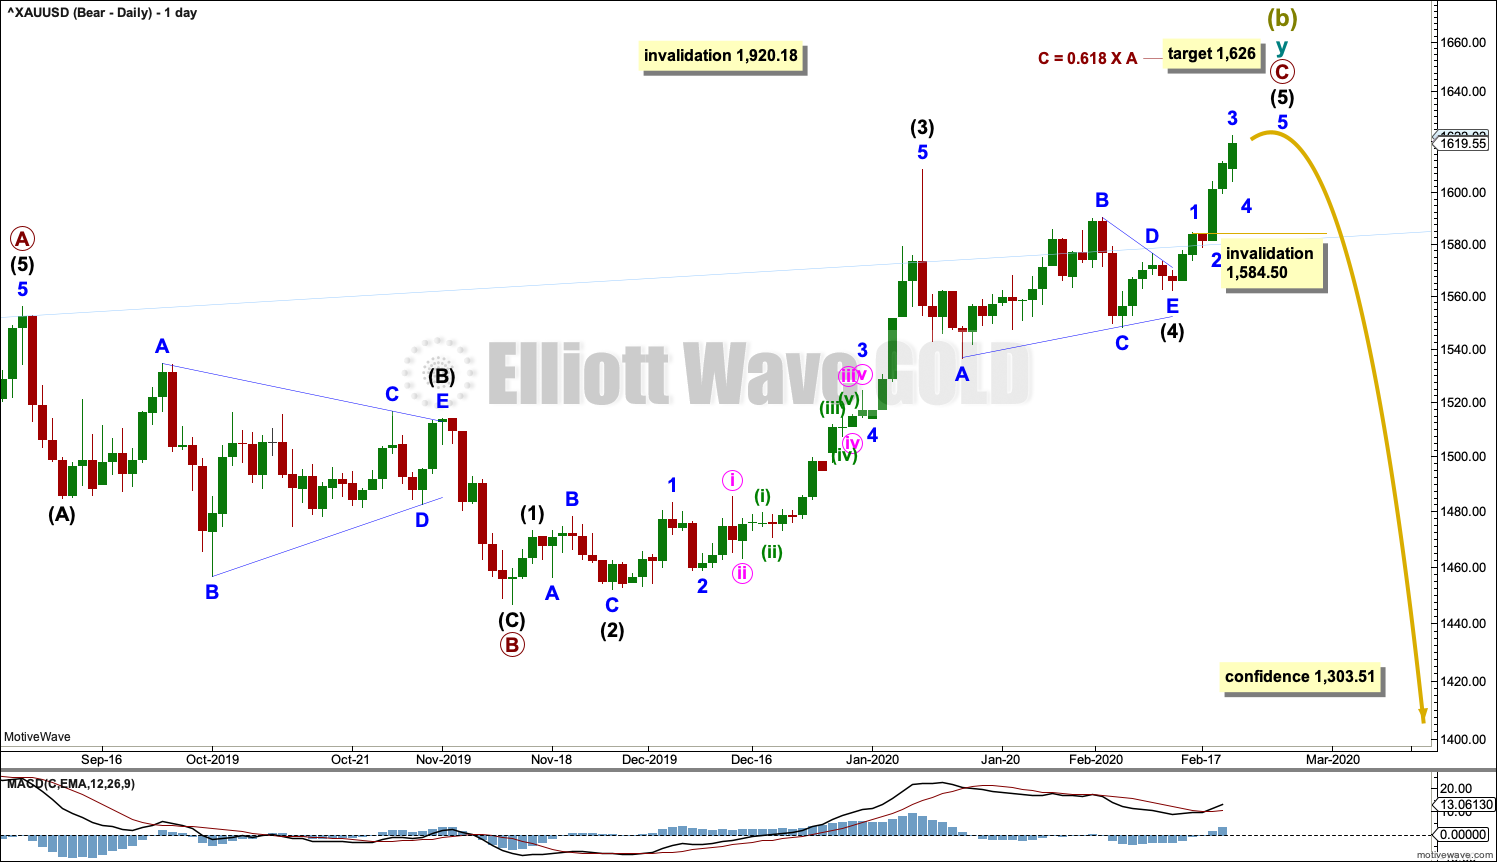
Super Cycle wave (b) may be close to completion. It may end within one to two weeks now.
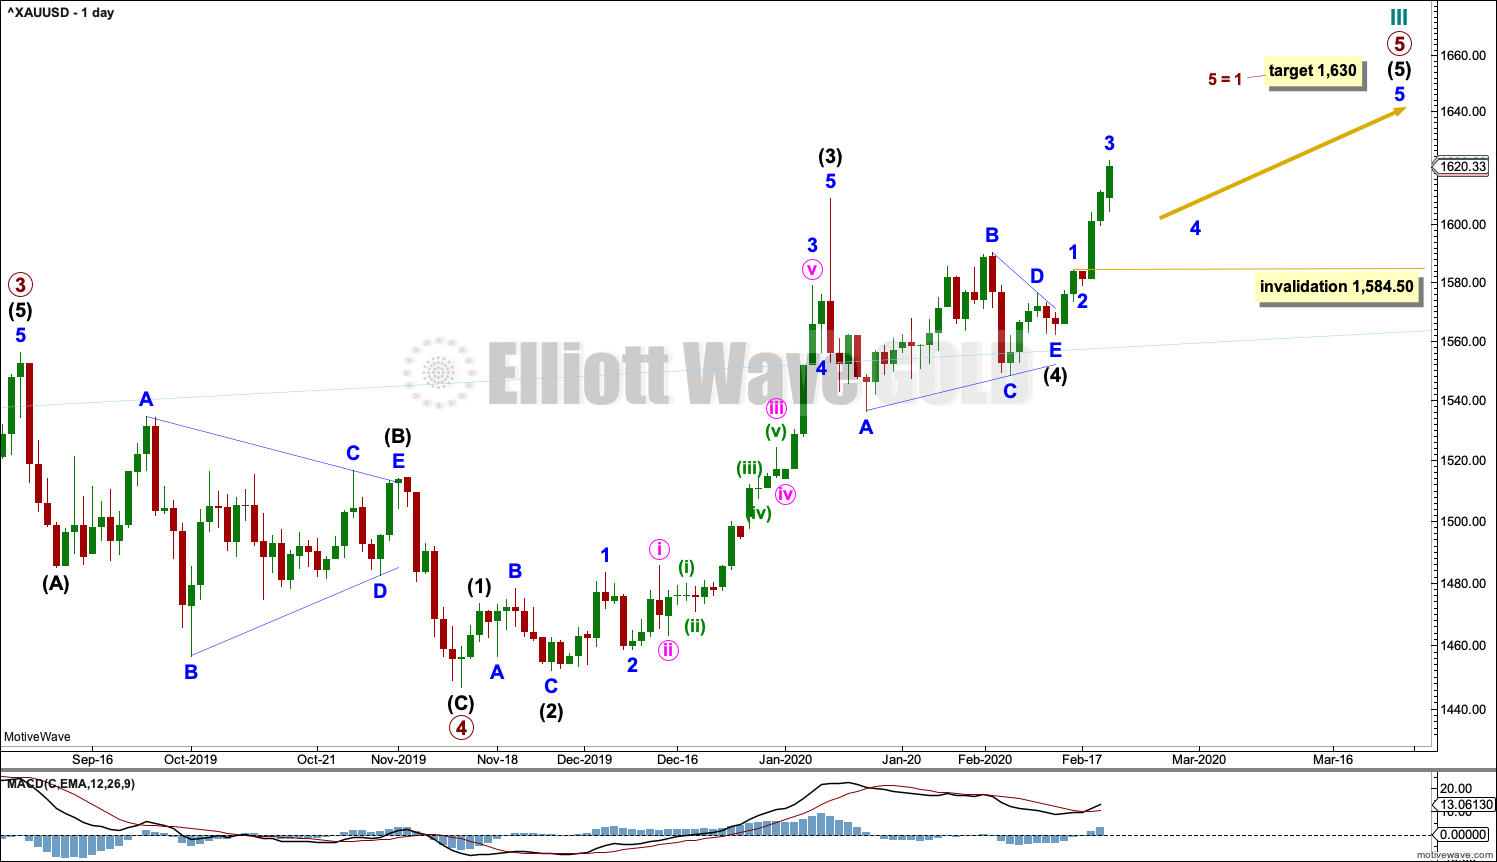
Within the zigzag of cycle wave y, primary waves A and B may be complete and primary wave C must subdivide as a five wave structure. Primary wave C may be an impulse that may now be close to completion.
Within the impulse of primary wave C, intermediate wave (2) subdivides as an expanded flat, which lasted 8 sessions, and intermediate wave (4) may most likely be a triangle that lasted 25 sessions. There is disproportion between these corrections, which is not typical behaviour for this market; but with other wave counts now invalidated, this lower probability wave count now remains as the sole explanation for recent movement.
A target is calculated for primary wave C to end.
Within intermediate wave (5), minor wave 4 may not move into minor wave 1 price territory below 1,584.50.
HOURLY CHART
Click chart to enlarge.
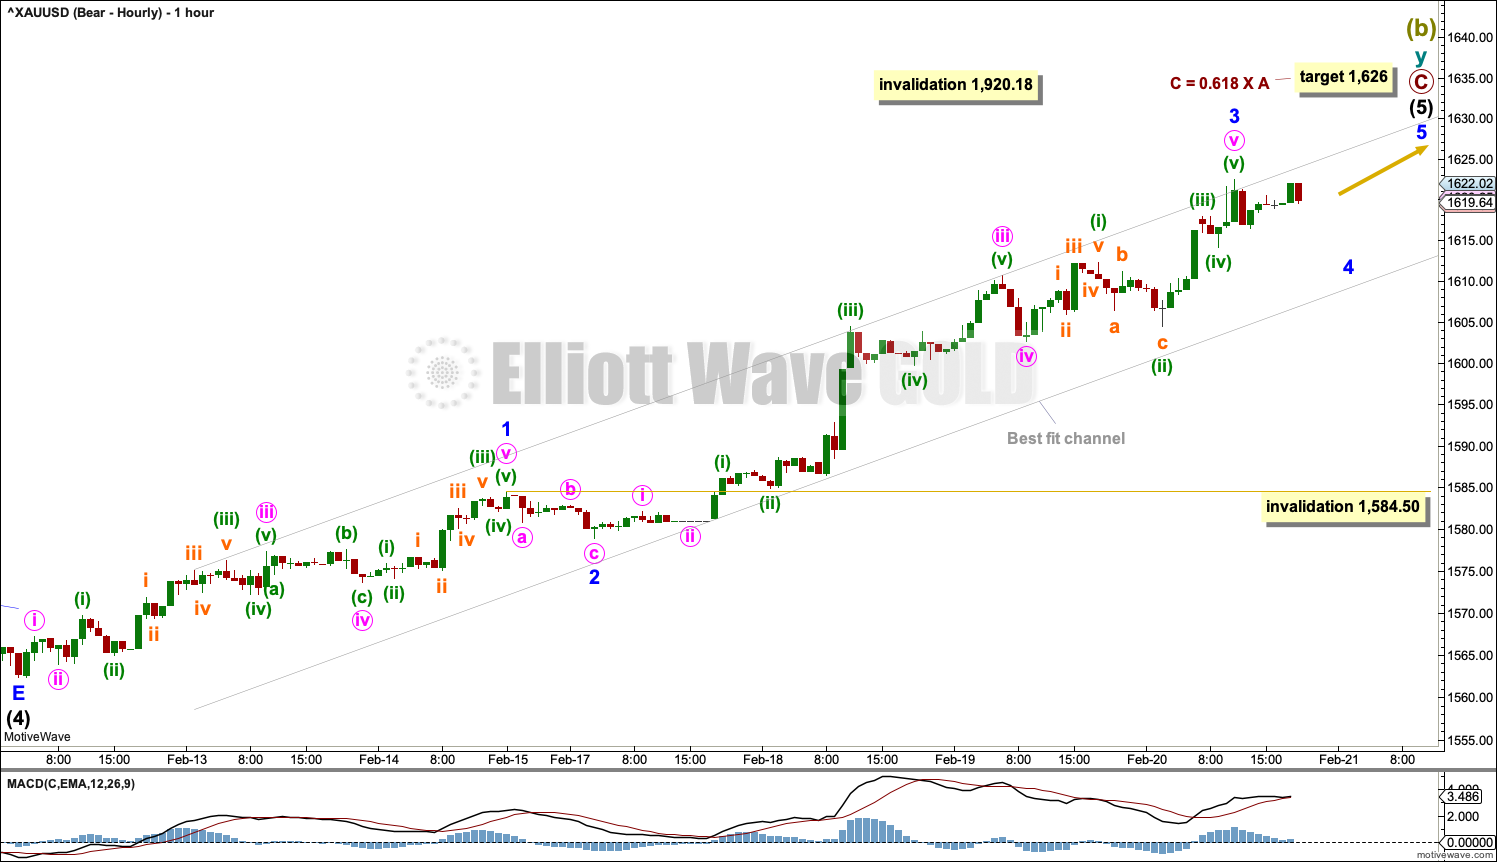
Intermediate wave (5) must subdivide as a five wave structure, most likely an impulse. Within the impulse, so far minor waves 1 through to 3 may be complete.
Minor wave 4 may not move into minor wave 1 price territory below 1,584.50.
Draw a best fit channel about intermediate wave (5). Assume the upwards trend remains in place while price remains within the channel. If price breaks below the lower edge of the channel with downwards movement (not sideways), then that may be an early indication of a trend change.
BULLISH ELLIOTT WAVE COUNT
WEEKLY CHART
Click chart to enlarge.
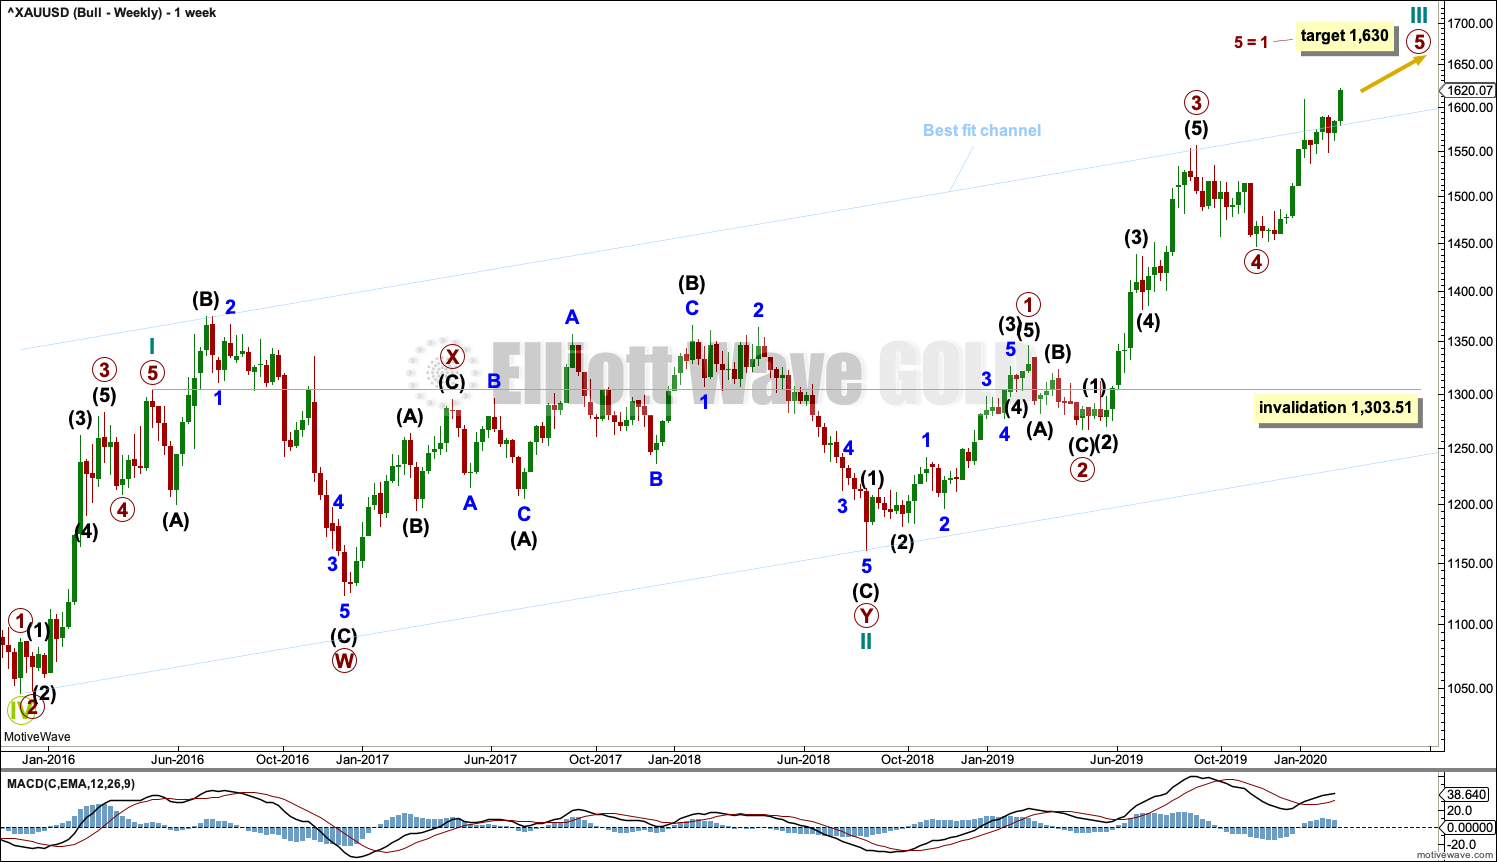
This wave count sees the the bear market complete at the last major low for Gold on 3 December 2015.
If Gold is in a new bull market, then it should begin with a five wave structure upwards on the weekly chart.
The structure of cycle waves I and II are relabelled.
Cycle wave I now fits better as a five wave impulse with reasonably proportionate corrections for primary waves 2 and 4. This resolves a previous major problem with the bullish wave count.
Cycle wave II now fits as a double flat. However, a new problem arises with the relabelling of this structure. Within the first flat correction labelled primary wave W, this wave count now needs to ignore what looks like an obvious triangle from July to September 2016 (this can be seen labelled as a triangle on the bear wave count above). This movement must now be labelled as a series of overlapping first and second waves.
Cycle wave III may be incomplete. A target is calculated based upon the most common Fibonacci ratio for primary wave 5 within the impulse of cycle wave III.
Add the wide best fit channel to weekly and daily charts.
DAILY CHART
Click chart to enlarge.
Cycle wave III may be an incomplete impulse. Within the impulse, primary waves 1 through to 4 may be complete and primary wave 5 may be an incomplete impulse.
Within primary wave 5, intermediate waves (1) through to (4) may be incomplete. Within intermediate wave (5), minor wave 4 may not move into minor wave 1 price territory below 1,584.50.
HOURLY CHART

Click chart to enlarge.
Today hourly charts are labelled in the same way. Targets are slightly different.
TECHNICAL ANALYSIS
WEEKLY CHART
Click chart to enlarge. Chart courtesy of StockCharts.com.
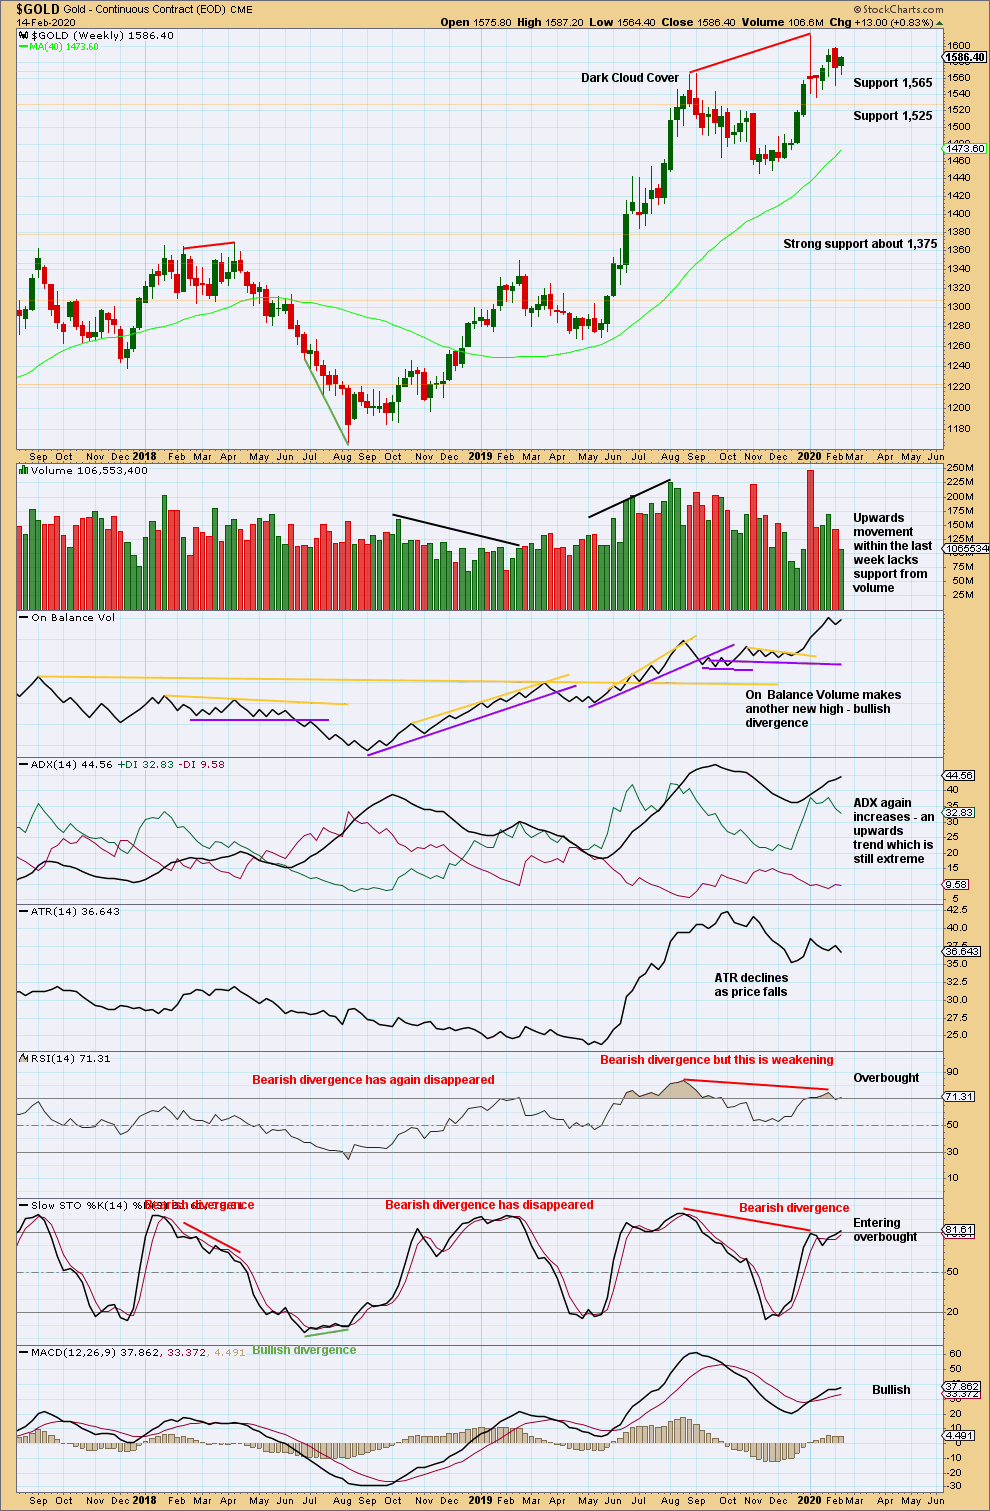
Bullish divergence between price and On Balance Volume is contradicted by bearish divergence between price and RSI. More weight may be given to RSI as this tends to be slightly more reliable, particularly after it has reached extreme. This would support the main bearish wave count.
The upwards trend reached extreme and RSI reached overbought. After reaching overbought, RSI then exhibited bearish divergence. This set up is often (not always) seen at major trend changes.
A small range inside week closes green. The lack of support last week for upwards movement supports the main Elliott wave count.
DAILY CHART
Click chart to enlarge. Chart courtesy of StockCharts.com.
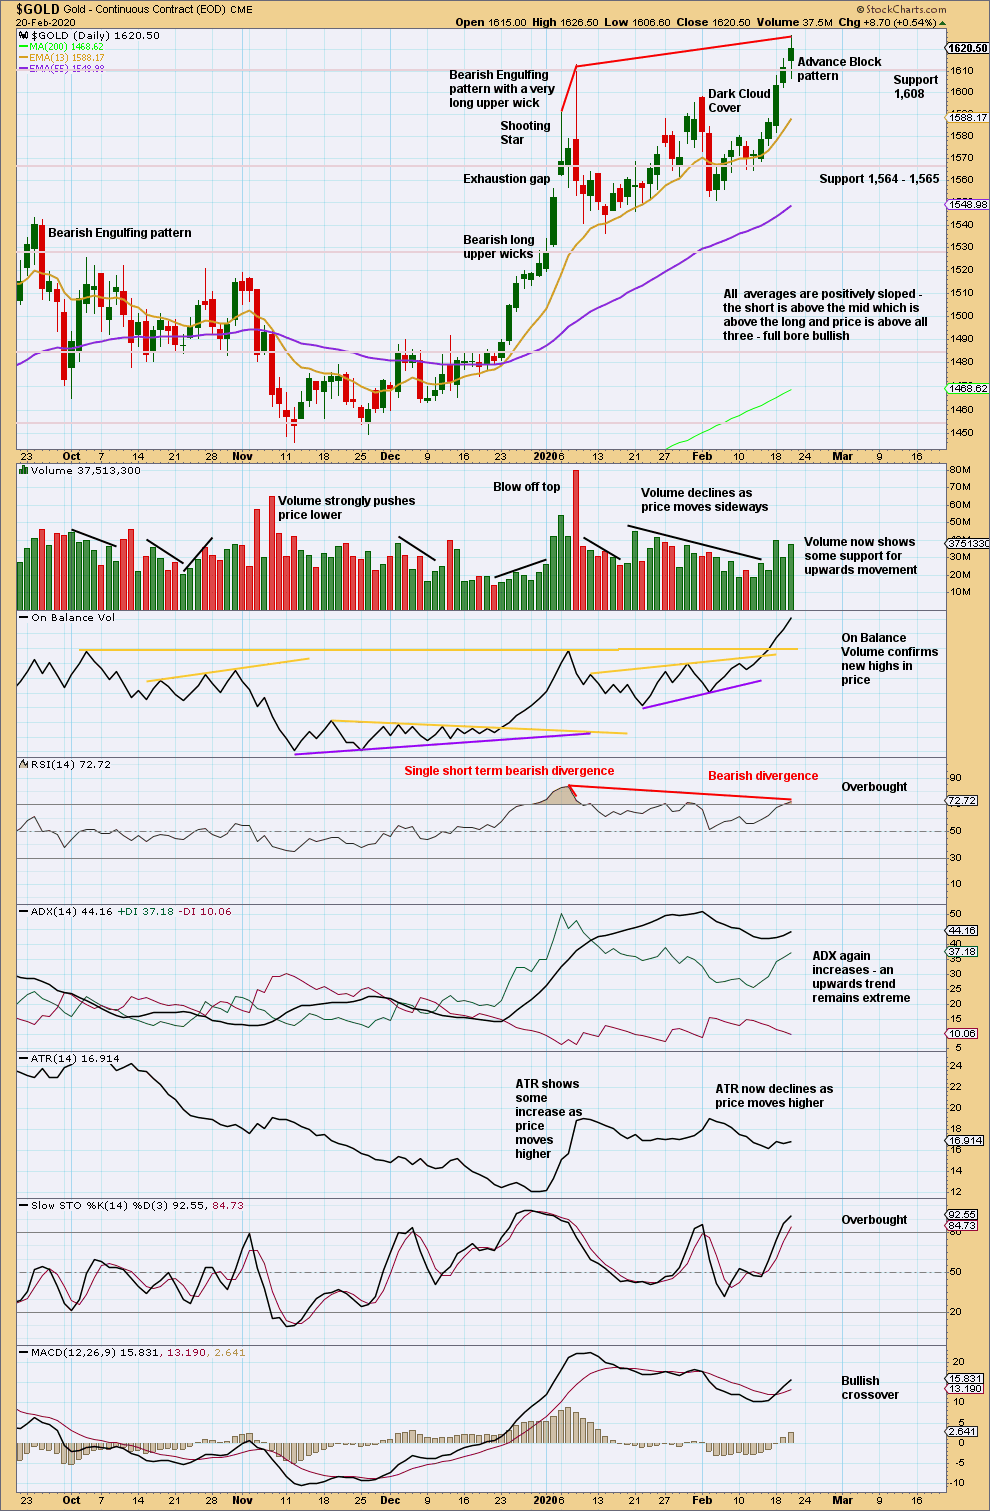
Conditions remain extreme: ADX is above both directional lines, RSI is very close again to overbought and exhibits strong bearish divergence, and Stochastics is entering overbought. Upwards movement here may be limited, but for now an upwards trend is in place.
The last three candlesticks complete an Advance Block pattern. From Steve Nison, Japanese Candlestick Charting Techniques (p. 99):
“If the second and third or just the third candle shows signs of weakening, it is an advance block pattern. This means the rally is running into trouble and longs should protect themselves. Be especially cautious about this pattern during a mature uptrend. Signs of weakening could be progressively smaller white real bodies or relatively long upper shadows.
Although the advance block and stalled patterns are not normally top reversal patterns, they can sometimes precede a price decline. The advance block and stalled patterns should be used to liquidate or protect longs, but usually not to short. They are generally more consequential at higher price levels.”
GDX WEEKLY CHART
Click chart to enlarge. Chart courtesy of StockCharts.com.
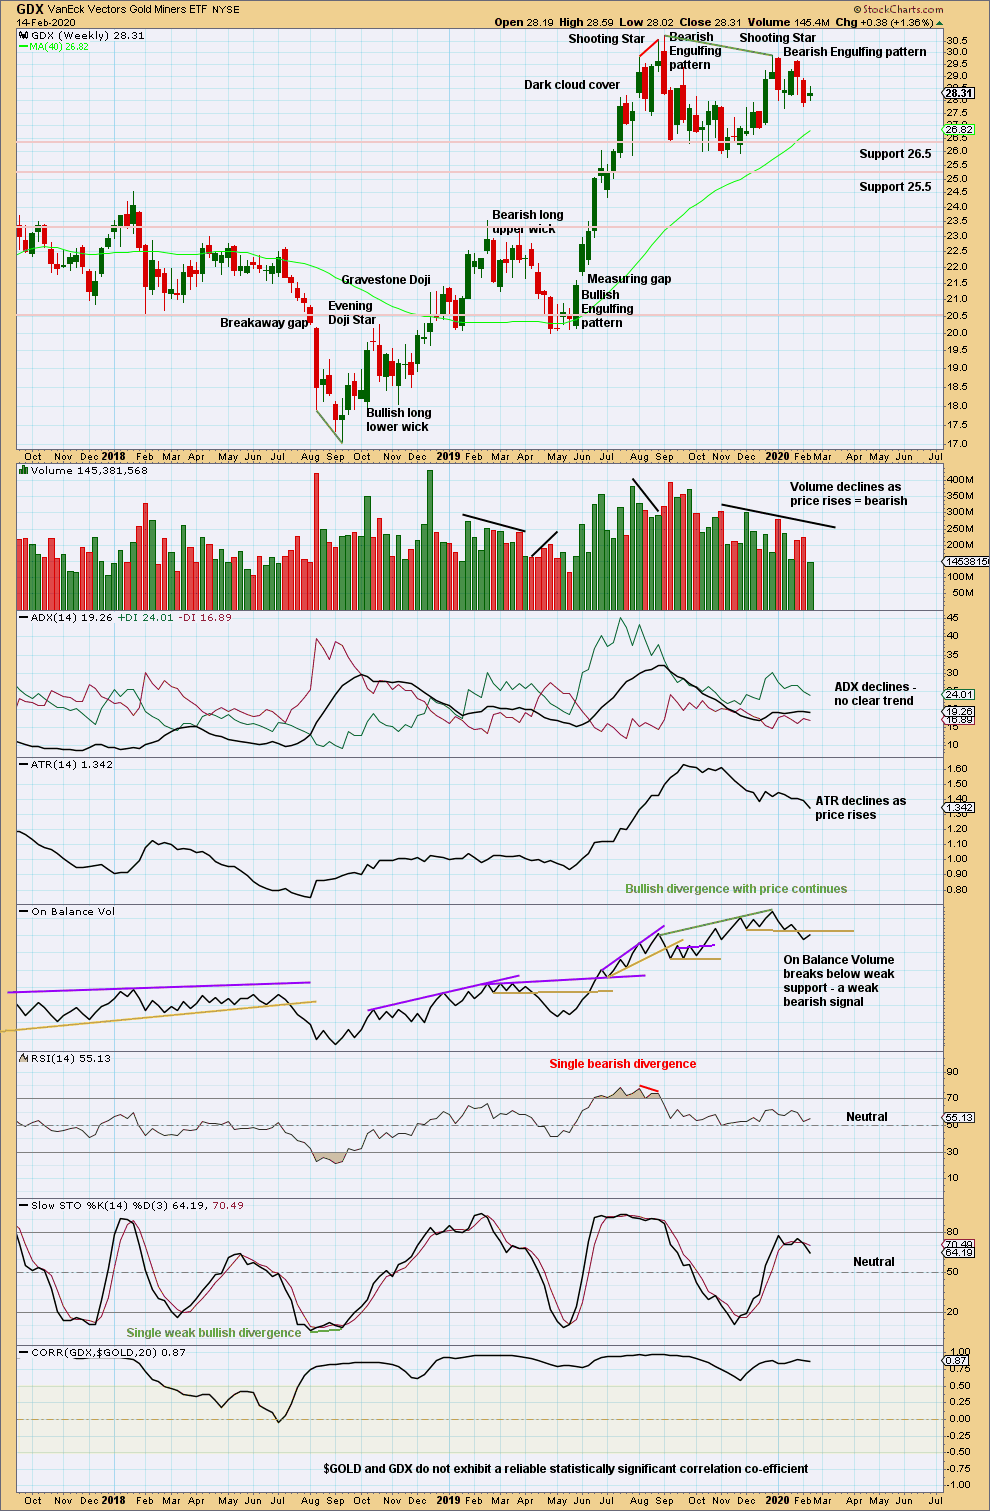
Now two bearish candlestick patterns in a row, the second with support from volume, strongly suggest a trend change here to either down or sideways. The last Bearish Engulfing candlestick pattern has support from volume.
Volume and ATR are both declining as price rises from the last swing low in November 2029. This upwards movement so far has some weakness and looks likely to be a counter trend movement. An inside week that has closed green and has weak volume does not change this view.
GDX DAILY CHART
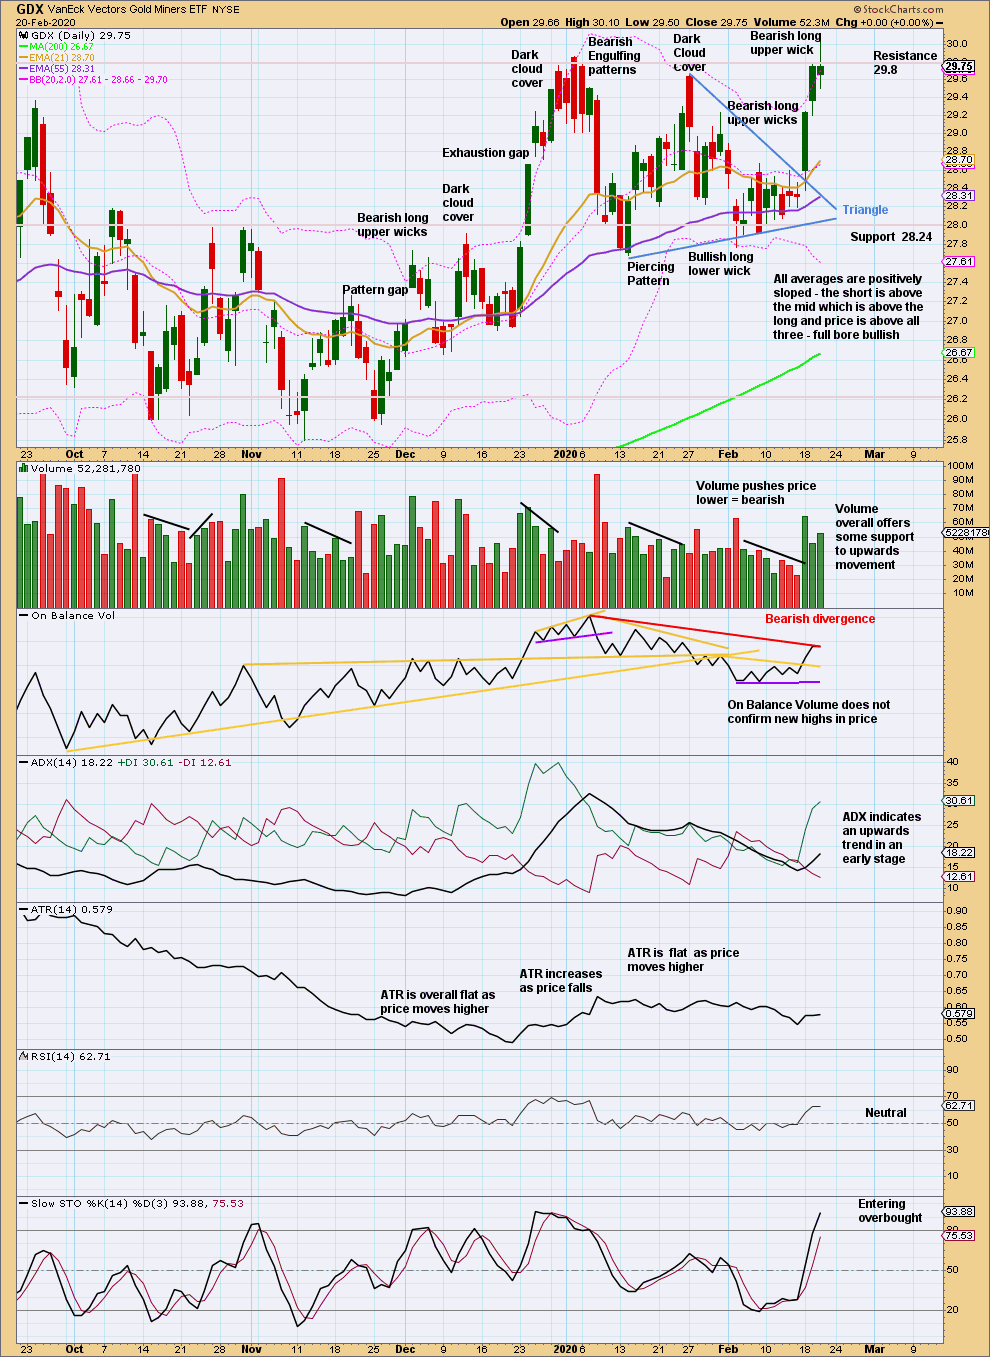
Click chart to enlarge. Chart courtesy of StockCharts.com.
A target calculated from the triangle is at 30.47. This target is nearly met, but with some bearishness today it may not be quite met. The long upper wick and lack of confirmation for new highs by On Balance Volume together give some concern for bulls.
Published @ 07:58 p.m. EST.
—
Careful risk management protects your trading account(s).
Follow my two Golden Rules:
1. Always trade with stops.
2. Risk only 1-5% of equity on any one trade.
—
New updates to this analysis are in bold.
The target is reached and price keeps rising.
A new target is calculated. This would be reasonably close to where primary C would = primary A as well.
It looks like another blow off top is forming. This session will close strongly, so I’ll expect Monday to keep going up.
The trend for now is up, but conditions are very extreme. It will reverse, maybe in another one to two sessions.
Thank you Lara for the updated view. It makes sense for me also when taking some of the fundamentals into account.
Seems pretty bullish. Wonder if there is an extension with a new higher target?
I think this is a blow-off top.
I think so too.
The last one was Jan 3rd to Jan 8th, which is an illustration of how blow off tops can form over not one but a few days.
When looking for a blow off top to be done, look for a candlestick reversal pattern or at least a long upper wick.
Before that, a channel on the hourly chart can be useful too. While price remains within the channel expect price to keep rising. If the channel is breached then look out, the blow off top may be over and then price may fall equally as hard.
Blew through targets. Looks bullish to me.
Ok, so target is met. And not invalidated?
Nothing invalidated. Expect it to go down soon
ok, what could be the catalyst to reverse the current upwards trend? if we should expect gold to go down soon?
Invalidation?
No, it was a target, not invalidation.