GOLD: Elliott Wave and Technical Analysis | Charts – February 21, 2020
Upwards movement continued as expected, although the targets at 1,626 to 1,630 were inadequate.
Summary: New targets are at 1,719 (bear wave count) or 1,834 (bull wave count).
Conditions are now very extreme; a blow off top may continue to form next week. A high may be in place within another one to very few days.
Grand SuperCycle analysis is here.
Monthly charts were last updated here.
BEARISH ELLIOTT WAVE COUNT
WEEKLY CHART
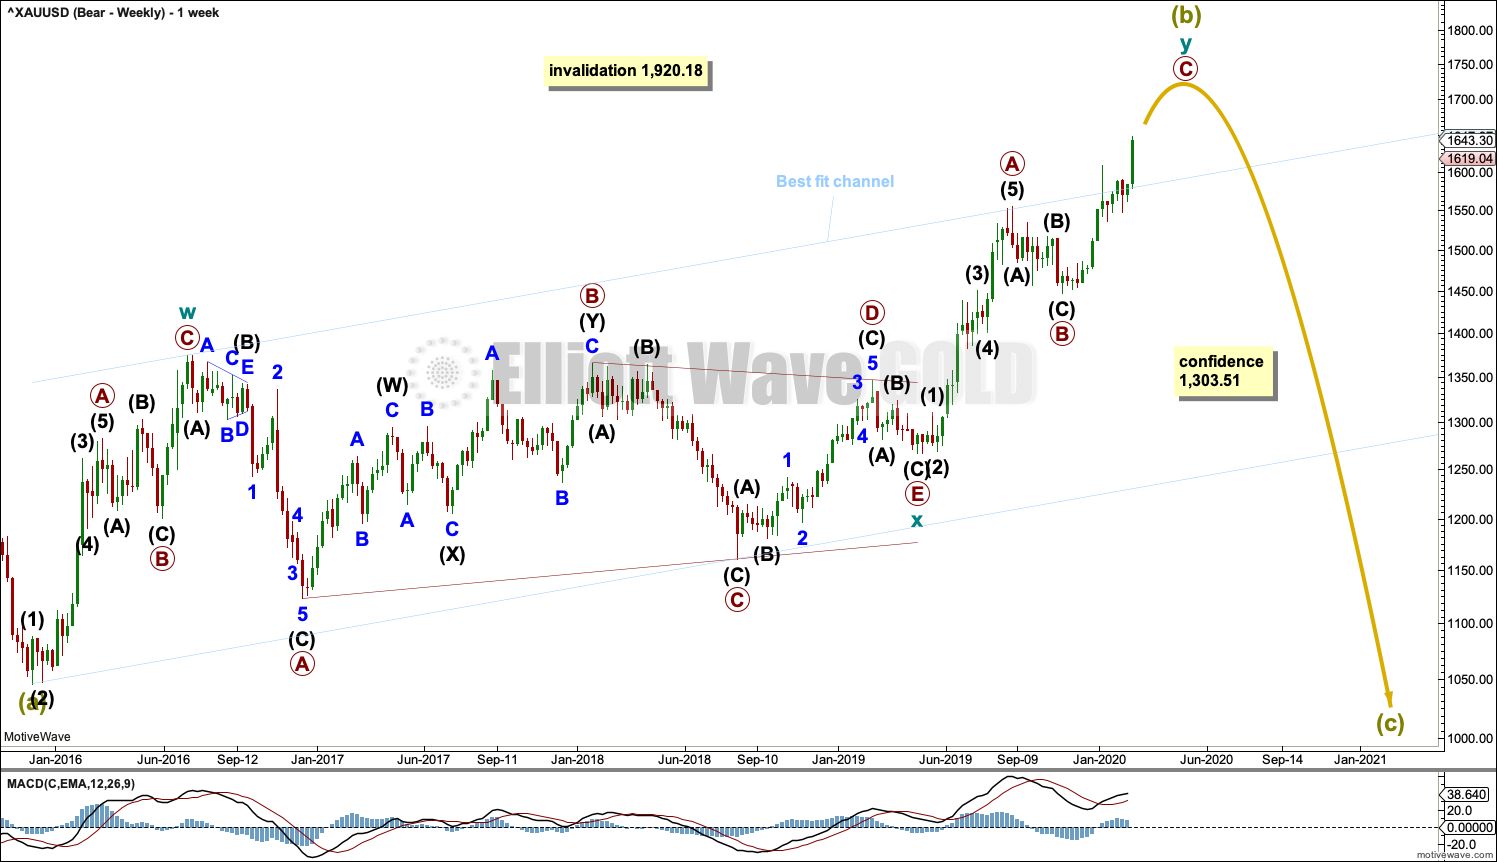
Super Cycle wave (b) may be an incomplete double zigzag.
The first zigzag in the double is labelled cycle wave w. The double is joined by a three in the opposite direction, a triangle labelled cycle wave x. The second zigzag in the double is labelled cycle wave y.
The purpose of the second zigzag in a double is to deepen the correction. Cycle wave y has achieved this purpose.
A wide best fit channel is added in light blue. Copy this channel over to daily charts. Price is now above the upper edge of this channel, which may now provide some support.
DAILY CHART
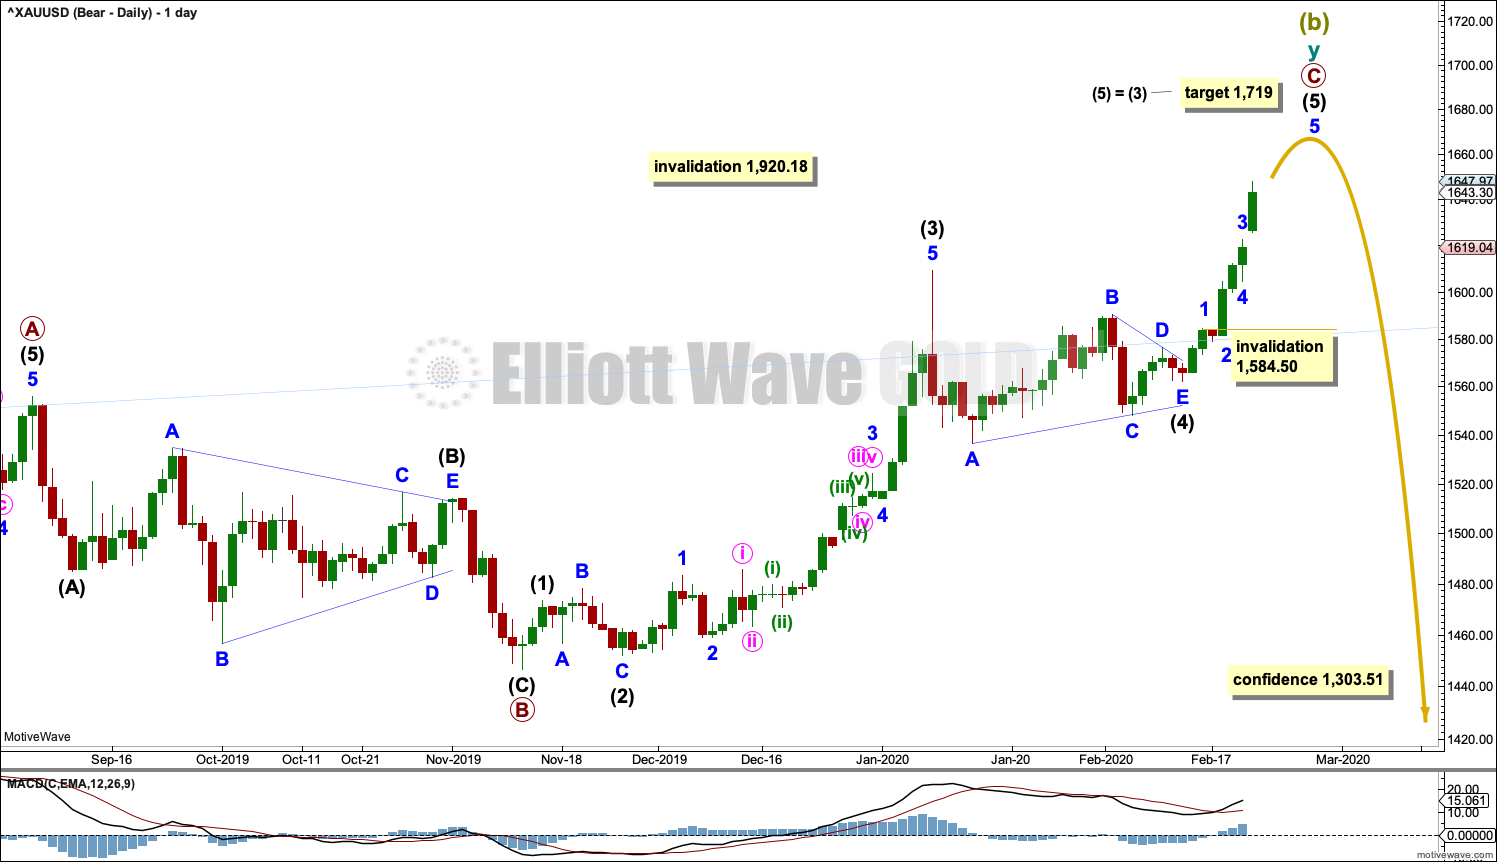
Super Cycle wave (b) may be close to completion. It may end next week.
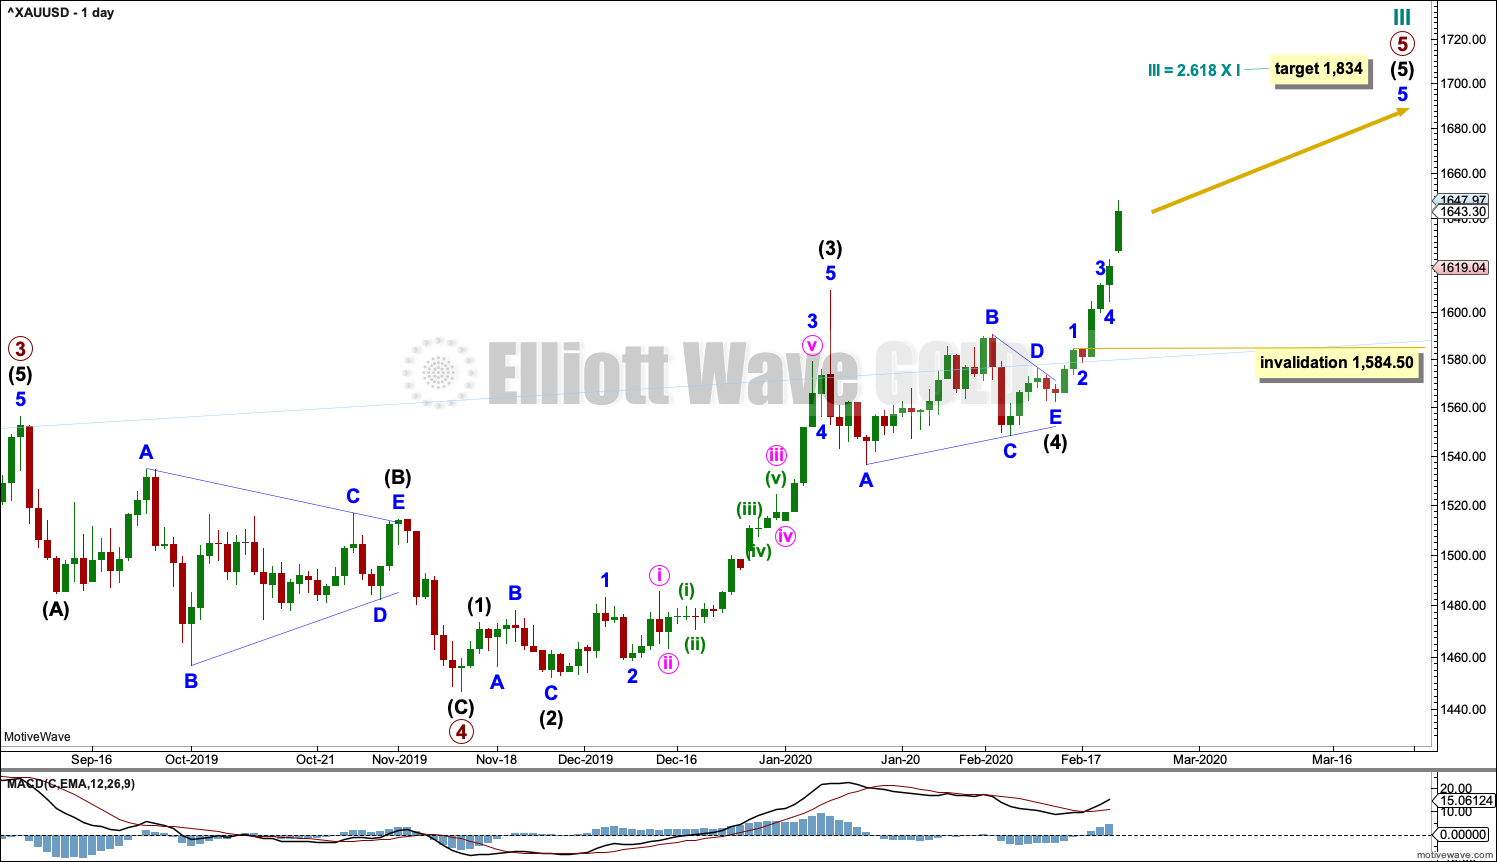
Within the zigzag of cycle wave y, primary waves A and B may be complete and primary wave C must subdivide as a five wave structure. Primary wave C may be an impulse that may now be close to completion.
Within the impulse of primary wave C, intermediate wave (2) subdivides as an expanded flat, which lasted 8 sessions, and intermediate wave (4) may most likely be a triangle that lasted 25 sessions. There is disproportion between these corrections, which is not typical behaviour for this market; but with other wave counts now invalidated, this wave count remains as the sole explanation for recent movement.
A new target is calculated for primary wave C to end.
Within intermediate wave (5), minor wave 4 may not move into minor wave 1 price territory below 1,584.50.
HOURLY CHART
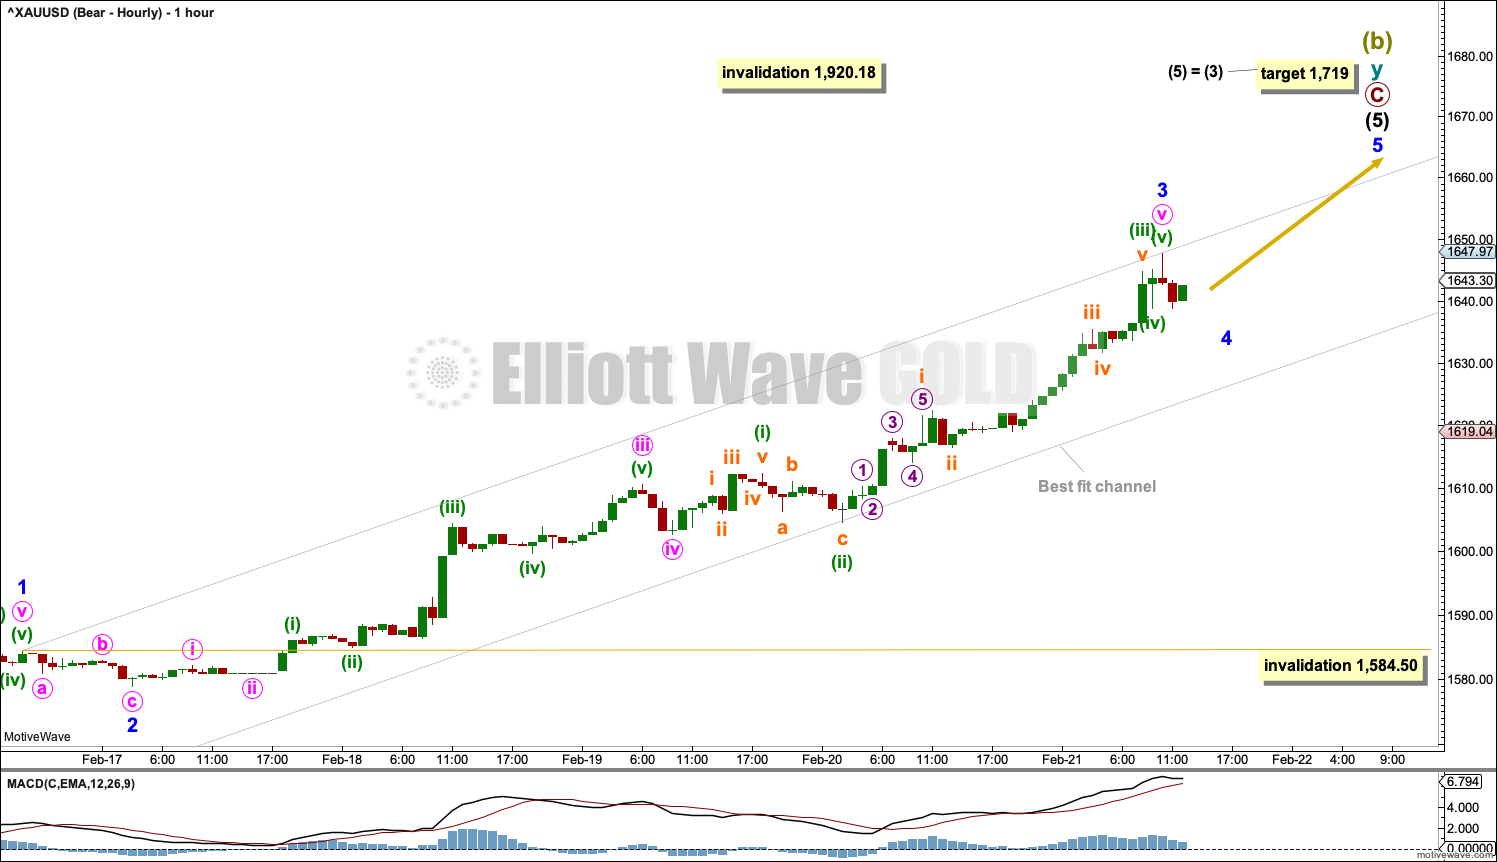
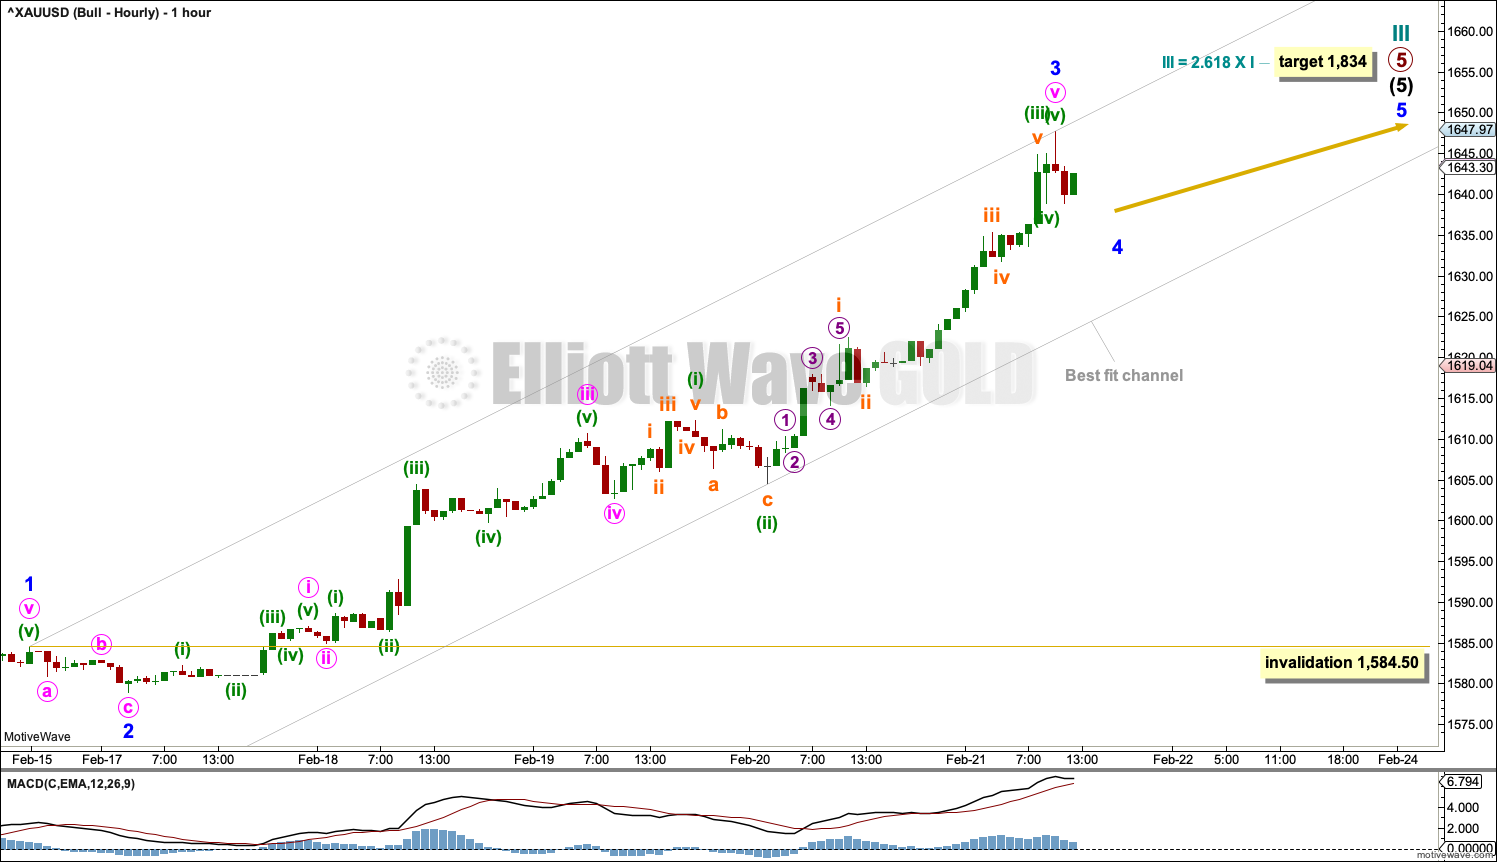
Intermediate wave (5) must subdivide as a five wave structure, most likely an impulse. Within the impulse, so far minor waves 1 through to 3 may be complete.
Minor wave 4 may not move into minor wave 1 price territory below 1,584.50.
Redraw the best fit channel about intermediate wave (5) as shown: draw the first trend line from the ends of minor waves 1 to 3, then pull a parallel copy down to contain all of intermediate wave (5) so far. Assume the upwards trend remains in place while price remains within the channel. If price breaks below the lower edge of the channel with downwards movement (not sideways), then that may be an early indication of a trend change.
BULLISH ELLIOTT WAVE COUNT
WEEKLY CHART
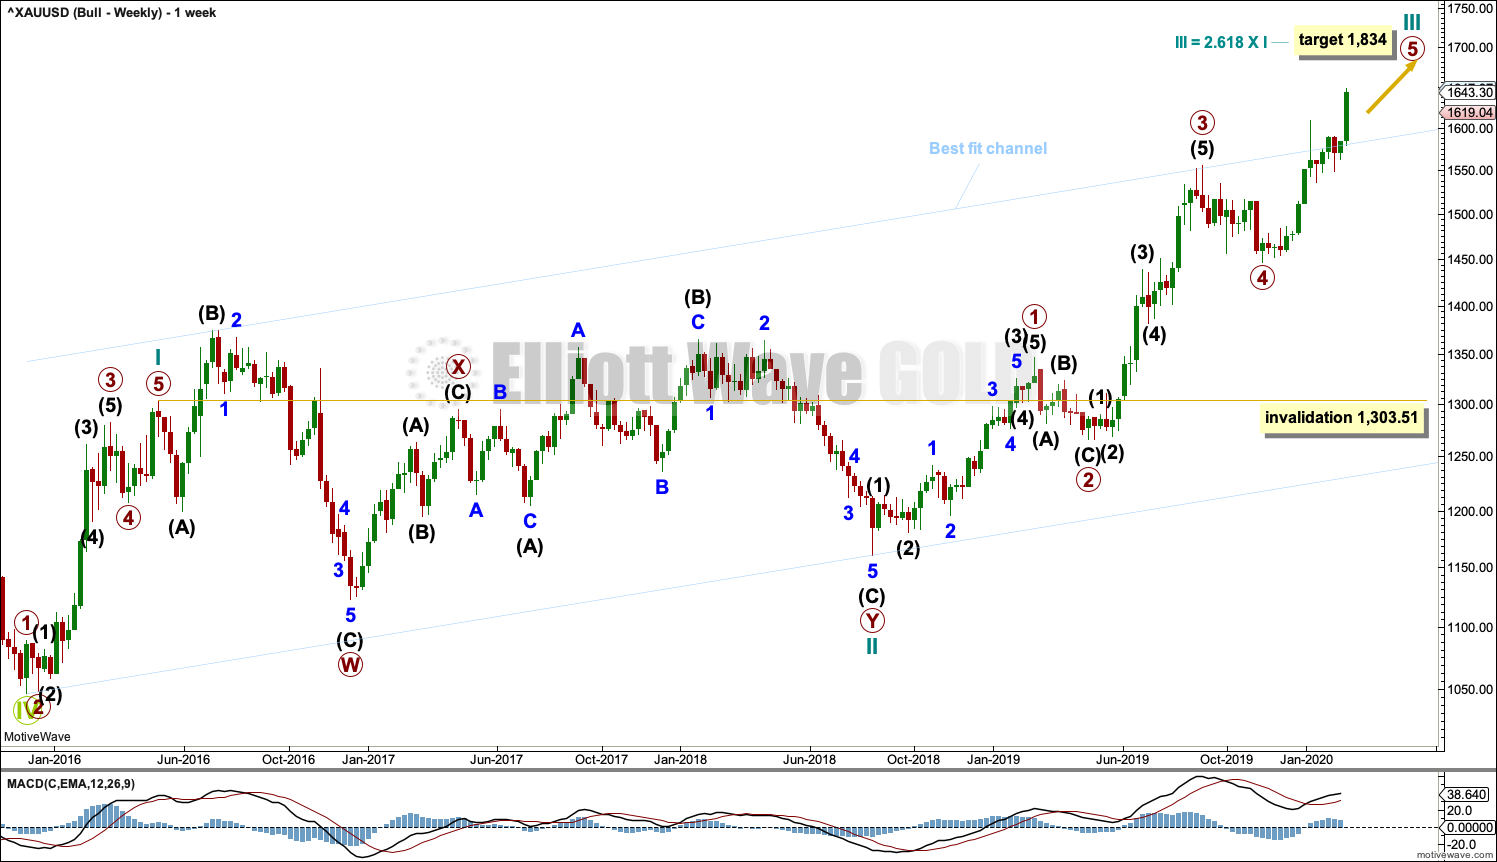
This wave count sees the the bear market complete at the last major low for Gold on 3 December 2015.
If Gold is in a new bull market, then it should begin with a five wave structure upwards on the weekly chart.
Cycle wave I fits as a five wave impulse with reasonably proportionate corrections for primary waves 2 and 4. This resolves a previous major problem with the bullish wave count.
Cycle wave II now fits as a double flat. However, a problem arises with the relabelling of this structure. Within the first flat correction labelled primary wave W, this wave count now needs to ignore what looks like an obvious triangle from July to September 2016 (this can be seen labelled as a triangle on the bear wave count above). This movement must now be labelled as a series of overlapping first and second waves.
Cycle wave III may be incomplete. A target is calculated based upon the most common Fibonacci ratio for primary wave 5 within the impulse of cycle wave III.
Add the wide best fit channel to weekly and daily charts.
DAILY CHART
Cycle wave III may be an incomplete impulse. Within the impulse, primary waves 1 through to 4 may be complete and primary wave 5 may be an incomplete impulse.
Within primary wave 5, intermediate waves (1) through to (4) may be incomplete. Within intermediate wave (5), minor wave 4 may not move into minor wave 1 price territory below 1,584.50.
HOURLY CHART
Hourly charts are labelled in the same way. Targets are different.
TECHNICAL ANALYSIS
WEEKLY CHART
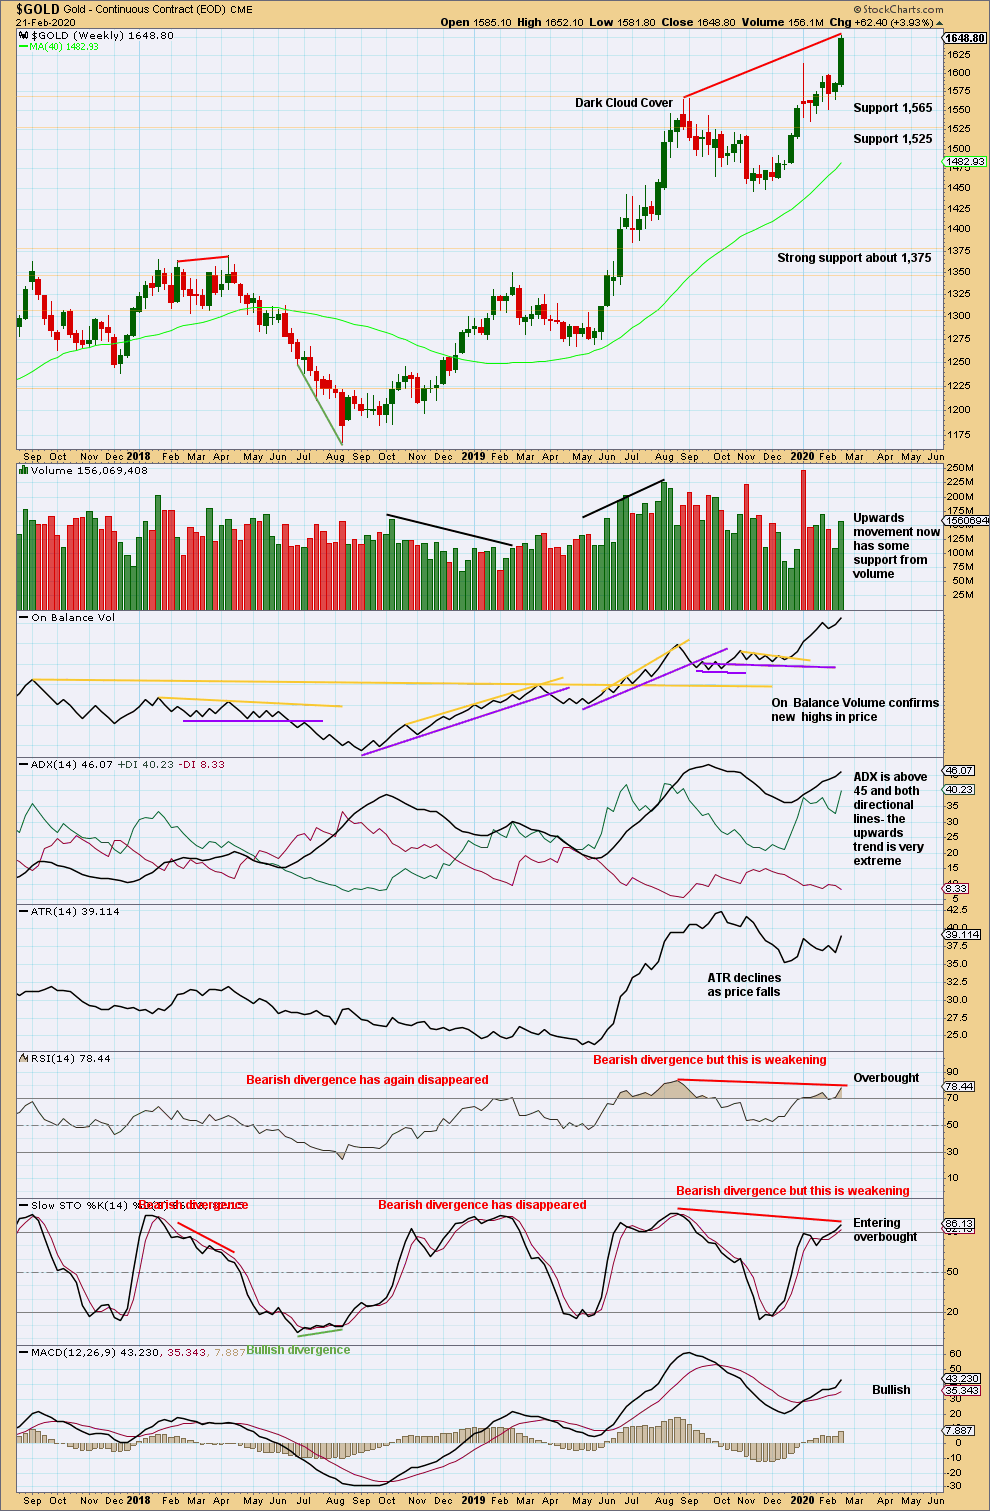
Click chart to enlarge. Chart courtesy of StockCharts.com.
Bullish divergence between price and On Balance Volume has now been followed by upwards movement from price to new highs. This divergence may now be resolved.
The trend is very extreme and RSI is overbought. This trend may be expected to end fairly soon, although extreme conditions can persist for another one to very few weeks.
DAILY CHART
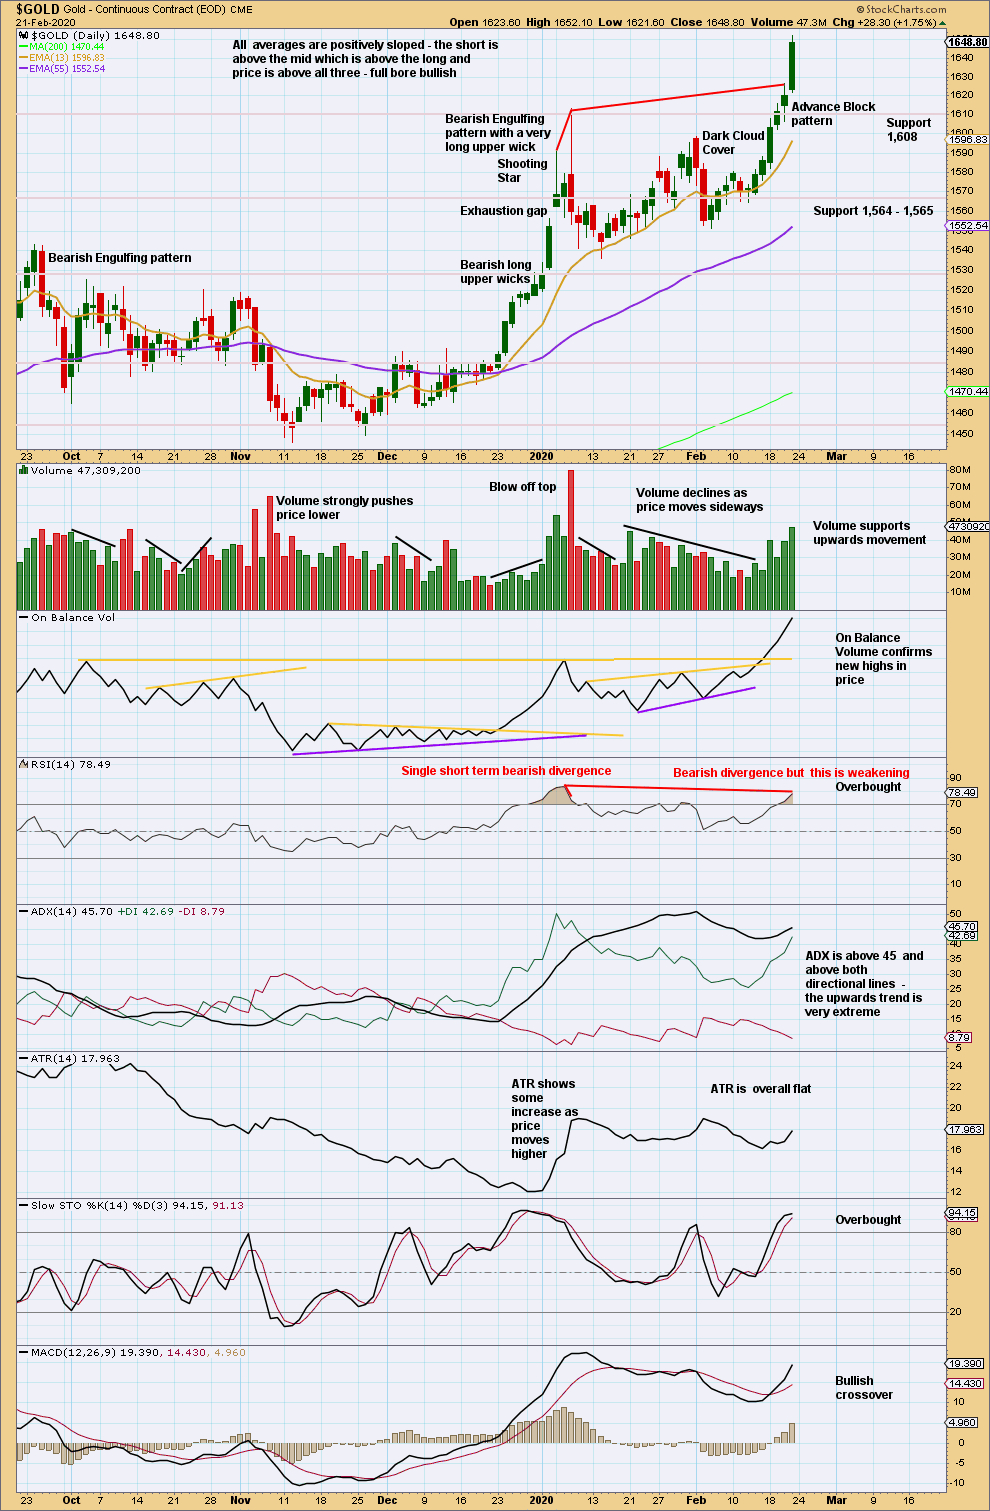
Click chart to enlarge. Chart courtesy of StockCharts.com.
Conditions are very extreme at both weekly and daily time frames. ADX is very extreme. RSI is overbought.
A blow off top may be forming. These can unfold over a few days; they are not necessarily single day events. There is a good example on this chart from 3rd to 8th January 2020.
A strong close on Friday with price near highs for the session and strong ATR indicates more upwards movement as likely on Monday. Look for a candlestick reversal pattern or a long upper wick to signal the end of the blow off top. A small channel on an hourly chart may also be useful as an early indicator of a trend change.
GDX WEEKLY CHART
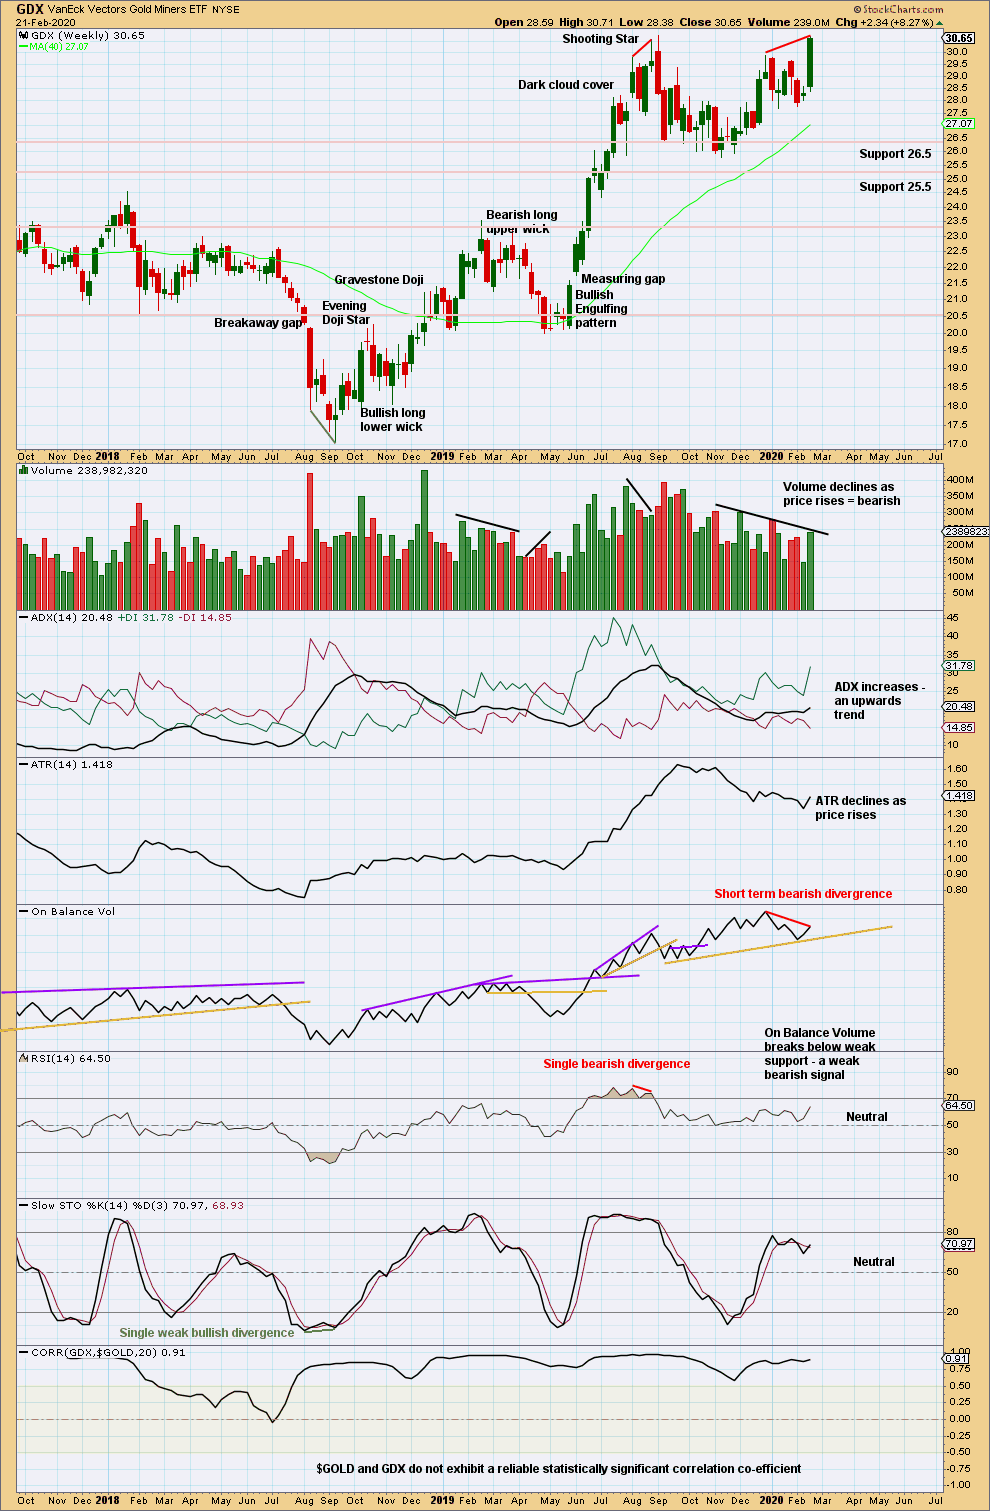
Click chart to enlarge. Chart courtesy of StockCharts.com.
While Gold has made new highs, GDX has not by a very small margin.
The week has closed strongly suggesting more upwards movement next week. Some weakness is evident in bearish divergence with RSI and overall declining volume, although the last week was stronger than the week prior.
GDX DAILY CHART
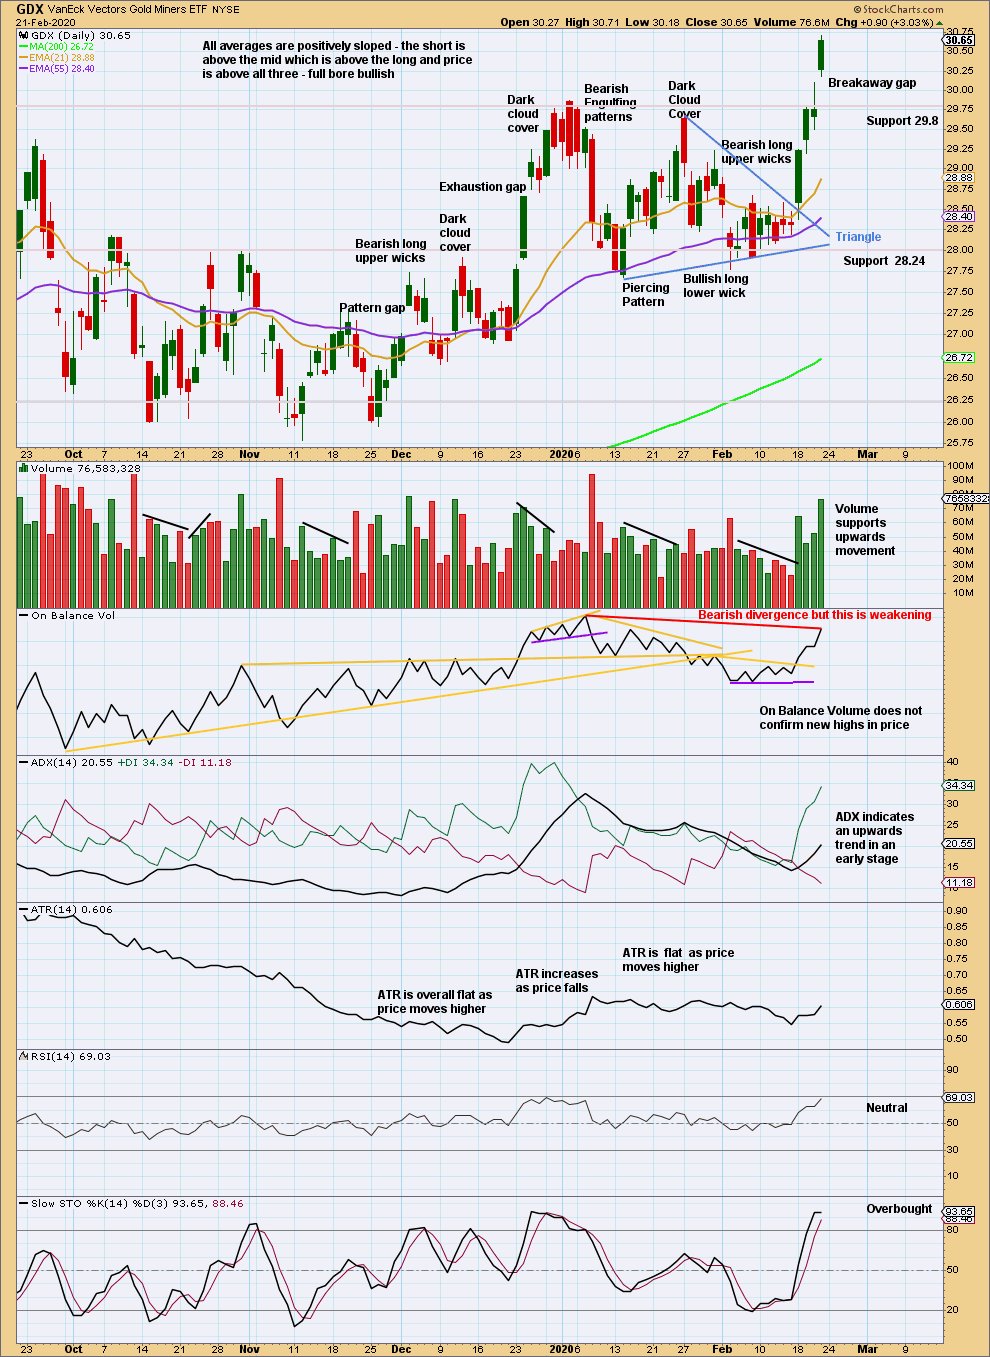
Click chart to enlarge. Chart courtesy of StockCharts.com.
A target calculated from the triangle is at 30.47. The target is met and slightly exceeded.
A breakaway gap may now offer support at 30.10. A target calculated from the gap and using the prior consolidation is at 32.37.
If the breakaway gap is closed with a new low below 30.10, then it may be renamed an exhaustion gap and a trend change may be indicated.
Published @ 10:03 p.m. EST.
—
Careful risk management protects your trading account(s).
Follow my two Golden Rules:
1. Always trade with stops.
2. Risk only 1-5% of equity on any one trade.
—
New updates to this analysis are in bold.

Gold hourly chart updated:
The blow off top continues to form. It may yet last another one or two days…. three at the outmost I expect.
Keep redrawing the channel on the hourly chart as pice continues higher: draw the first trend line from the end of minor 1 to the last high, then pull a parallel copy down to contain all movement. This is a conservative channel. If it is breached then expect the blow off top is over and a sharp reversal has begun.
While price remains within the channel expect price to keep going up.
In this way we shall have early indication of a change. Any members trading this to the upside please be aware a sharp reversal is likely to come soon and protect your accounts with good risk management.
Hi Lara,
Thanks for the Update – just in time for the selloff 🙂 Quick reversal.
Was that the blow-off top?
https://www.zerohedge.com/commodities/gold-suddenly-hammered-multi-billion-dollar-sale
The same is happening with silver.. up more than 2% At 18.94s and then a sharp reversal to 0.3% now testing support at 18.50’s – crazyness. 🙂
What’s next?
Does anybody know what the Bank of International Settlement is?
GDX outlook
https://www.tradingview.com/x/0BcppTJJ/
Bearish then ?
Very likely
Thank you.
I guess it only needs China to start dumping it’s gold – unlikely I know – but not if it see’s gold as old hat, and crypto as the new gold – and we have the gold crash and BTC rally.
On this Gold forum members are very bullish for Gold/silver.
https://goldtadise.com/
I would offer this as an alternative but simpler count, where Primary and Intermediate points look more straightforward/defined and do not rely on triangles etc…Basic structure is the same as Lara’s revised main count though.
Hey Nick, I don’t see how your labeling of Primary A meets Elliott Wave rules?
It could be a leading contracting diagonal, but (1) ends with a substantial truncation which reduces probability.