
GOLD: Elliott Wave and Technical Analysis | Charts – February 27, 2020
A small range upwards Doji for Gold sees the Elliott wave count for Gold unchanged today.
GDX had a very strong downwards day, which is a perfect illustration of the lack of correlation between Gold and GDX. Any correlation they may have from time to time may not be reliably assumed to continue.
Summary: Targets for a final high are either 1,693 (bear count) or 1,834 (bull count).
Conditions are now very extreme; a blow off top may possibly be complete today or one final high may yet be required in the next very few days.
Grand SuperCycle analysis is here.
Monthly charts were last updated here.
BEARISH ELLIOTT WAVE COUNT
WEEKLY CHART
Click chart to enlarge.
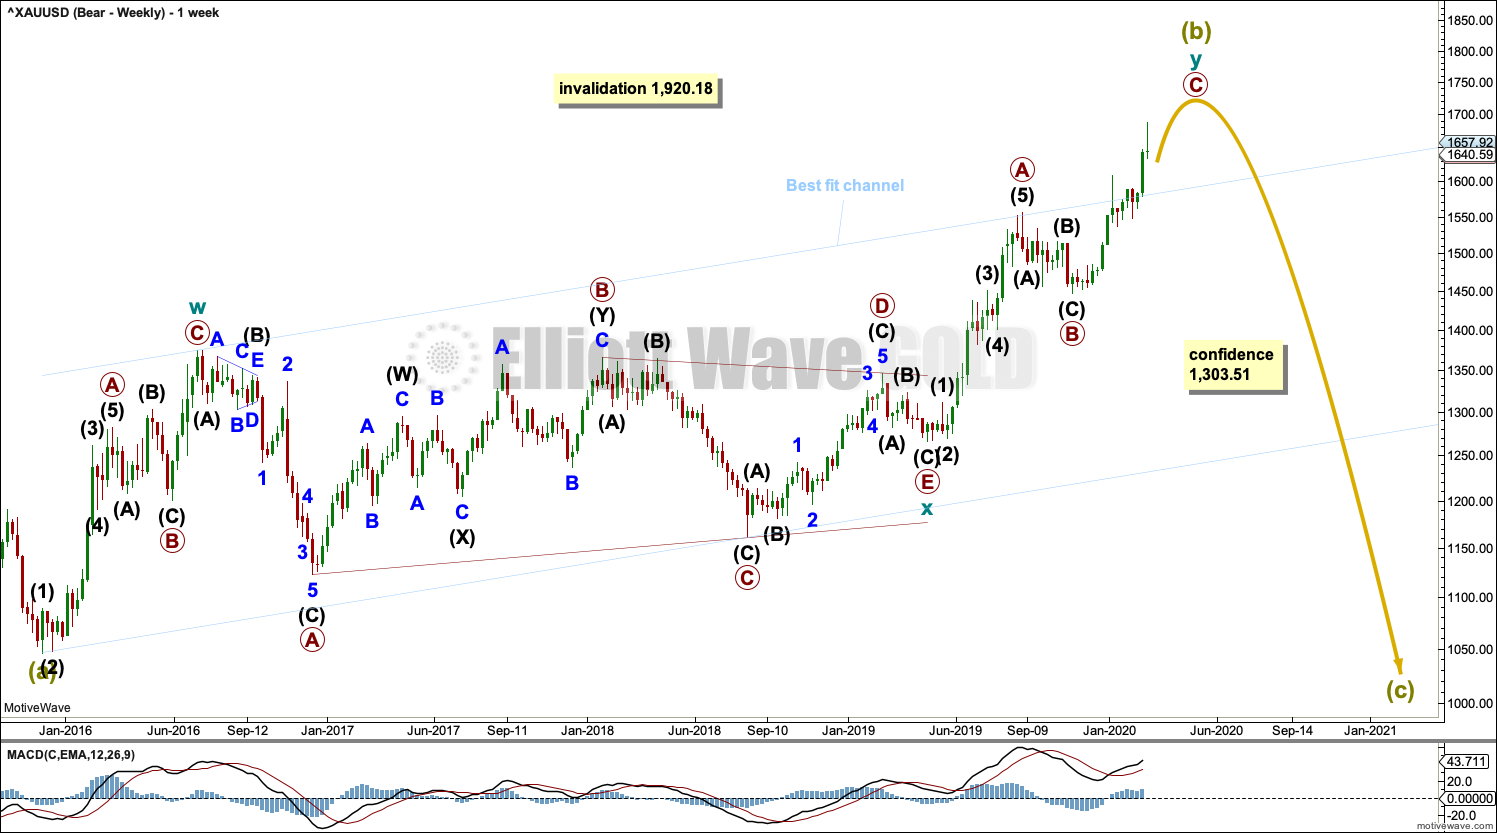
Super Cycle wave (b) may be an incomplete double zigzag.
The first zigzag in the double is labelled cycle wave w. The double is joined by a three in the opposite direction, a triangle labelled cycle wave x. The second zigzag in the double is labelled cycle wave y.
The purpose of the second zigzag in a double is to deepen the correction. Cycle wave y has achieved this purpose.
A wide best fit channel is added in light blue. Copy this channel over to daily charts. Price is now above the upper edge of this channel, which may now provide some support.
DAILY CHART
Click chart to enlarge.
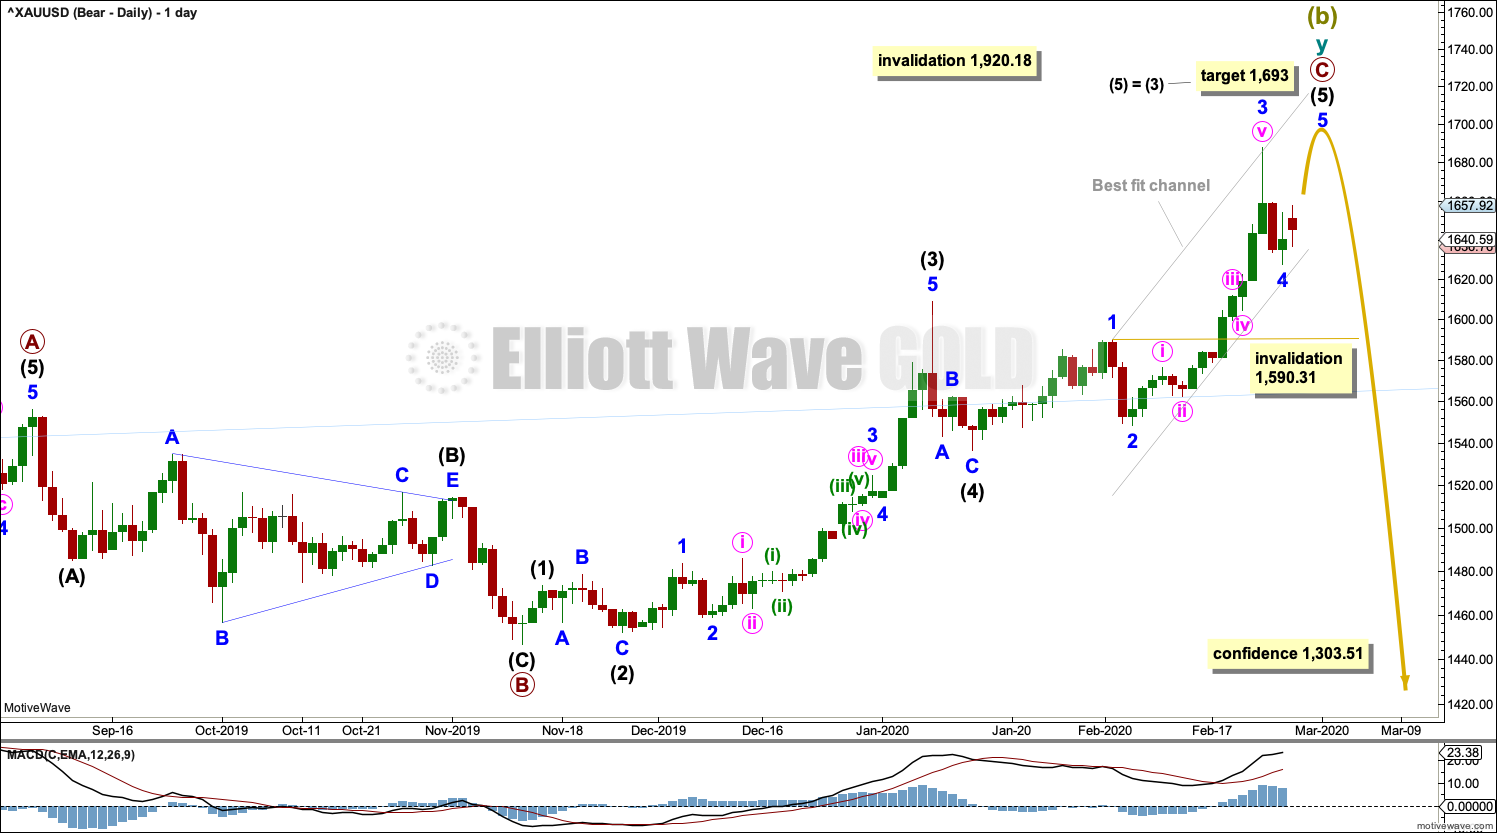
Super Cycle wave (b) may be close to completion. It may end this week.
Within the zigzag of cycle wave y, primary waves A and B may be complete and primary wave C must subdivide as a five wave structure. Primary wave C may be an impulse that may now be close to completion.
Intermediate wave (4) may have subdivided as a zigzag lasting 4 sessions. This has good proportion with the zigzag of intermediate wave (2), which lasted 8 sessions. Intermediate wave (5) may be an incomplete impulse that requires one final high. Within the impulse of intermediate wave (5), minor wave 4 may not move into minor wave 1 price territory below 1,590.31.
A target is calculated for primary wave C to end.
Draw a best fit channel about intermediate wave (5): draw the first trend line from the ends of minor waves 1 to 3, then pull a parallel copy down to contain all of intermediate wave (5) so far. If minor wave 4 continues any lower, then it may find support about the lower edge of this channel. Copy the channel over to the hourly chart.
HOURLY CHART
Click chart to enlarge.
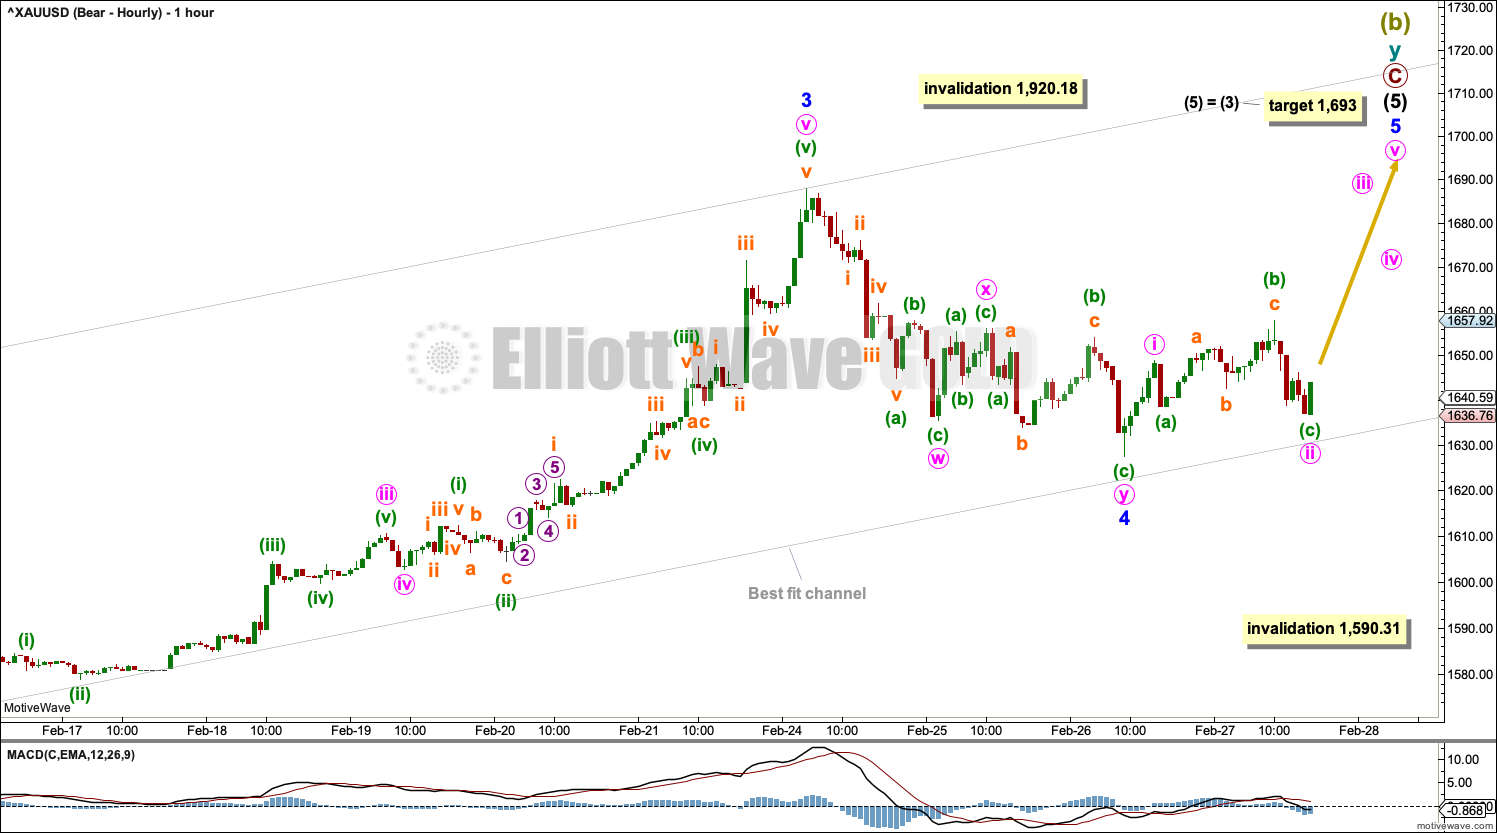
Intermediate wave (5) must subdivide as a five wave structure, most likely an impulse. Within the impulse, so far minor waves 1 through to 4 may be complete.
If it continues any further, then minor wave 4 may not move into minor wave 1 price territory below 1,590.31.
Minor wave 5 must subdivide as a five wave motive structure, either an impulse or an ending diagonal. Minor wave 5 would be very likely to make at least a slight new high above the end of minor wave 3 at 1,687.92 to avoid a truncation.
BULLISH ELLIOTT WAVE COUNT
WEEKLY CHART
Click chart to enlarge.
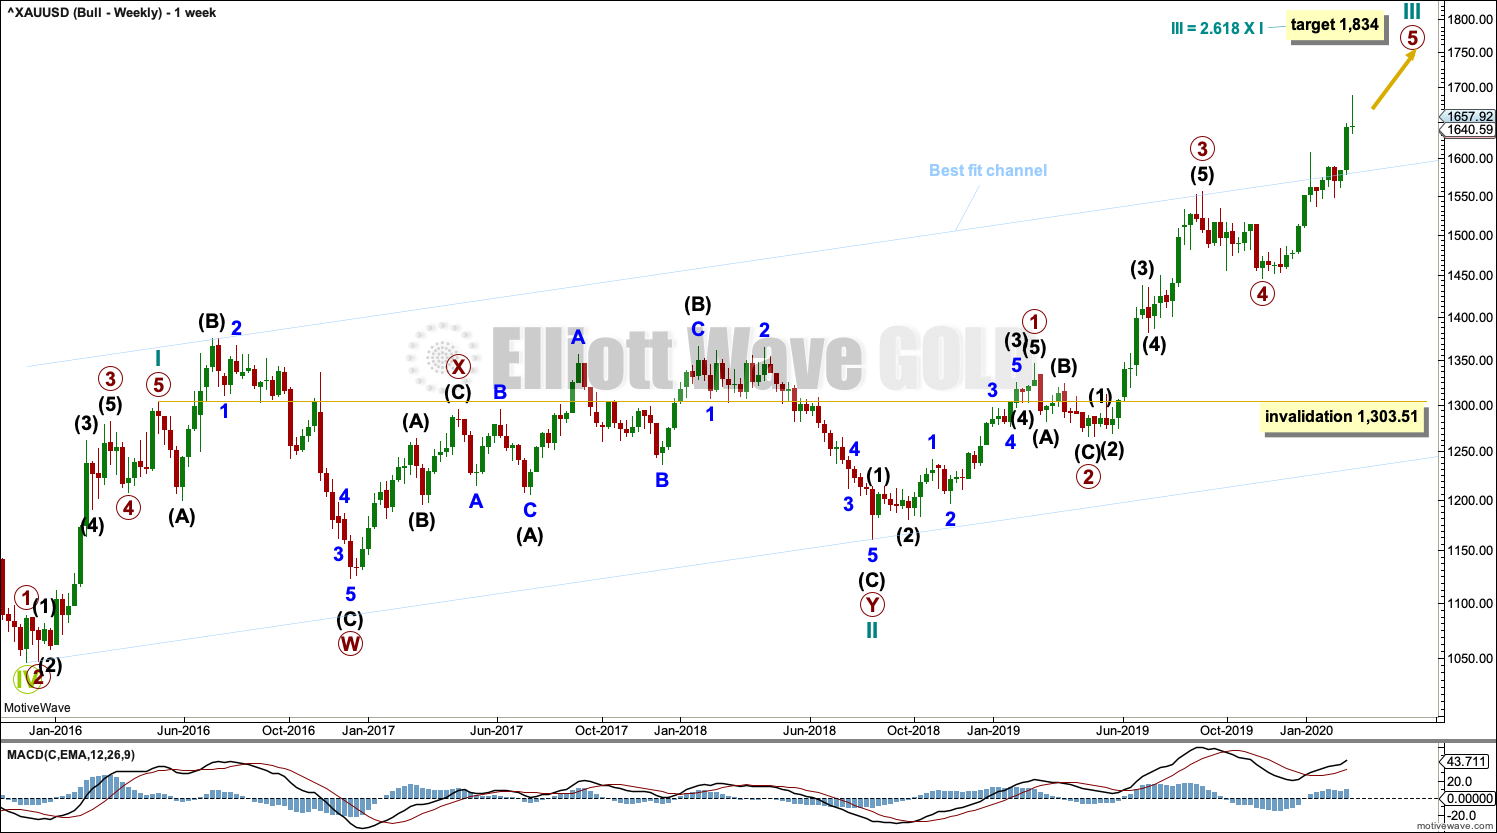
This wave count sees the the bear market complete at the last major low for Gold on 3 December 2015.
If Gold is in a new bull market, then it should begin with a five wave structure upwards on the weekly chart.
Cycle wave I fits as a five wave impulse with reasonably proportionate corrections for primary waves 2 and 4. This resolves a previous major problem with the bullish wave count.
Cycle wave II now fits as a double flat. However, a problem arises with the relabelling of this structure. Within the first flat correction labelled primary wave W, this wave count now needs to ignore what looks like an obvious triangle from July to September 2016 (this can be seen labelled as a triangle on the bear wave count above). This movement must now be labelled as a series of overlapping first and second waves.
Within the first flat correction labelled primary wave W of the double flat of cycle wave II, intermediate wave (B) is 1.69 the length of intermediate wave (A). This is longer than the common range of up to 1.38, but within an allowable guideline of up to 2. The length of intermediate wave (B) reduces the probability of this wave count.
Cycle wave III may be incomplete. A target is calculated based upon a common Fibonacci ratio for cycle wave III to cycle wave I.
Add the wide best fit channel to weekly and daily charts.
DAILY CHART
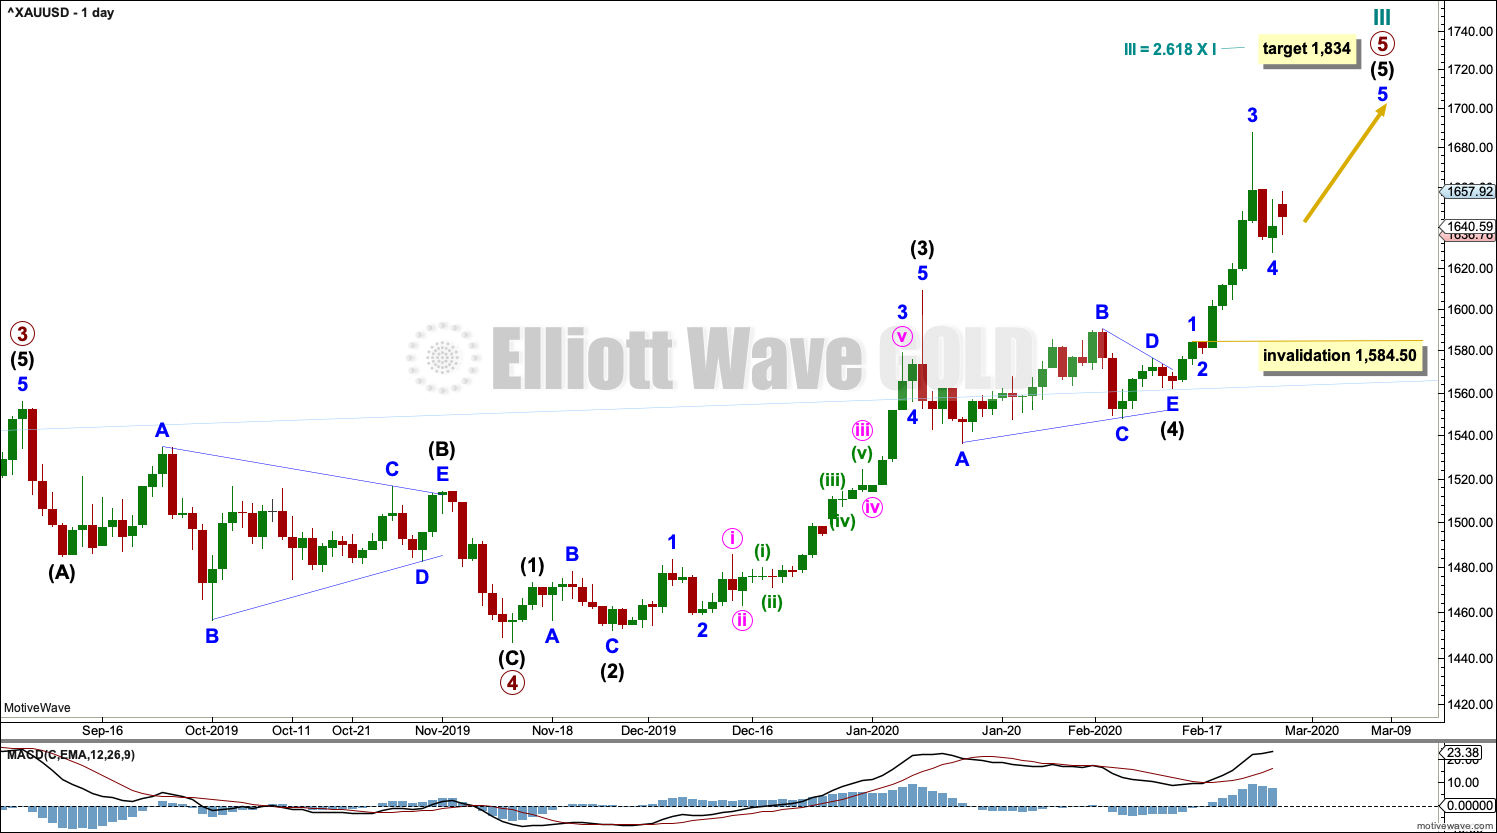
Click chart to enlarge.
Cycle wave III may be an incomplete impulse. Within the impulse, primary waves 1 through to 4 may be complete and primary wave 5 may be an incomplete impulse.
This bullish wave count considers the possibility that intermediate wave (4) was a triangle. This labelling would also still work for the bearish wave count.
Within primary wave 5, intermediate waves (1) through to (4) may be incomplete. Within intermediate wave (5), minor wave 4 may not move into minor wave 1 price territory below 1,584.50.
HOURLY CHART
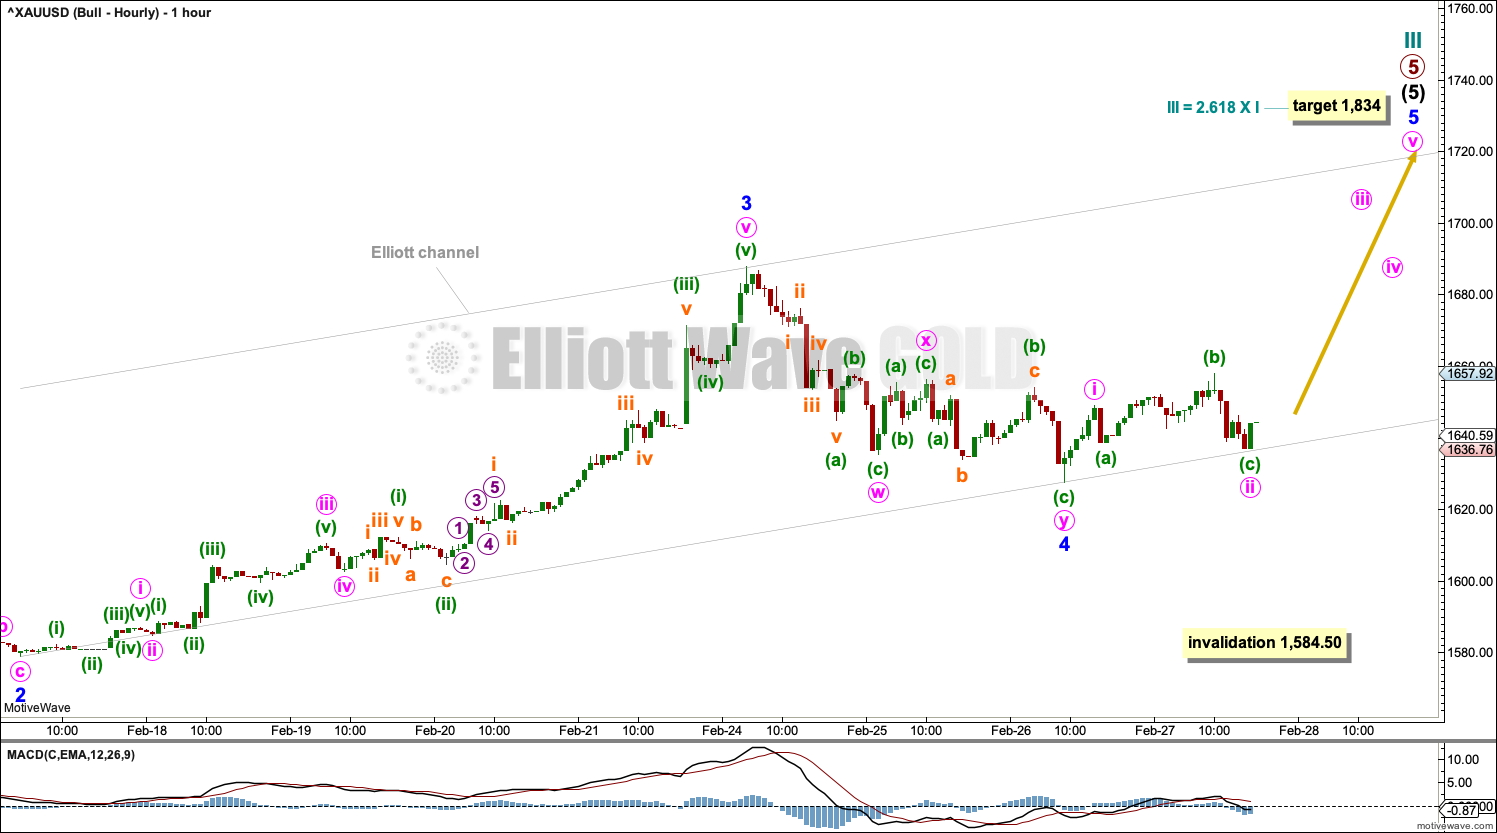
Click chart to enlarge.
Hourly charts are labelled differently to look at intermediate wave (5) in two different ways.
Redraw a channel about intermediate wave (5) using Elliott’s second technique: draw the first trend line from the ends of minor waves 2 to 4, then place a parallel copy on the end of minor wave 3. Minor wave 5 may end about the upper edge of this channel.
TECHNICAL ANALYSIS
WEEKLY CHART
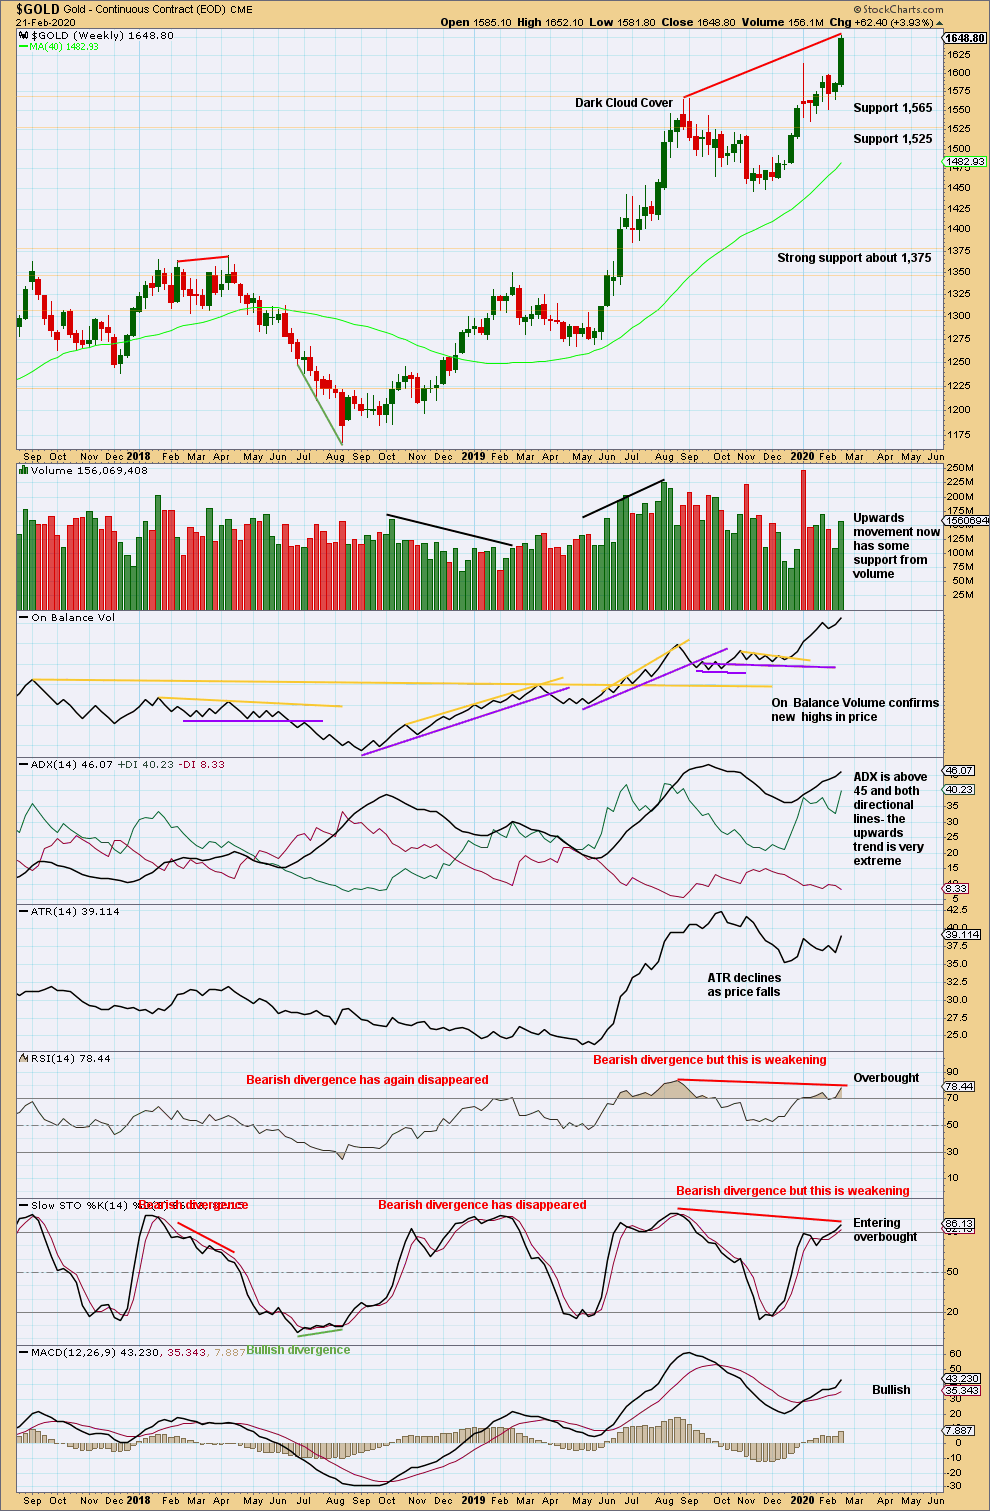
Click chart to enlarge. Chart courtesy of StockCharts.com.
Bullish divergence between price and On Balance Volume has now been followed by upwards movement from price to new highs. This divergence may now be resolved.
The trend is very extreme and RSI is overbought. This trend may be expected to end fairly soon, although extreme conditions can persist for another one to very few weeks.
DAILY CHART
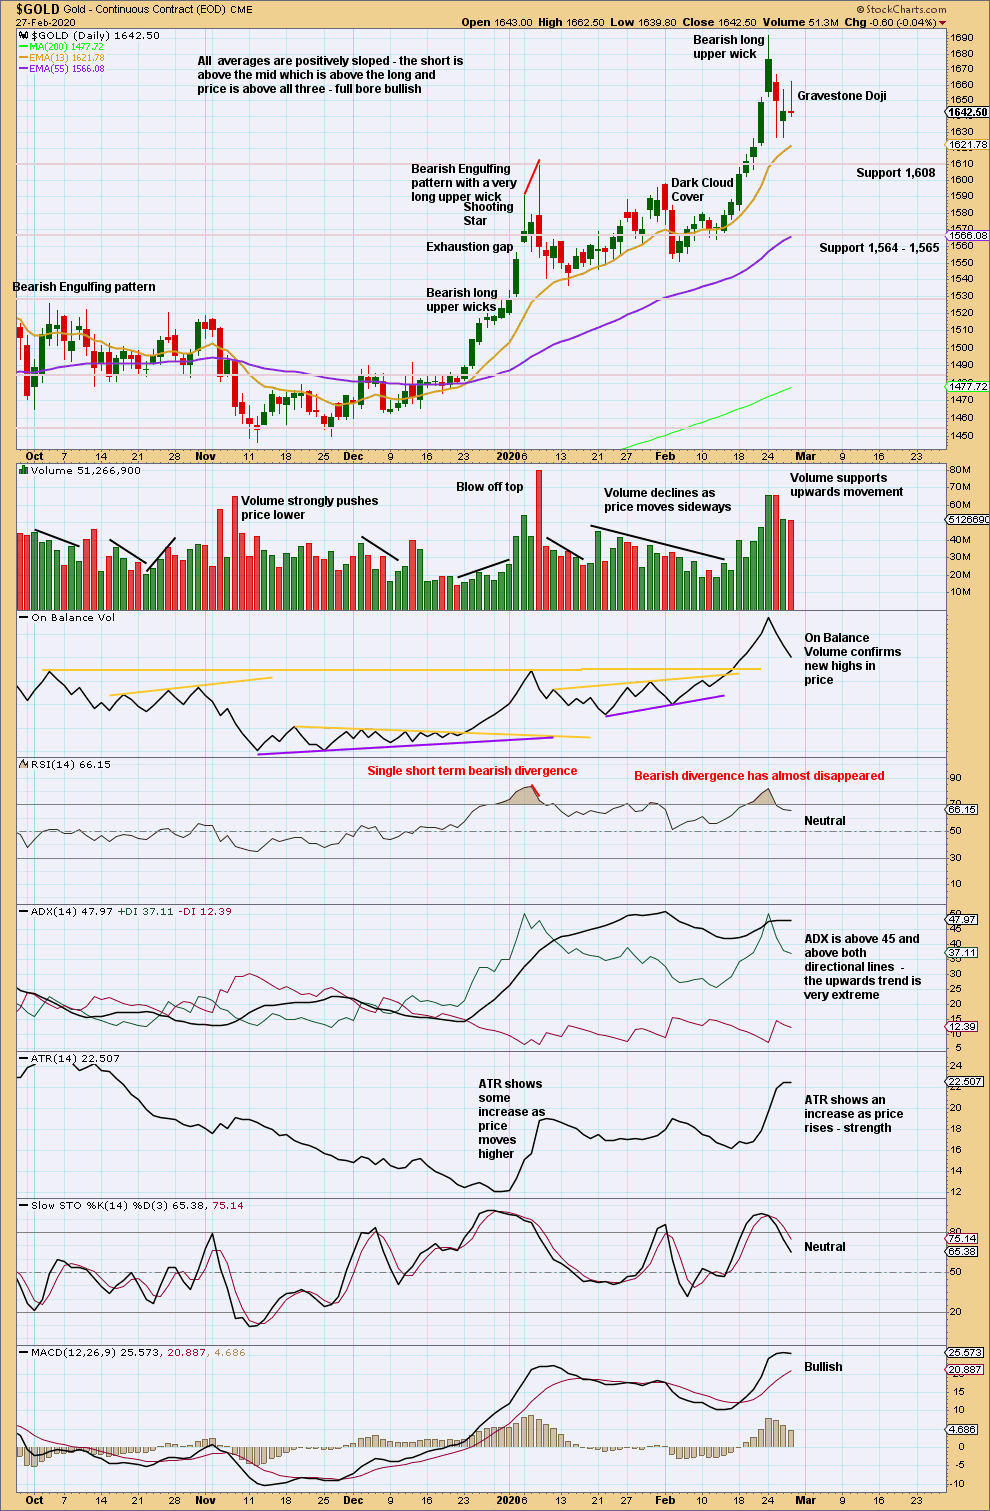
Click chart to enlarge. Chart courtesy of StockCharts.com.
Conditions are very extreme at both weekly and daily time frames. ADX is very extreme. RSI had reached overbought at the high.
A blow off top has formed. Blow off tops may come either at a major sustainable high, or a few days before a major sustainable high.
Today a Gravestone Doji is bearish, but it does not come at the high. It may also be a normal part of sideways movement within a consolidation.
GDX WEEKLY CHART
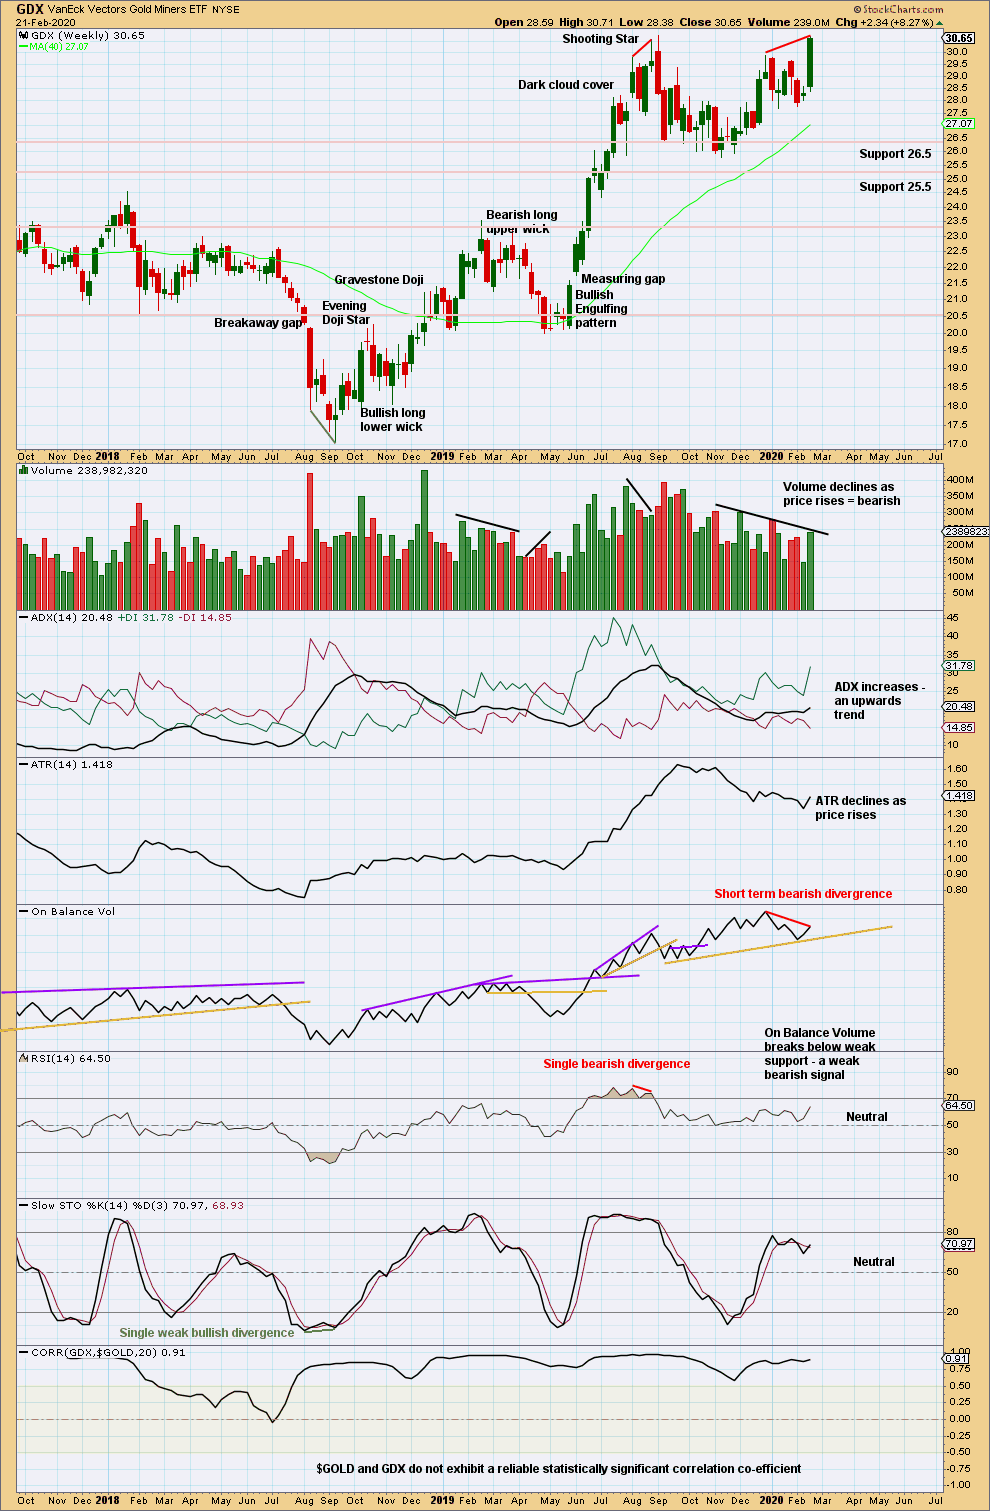
Click chart to enlarge. Chart courtesy of StockCharts.com.
While Gold has made new highs, GDX has not by a very small margin.
The week has closed strongly suggesting more upwards movement next week. Some weakness is evident in bearish divergence with RSI and overall declining volume, although the last week was stronger than the week prior.
GDX DAILY CHART
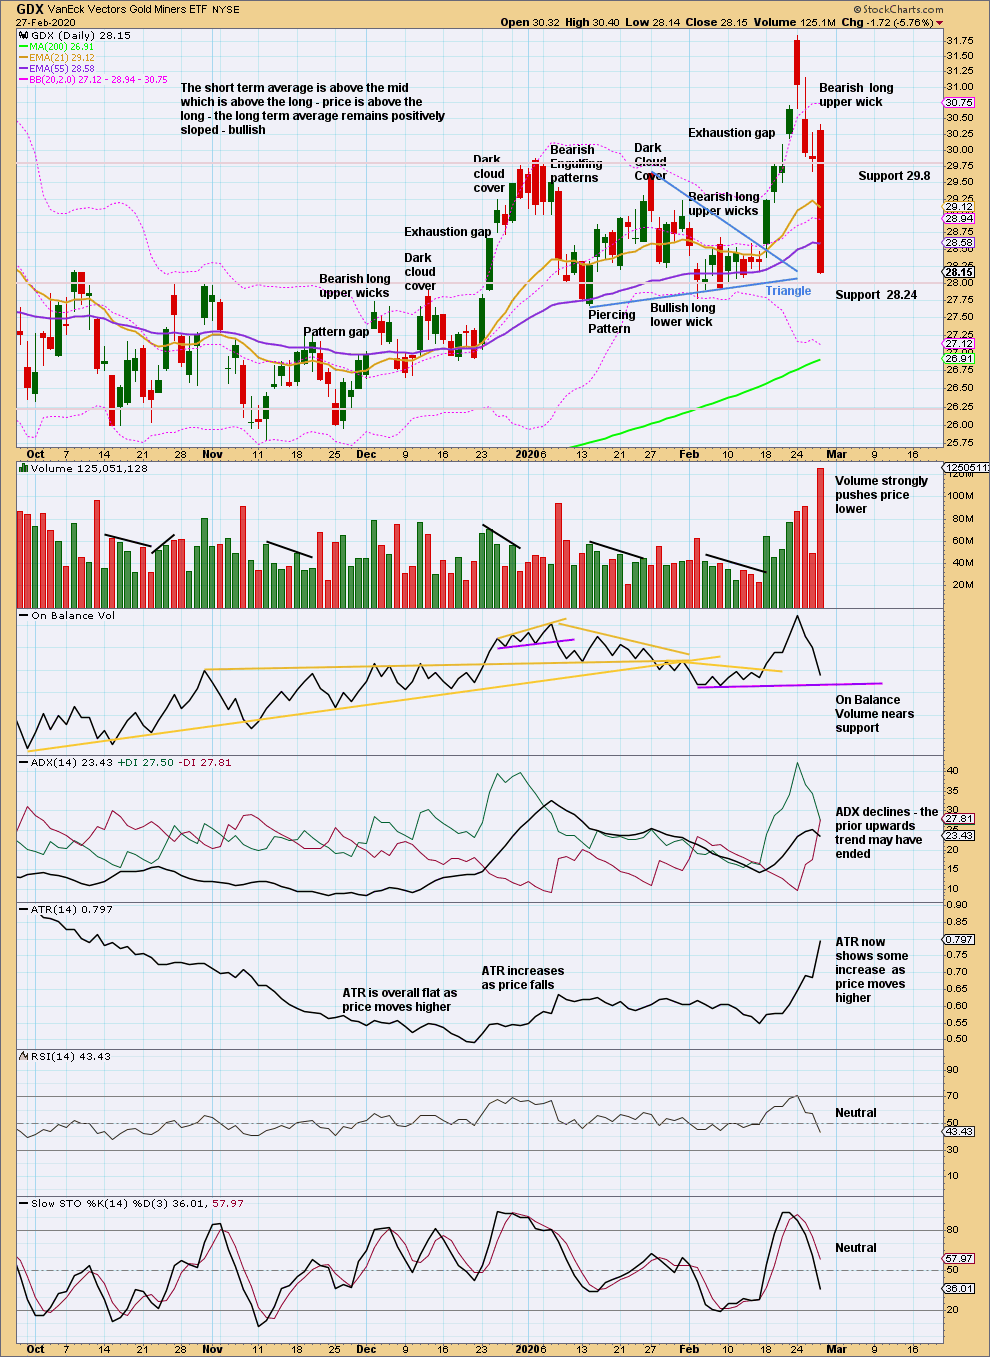
Click chart to enlarge. Chart courtesy of StockCharts.com.
Next support is about 26.25. Conditions are not yet oversold. There is room for price to fall further.
Published @ 07:45 p.m. EST.
—
Careful risk management protects your trading account(s).
Follow my two Golden Rules:
1. Always trade with stops.
2. Risk only 1-5% of equity on any one trade.
—
New updates to this analysis are in bold.
And with an invalidation of Gold on the daily chart that’s telling us that finally a high may be in.
Hi Lara,
I hope you had a good flight to the states.
Is the gap down today in GDX a break away gap ? If so, how far into the gap should we consider short positions? Could we set the top of the gap as a stop loss?
Hi Lara, Thanks for your steady hand. Any Bitcoin updates? Thanks
I’ve just arrived in the USA last night.
Over next week I may have some time to updated Bitcoin.
Welcome to USA 👍❤
Love your work .
Thanks Papudi. We’ll be in Texas for a bit over the next few months and I’m really looking forward to it, despite a lack of surf.