Natural Gas: Elliott Wave and Technical Analysis | Charts – February 6, 2020
Summary: Downwards movement may continue for another one to few years. The final target is 0.025.
WEEKLY CHART
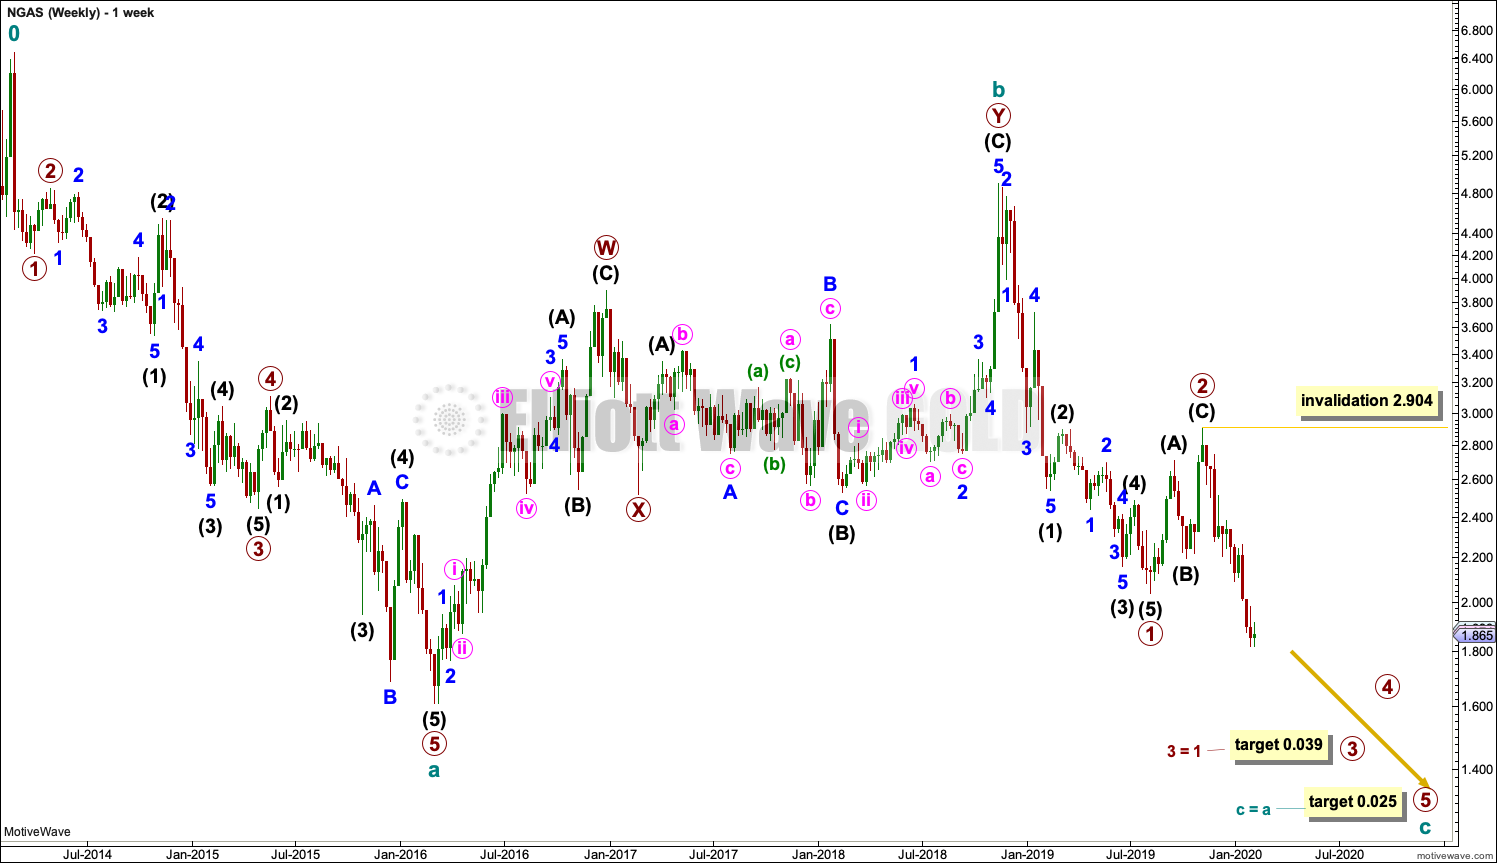
Cycle wave b is now a complete double zigzag.
Cycle wave c downwards has begun. Cycle wave c would be very likely to make at least a slight new low below the end of cycle wave a at 1.611 to avoid a truncation.
Cycle wave c must subdivide as a five wave structure, most likely an impulse. Within the impulse, so far primary waves 1 and 2 may be complete.
Primary wave 3 may only subdivide as an impulse. Within primary wave 3, no second wave correction may move beyond its start above 2.904.
DAILY CHART
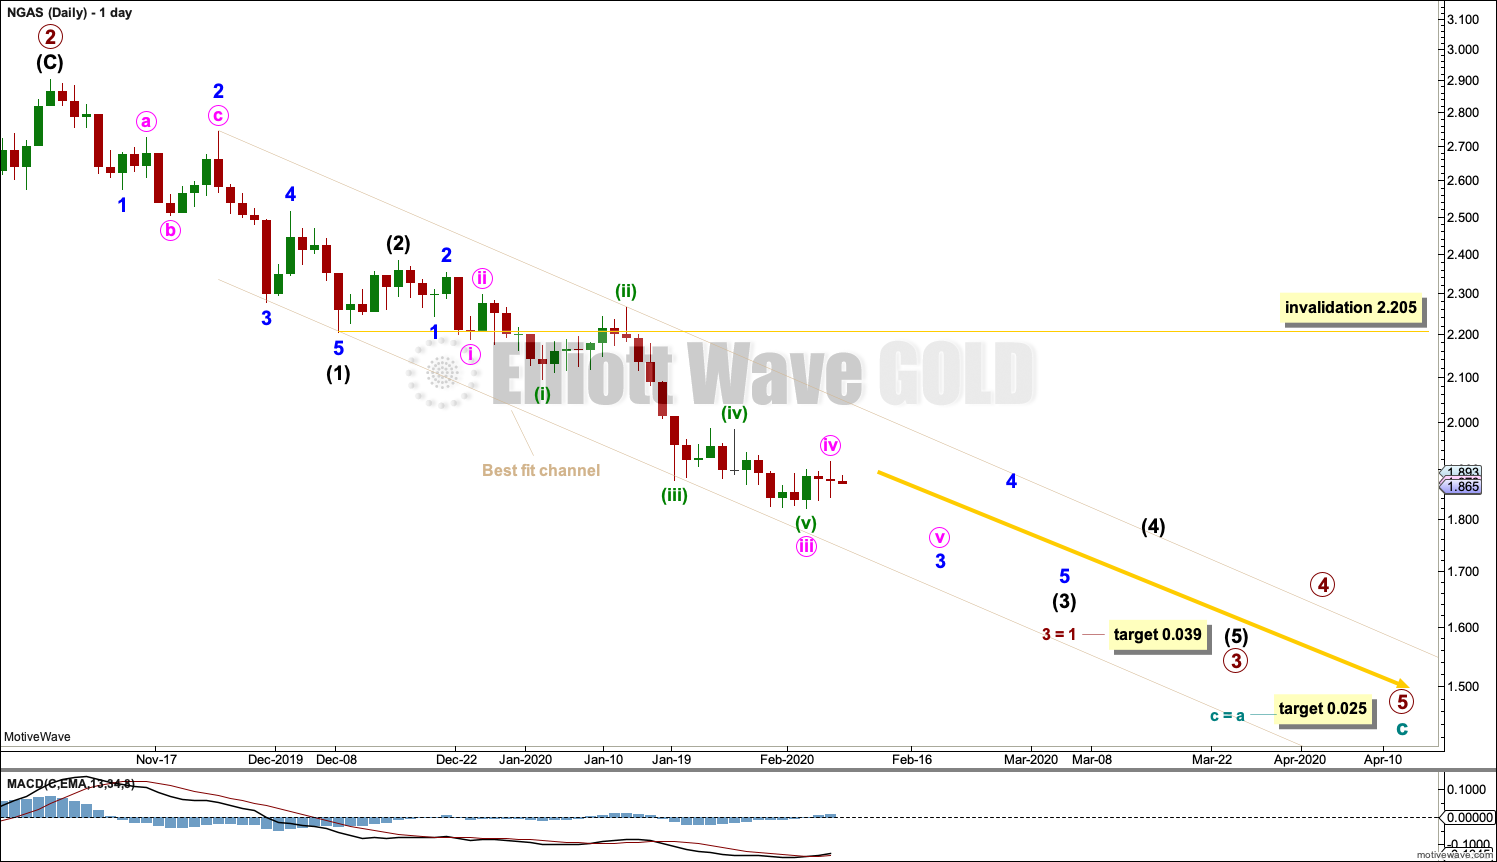
This daily chart focusses on primary wave 3.
Draw a best fit channel about primary wave 3 as shown. Assume the downwards trend may continue while price remains below the upper edge of the channel.
Commodities have a tendency to exhibit swift and strong fifth waves. This tendency is espeically prevalent in fifth waves to end third wave impulses one degree higher. Any one or more of upcoming fifth waves of minute wave v, minor wave 5, intermediate wave (5), and especially primary wave 5 may exhibit this tendency as selling climaxes.
Within the impulse of primary wave 3, intermediate wave (4) may not move into intermediate wave (1) price territory above 2.205.
When price breaks out of the channel with upwards movement, that may indicate primary wave 3 may be complete and primary wave 4 may have arrived.
TECHNICAL ANALYSIS
WEEKLY CHART

Click chart to enlarge. Chart courtesy of StockCharts.com.
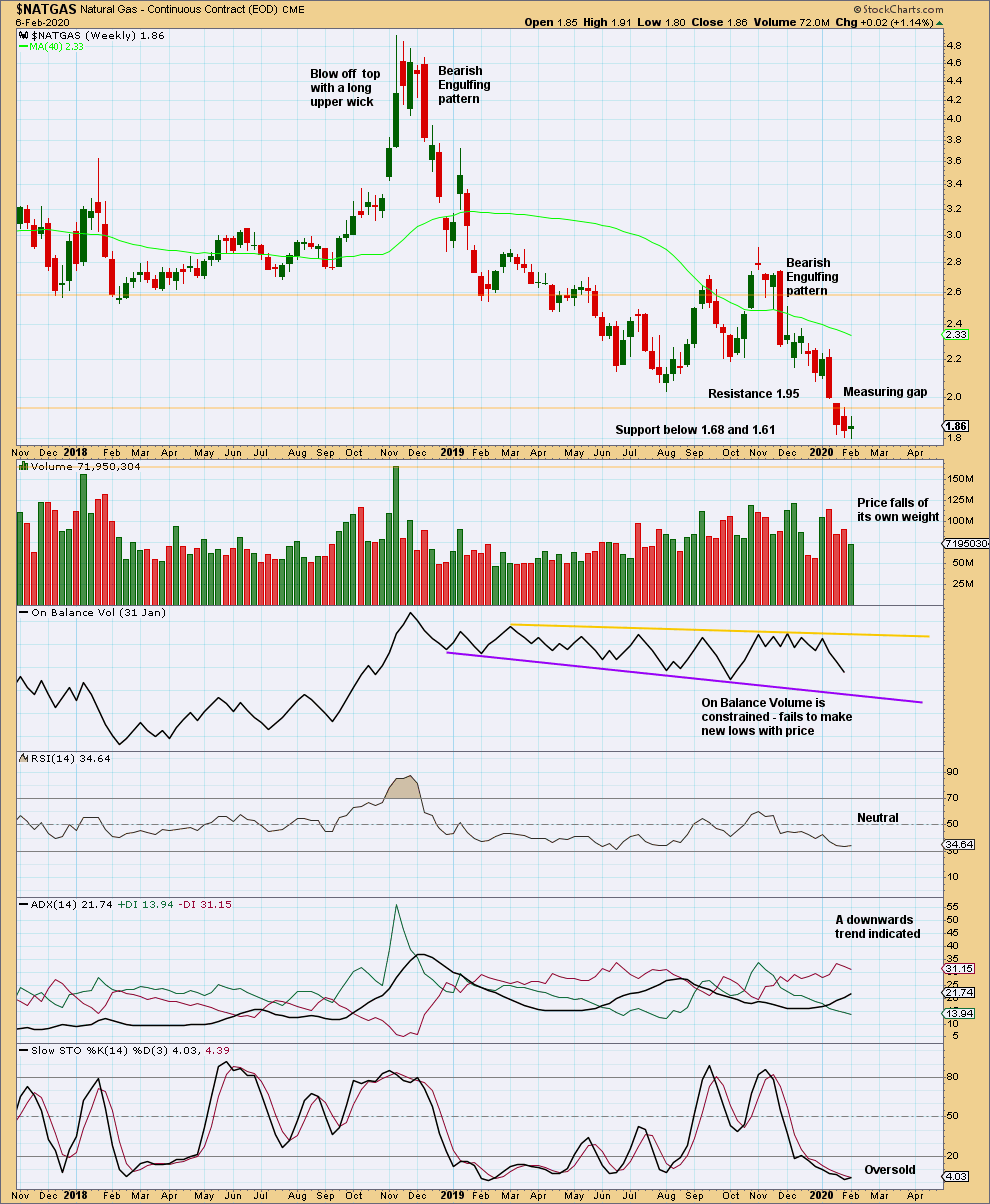
The downwards trend has plenty of room to continue before it reaches extreme. This downwards trend may still be in a relatively early stage. While this market trends, Stochastics may remain oversold for a long period of time. Look for RSI to reach oversold and then exhibit bullish divergence while ADX reaches extreme. If this happens, then expect a trend change.
DAILY CHART

Click chart to enlarge. Chart courtesy of StockCharts.com.
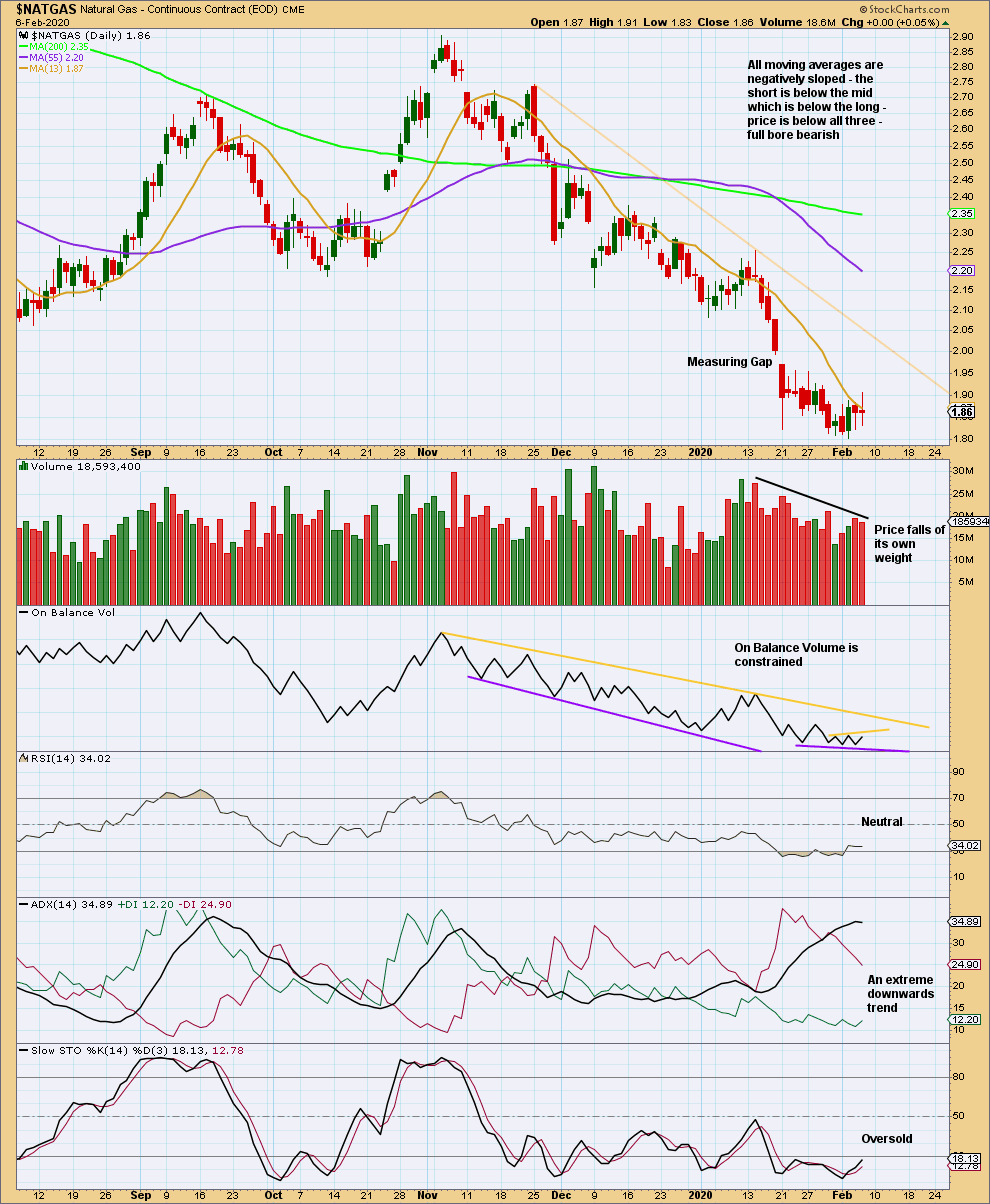
The measuring gap gives a target at 1.709, which is not yet met.
Volume does not support downwards movement, and at this time frame ADX has reached extreme. A bounce or consolidation may relive extreme conditions before the larger trend can continue.
Published @ 01:02 a.m. EST on February 7, 2020.
—
Careful risk management protects your trading account(s).
Follow my two Golden Rules:
1. Always trade with stops.
2. Risk only 1-5% of equity on any one trade.
—
New updates to this analysis are in bold.


This chart that I published on the gold thread about a week ago aligns closely with Lara’s chart while showing a longer time frame. Posting here on the NG thread for reference.
Below 1.61 will likely be a monster buying opportunity. Expect the glut of NG to slowly evaporate as it’s use for electric generation increases. Take a look at future electric car projected growth. Huge over the next decades. GL
That data and chart looks different to the data I’m using from FXCM. I think yours is futures, and the one I’m using is cash.
So different wave counts.
Lara,
thank you for sharing Nature Gas picture to us. I have an alternative count for this, which is W-X-Y and target to 1.06 to 1.16. Because I believe Nature gas still has its value. Once less supplier produce it and the price will go up again.
regards,
Hansen
Hansen, your target, around 1.61 looks good; however, you may want to look at your labeling of wave (x). In an Elliott Wave triangle, wave D cannot move beyond the end of Wave B.
He’s right.
Your triangle is invalid.
There are a series of education videos on the education page that I made. There is one for triangles that explains the rules and guidelines for them.
Lara, I presume you mean the targets to be 0.39 and 0.25 not 0.039 and 0.025. The latter would be the end of the industry!
I just checked, and the targets are 0.025 for C = A, and 0.039 for 3 = 1.
That’s the math.
Yikes! I didn’t do the math.
Being pragmatic, I would expect the overall structure of cycle wave c to be similar to the structure of primary 1, where the first wave is the longest and the whole thing becomes compressed towards the end.
We could well see lows below the 1992 low around 1.0 but I doubt by much. Just IMO.
Thank you, Lara! Really hope you are right again! Cannot forget your magnificent 4.7 call; got in short at about 4.7 but traded like a chicken when it was flapping like a wounded animal up there. Catching NG at 0.025-0.04 would be something! 🙂
LOL
That made me laugh