
GOLD: Elliott Wave and Technical Analysis | Charts – March 2, 2020
Downwards movement has continued as last Elliott wave analysis expected. Price is finding resistance perfectly at the upper edge of an Elliott channel on the hourly chart. A target may now be calculated for the short term.
Summary: The bear market may have resumed for Gold to eventually make new lows below 1,046.27. For the short term, a target for the first five down to complete is now at 1,550. When this is done, then a multi-day bounce or consolidation may begin.
The alternate bullish wave count now expects a cycle degree fourth wave may have just begun.
Grand SuperCycle analysis is here.
Monthly charts were last updated here.
BEARISH ELLIOTT WAVE COUNT
WEEKLY CHART
Click chart to enlarge.
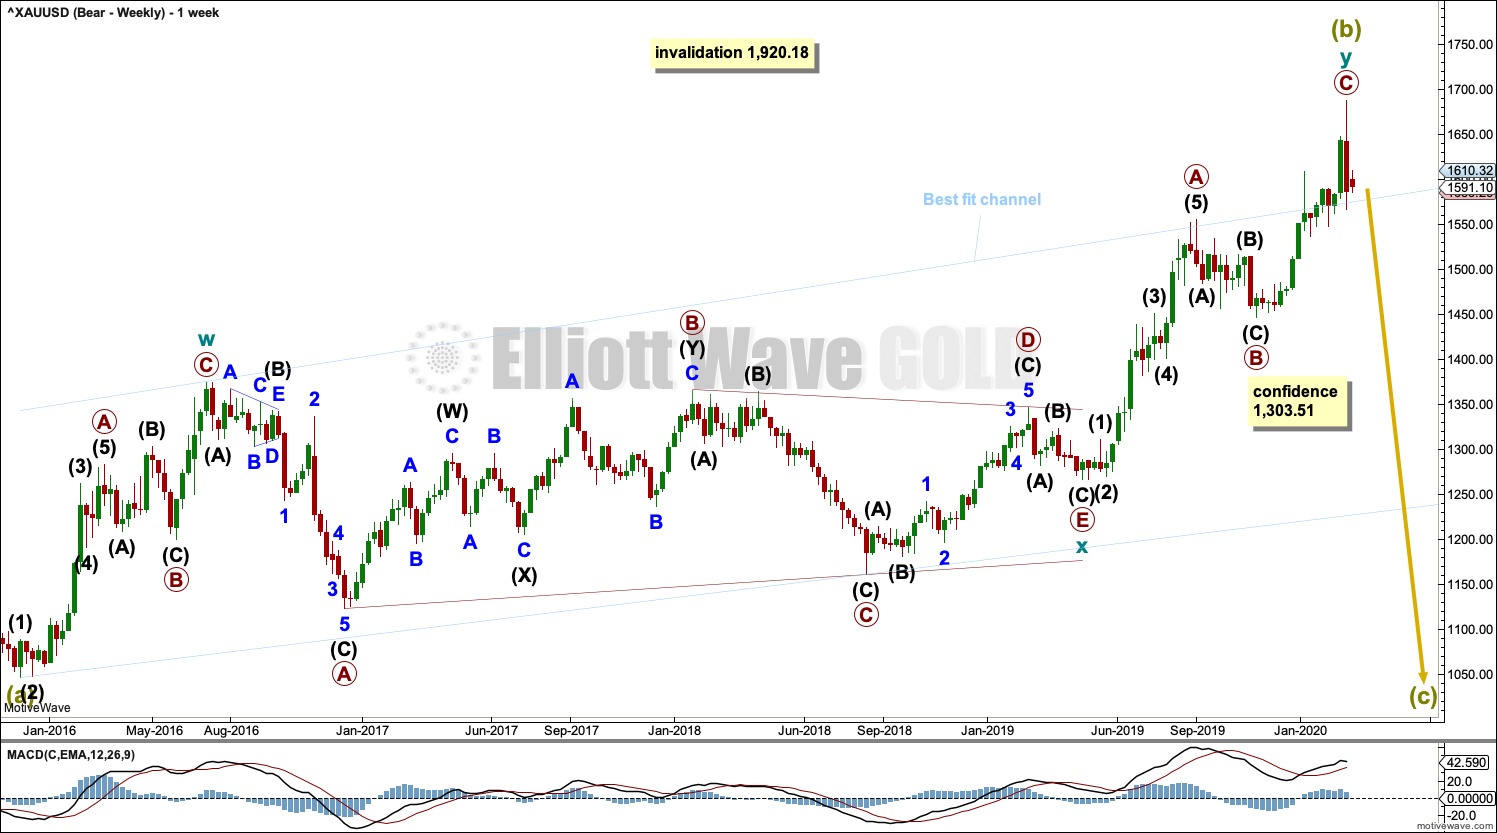
Super Cycle wave (b) may be a complete double zigzag.
The first zigzag in the double is labelled cycle wave w. The double is joined by a three in the opposite direction, a triangle labelled cycle wave x. The second zigzag in the double is labelled cycle wave y.
The purpose of the second zigzag in a double is to deepen the correction. Cycle wave y has achieved this purpose.
A wide best fit channel is added in light blue. Copy this channel over to daily charts. Price is now above the upper edge of this channel, which may now provide some support.
DAILY CHART
Click chart to enlarge.
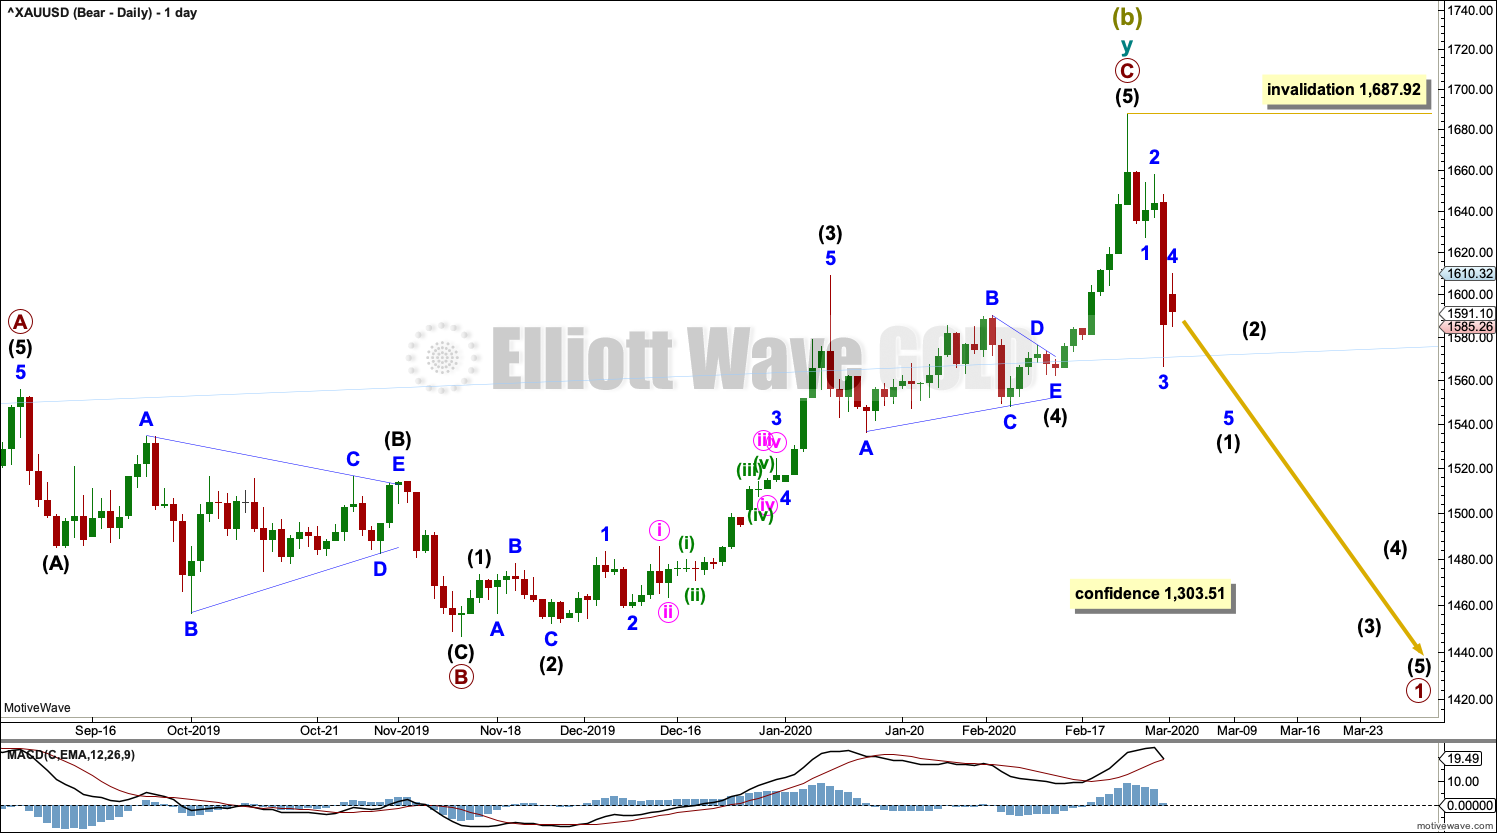
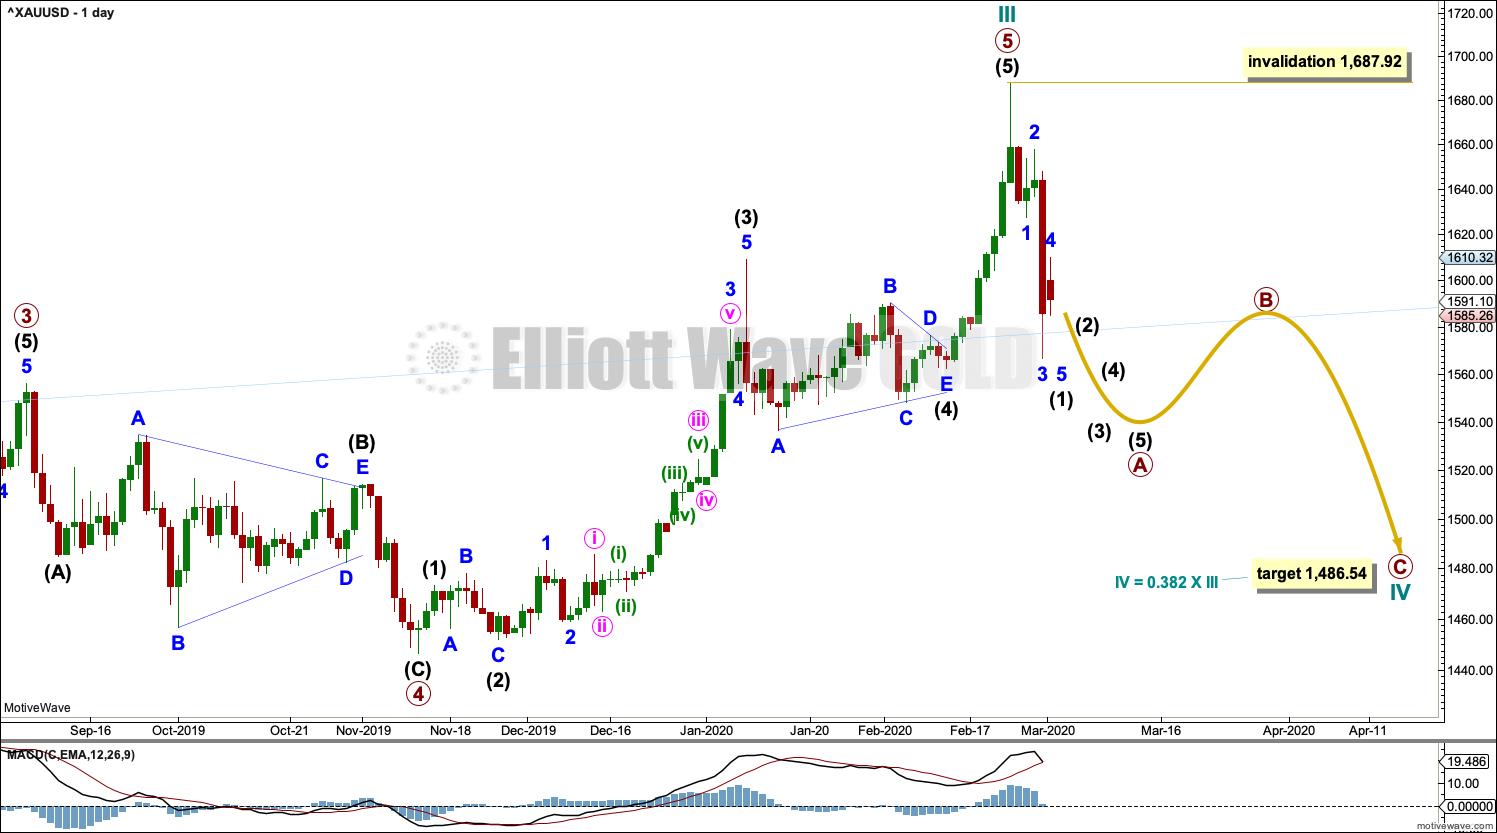
Super Cycle wave (b) may be complete.
A new trend at Super Cycle degree should begin with a five down at all time frames. This is labelled intermediate wave (1). Following the completion of intermediate wave (1), intermediate wave (2) may not move beyond the start of intermediate wave (1) above 1,687.92.
Intermediate wave (1) so far has lasted five days. It may complete in another one to few days. Intermediate wave (2) may last about a week to two or even three weeks when it arrives.
The first large second wave correction for a new trend in Gold is usually very deep and time consuming.
HOURLY CHART
Click chart to enlarge.
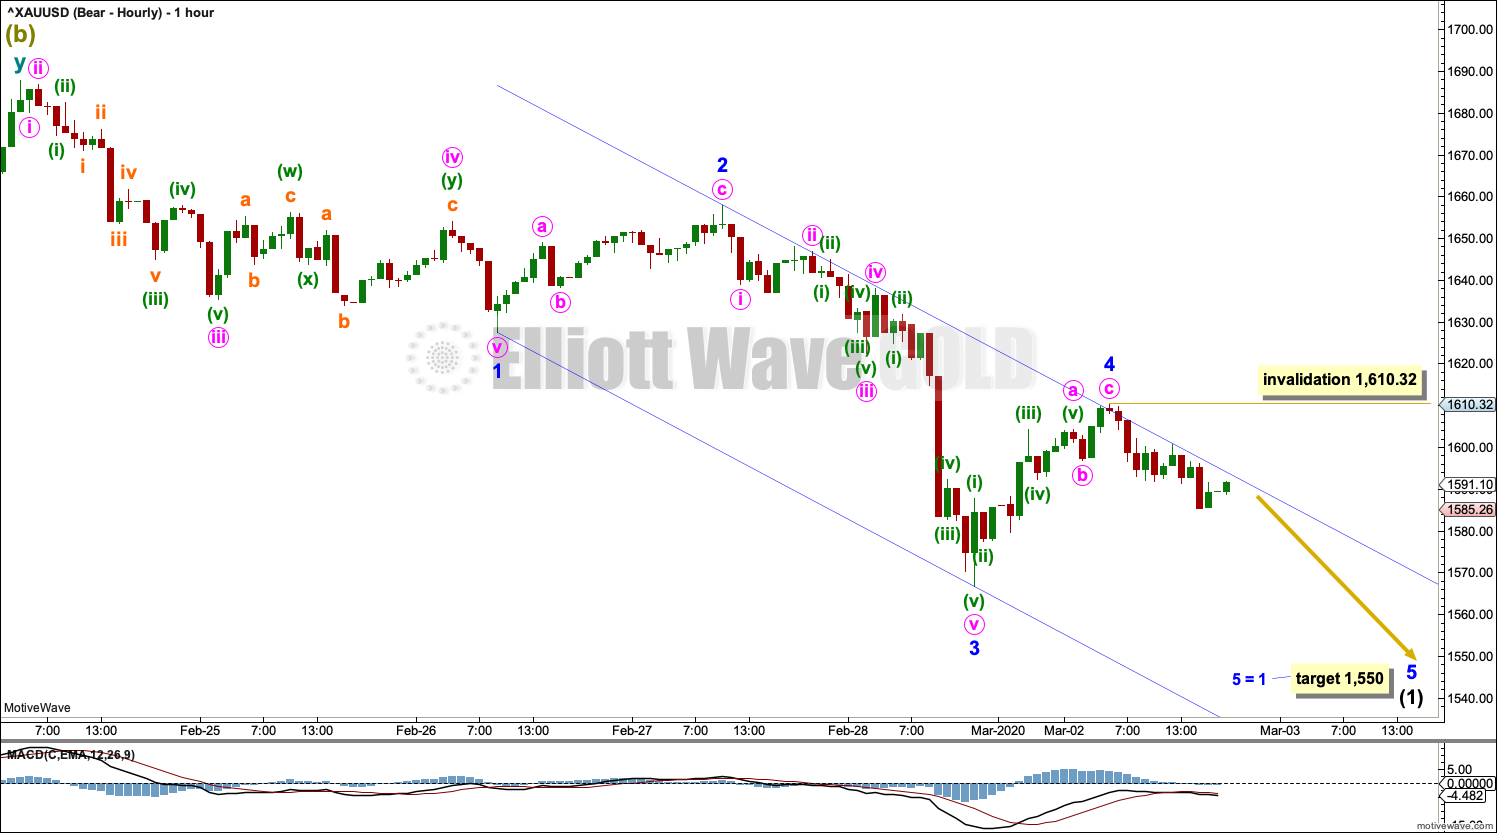
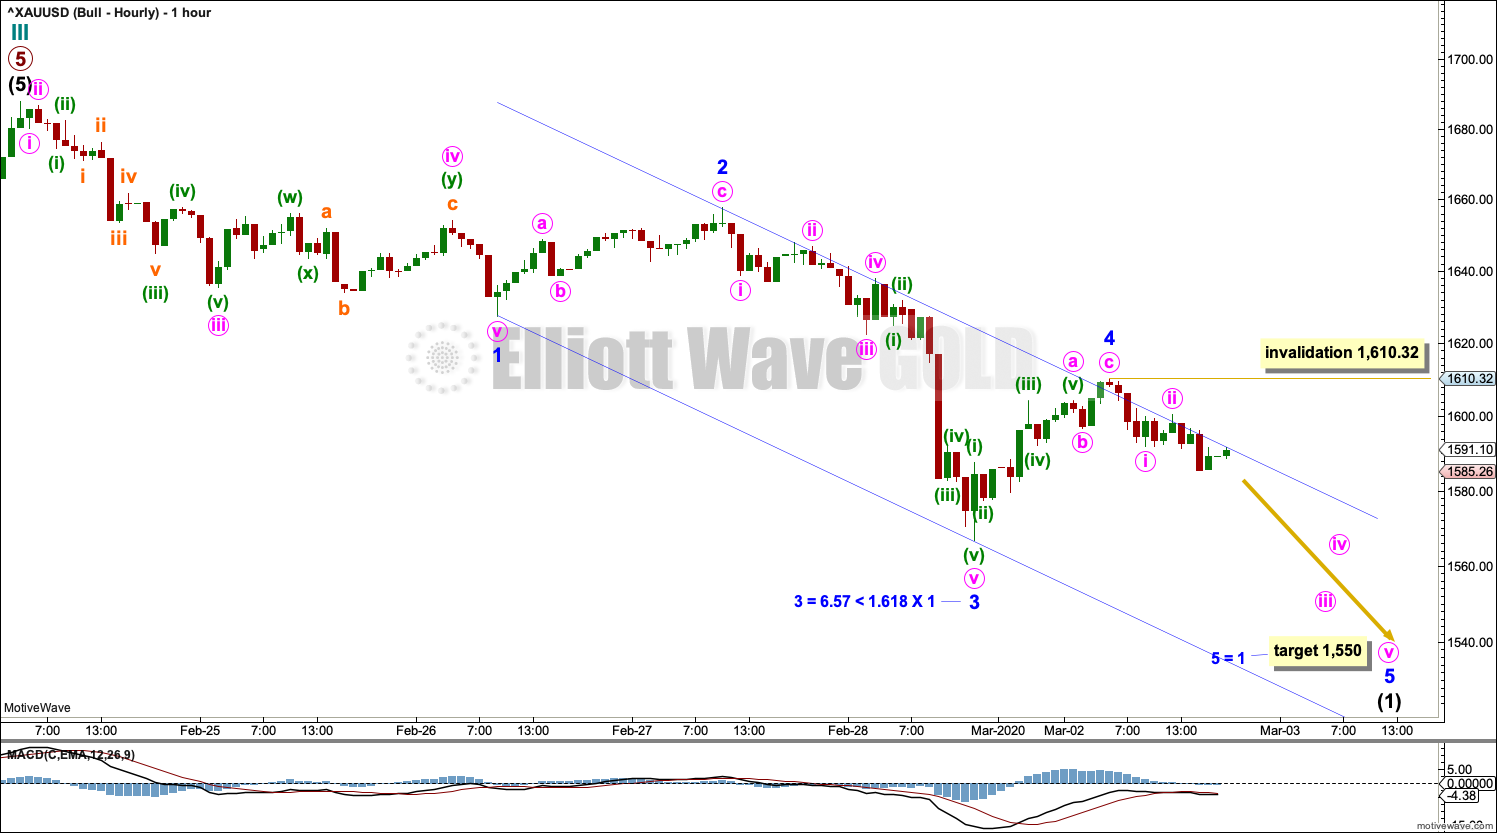
This hourly chart shows detail of intermediate wave (1).
Minor waves 1 through to 4 may be complete. Minor wave 4 has found resistance at the upper edge of the blue channel.
A target is calculated for minor wave 5 that expects it to exhibit the most common Fibonacci ratio to minor wave 1.
Within minor wave 5, no second wave correction may move beyond the start of its first wave above 1,610.32.
BULLISH ELLIOTT WAVE COUNT
WEEKLY CHART
Click chart to enlarge.
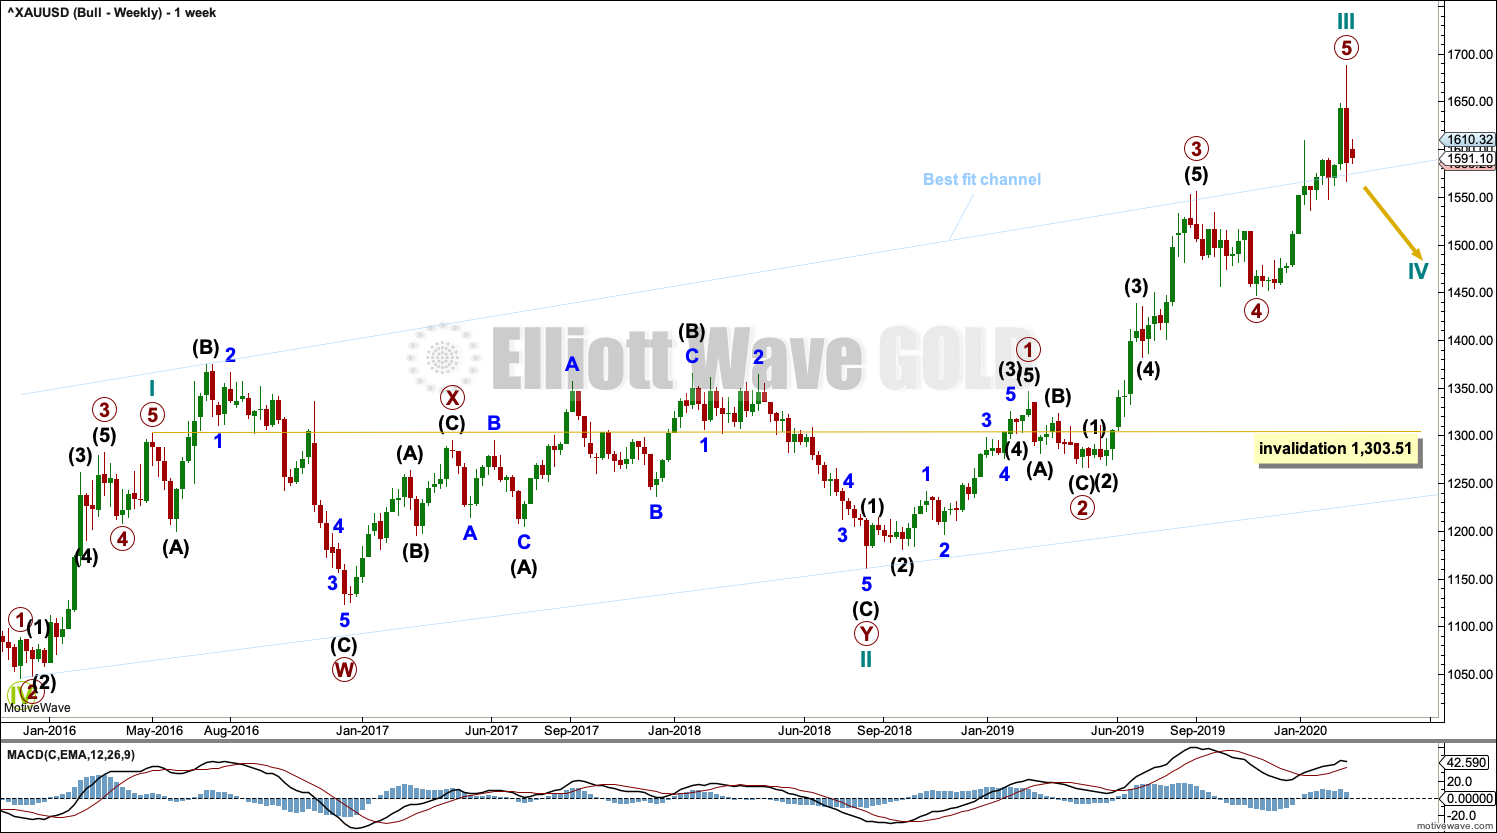
This wave count sees the the bear market complete at the last major low for Gold on 3 December 2015.
If Gold is in a new bull market, then it should begin with a five wave structure upwards on the weekly chart.
Cycle wave I fits as a five wave impulse with reasonably proportionate corrections for primary waves 2 and 4. This resolves a previous major problem with the bullish wave count.
Cycle wave II now fits as a double flat. However, a problem arises with the relabelling of this structure. Within the first flat correction labelled primary wave W, this wave count now needs to ignore what looks like an obvious triangle from July to September 2016 (this can be seen labelled as a triangle on the bear wave count above). This movement must now be labelled as a series of overlapping first and second waves.
Within the first flat correction labelled primary wave W of the double flat of cycle wave II, intermediate wave (B) is 1.69 the length of intermediate wave (A). This is longer than the common range of up to 1.38, but within an allowable guideline of up to 2. The length of intermediate wave (B) reduces the probability of this wave count.
Cycle wave III may now be complete. Cycle wave IV may have just begun, and it may not move into cycle wave I price territory below 1,303.51.
DAILY CHART
Click chart to enlarge.
Cycle wave IV may end within the price territory of the fourth wave of one lesser degree. Primary wave 4 has its territory from 1,556.11 to 1,446.68. Within this territory is the 0.382 Fibonacci ratio of cycle wave III at 1,486.64.
Cycle wave IV would most likely subdivide as a zigzag. This is the most common Elliott wave corrective structure, and it would provide alternation with the double combination of cycle wave II.
HOURLY CHART
Click chart to enlarge.
Hourly charts are again essentially the same.
TECHNICAL ANALYSIS
WEEKLY CHART
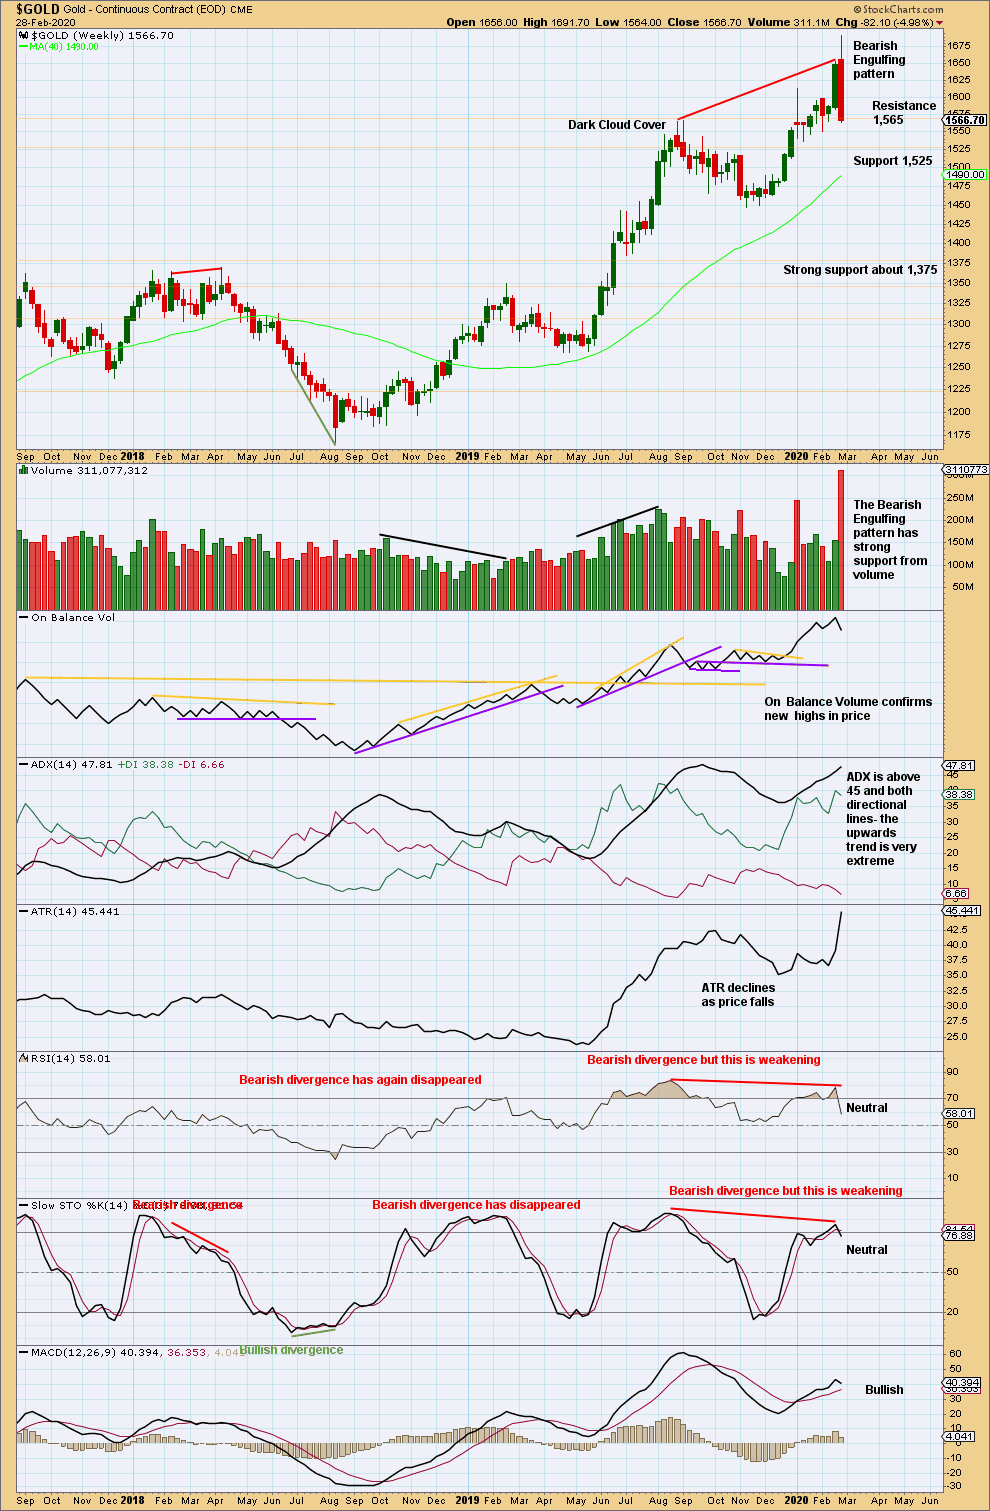
Click chart to enlarge. Chart courtesy of StockCharts.com.
After an upwards trend reached very extreme and RSI reached overbought then exhibited bearish divergence, a very strong bearish candlestick reversal pattern should be given weight. A trend change here now looks extremely likely.
DAILY CHART
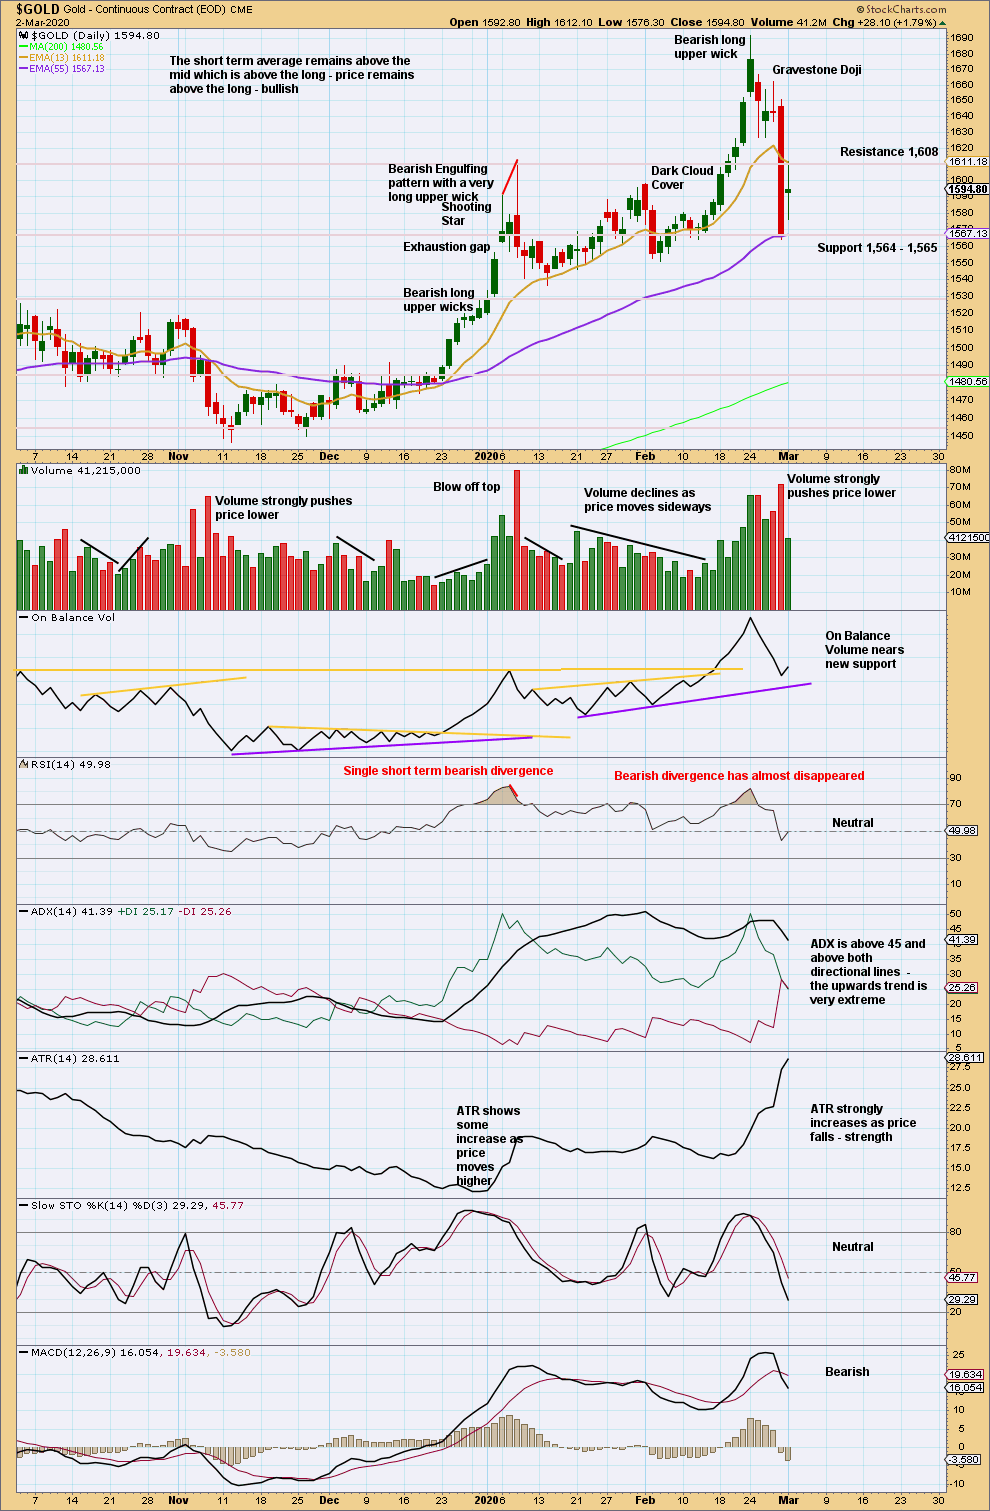
Click chart to enlarge. Chart courtesy of StockCharts.com.
An extremely strong bearish candlestick for Friday gives confidence that a sustainable high now looks likely to be in place.
Do not expect price to continue to move in a straight line. There will be bounces and consolidations along the way. If price reaches an area of support when Stochastics reaches oversold, then expect a bounce.
Bounces in a downwards trend are opportunities to join the trend.
A long legged doji for Monday suggests a pause, a balance of bulls and bears. This is normal within a trend. It is not a reversal pattern.
GDX WEEKLY CHART
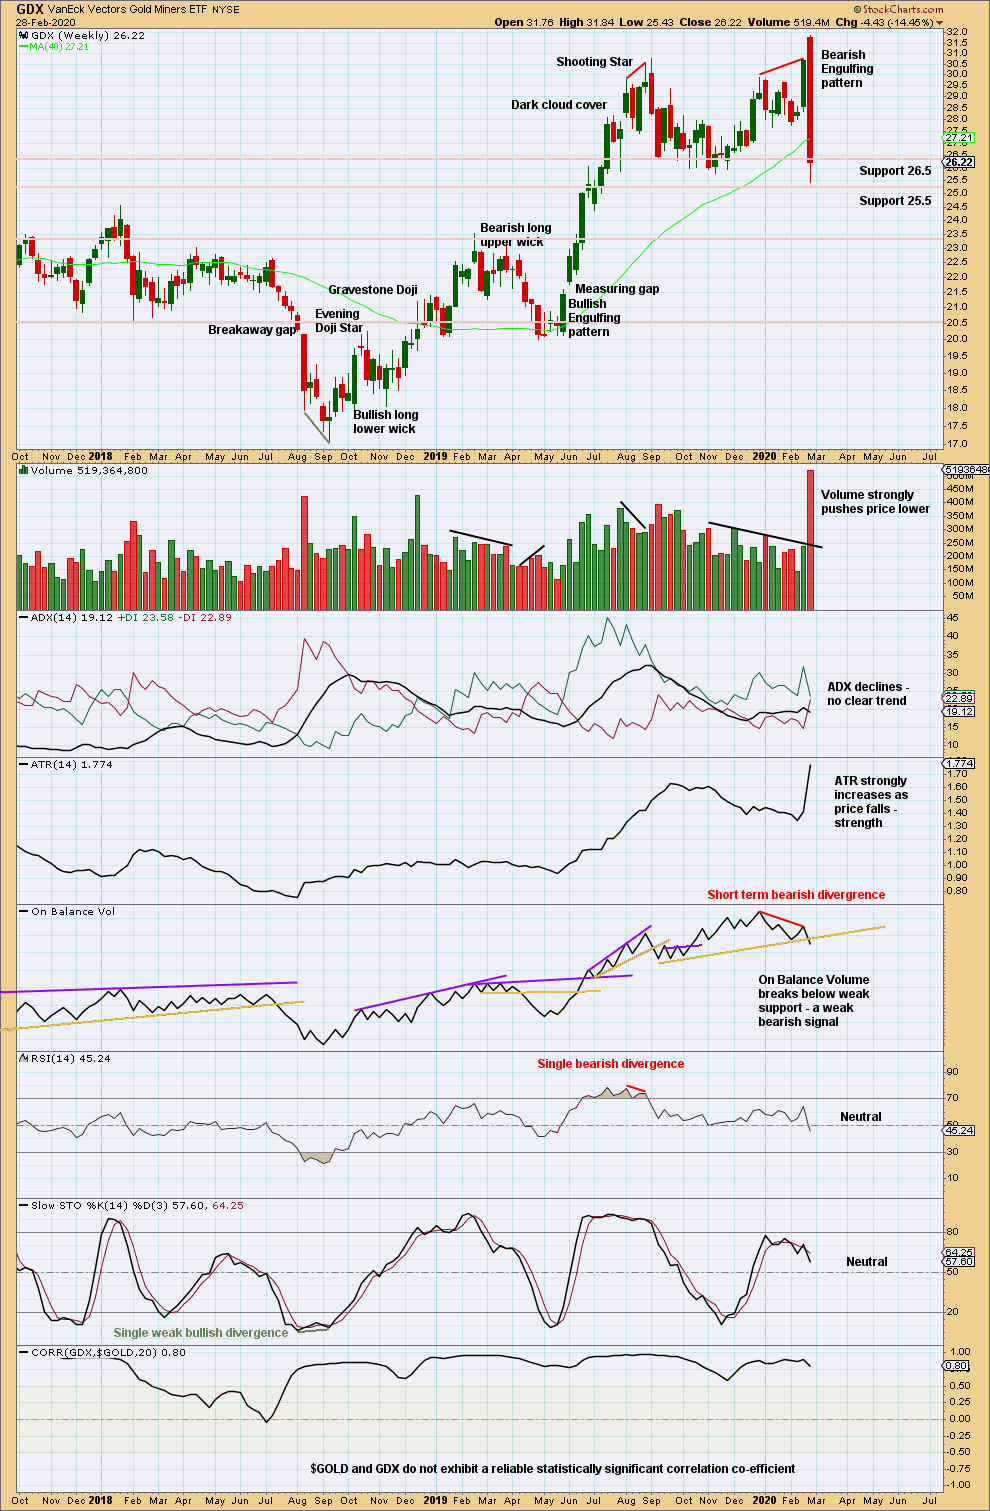
Click chart to enlarge. Chart courtesy of StockCharts.com.
GDX has had a trend change. Look for bounces and consolidations to possibly arrive about identified support areas.
GDX DAILY CHART
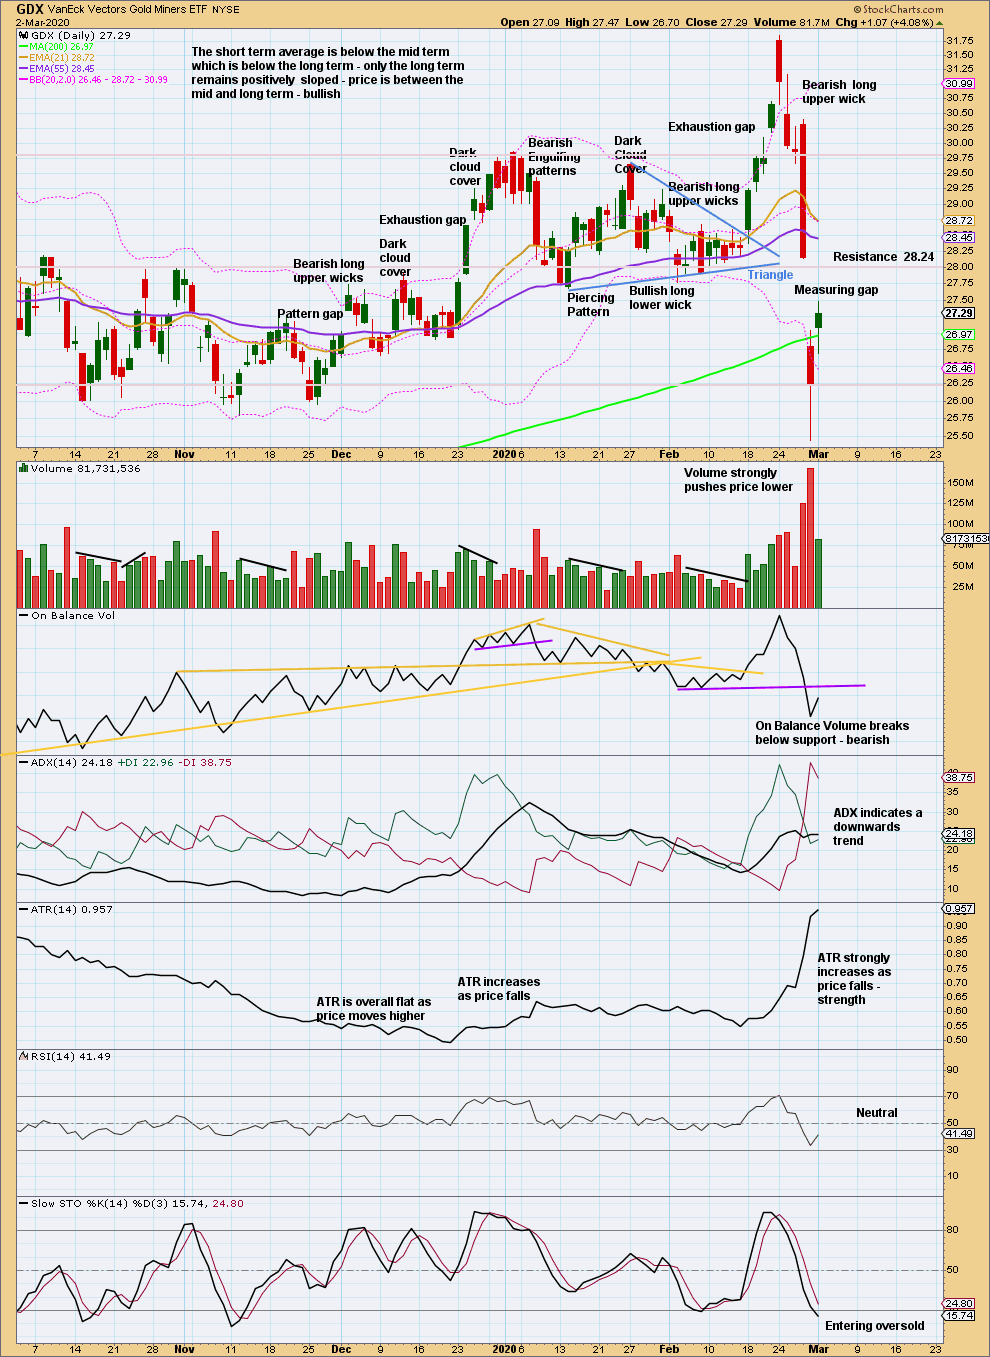
Click chart to enlarge. Chart courtesy of StockCharts.com.
A target calculated from the measuring gap is at 23.34. The gap may provide resistance at 28.14.
Published @ 11:33 p.m. EST.
—
Careful risk management protects your trading account(s).
Follow my two Golden Rules:
1. Always trade with stops.
2. Risk only 1-5% of equity on any one trade.
—
New updates to this analysis are in bold.
What would be the next Fibonacci ratio?
Many traders use 0.786, but that’s not technically a Fibonacci ratio.
The first second wave correction within a new trend for Gold can be very deep. It can be deeper than 0.8 of the first wave, and that would be normal.
Invalidated now in any case
New hourly chart below.
The invalidation point on the daily is still holding.
I was expecting intermediate (1) to look like a perfect impulse on the hourly chart, but it didn’t do that.
Invalidation point is moved to where it is on the daily chart. Intermediate (2) may be nearing an end, it’s now at the 0.618 Fibonacci ratio
Both hour’lies invalidated in one swoop …
I think Lara’ invalidation was set at the wrong level. It should have been end of Minor 1