
GOLD: Elliott Wave and Technical Analysis | Charts – March 5, 2020
Another wide ranging upward day with weak volume remains below the invalidation point for the main Elliott wave count.
Summary: Although volume remains light, strong upwards movement and a strong close suggest more upwards movement here. If price makes a new high by any amount at any time frame above 1,687.92, then a target for upwards movement to end would be at 1,736.
It remains possible that a sustainable high is in place and the bear market may have resumed for Gold to eventually make new lows below 1,046.27.
Grand SuperCycle analysis is here.
Monthly charts were last updated here.
BEARISH ELLIOTT WAVE COUNT
WEEKLY CHART
Click chart to enlarge.
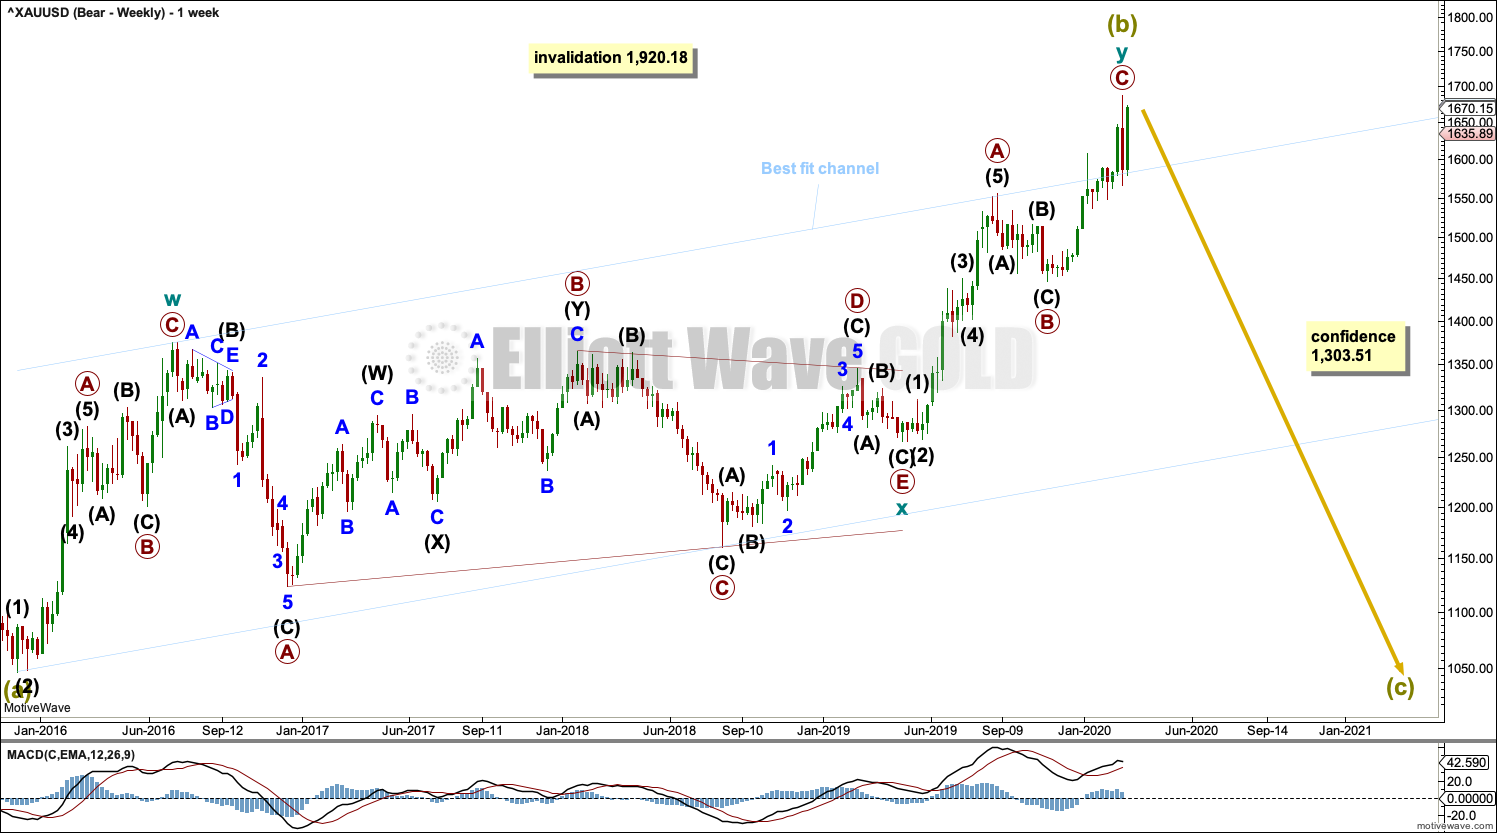
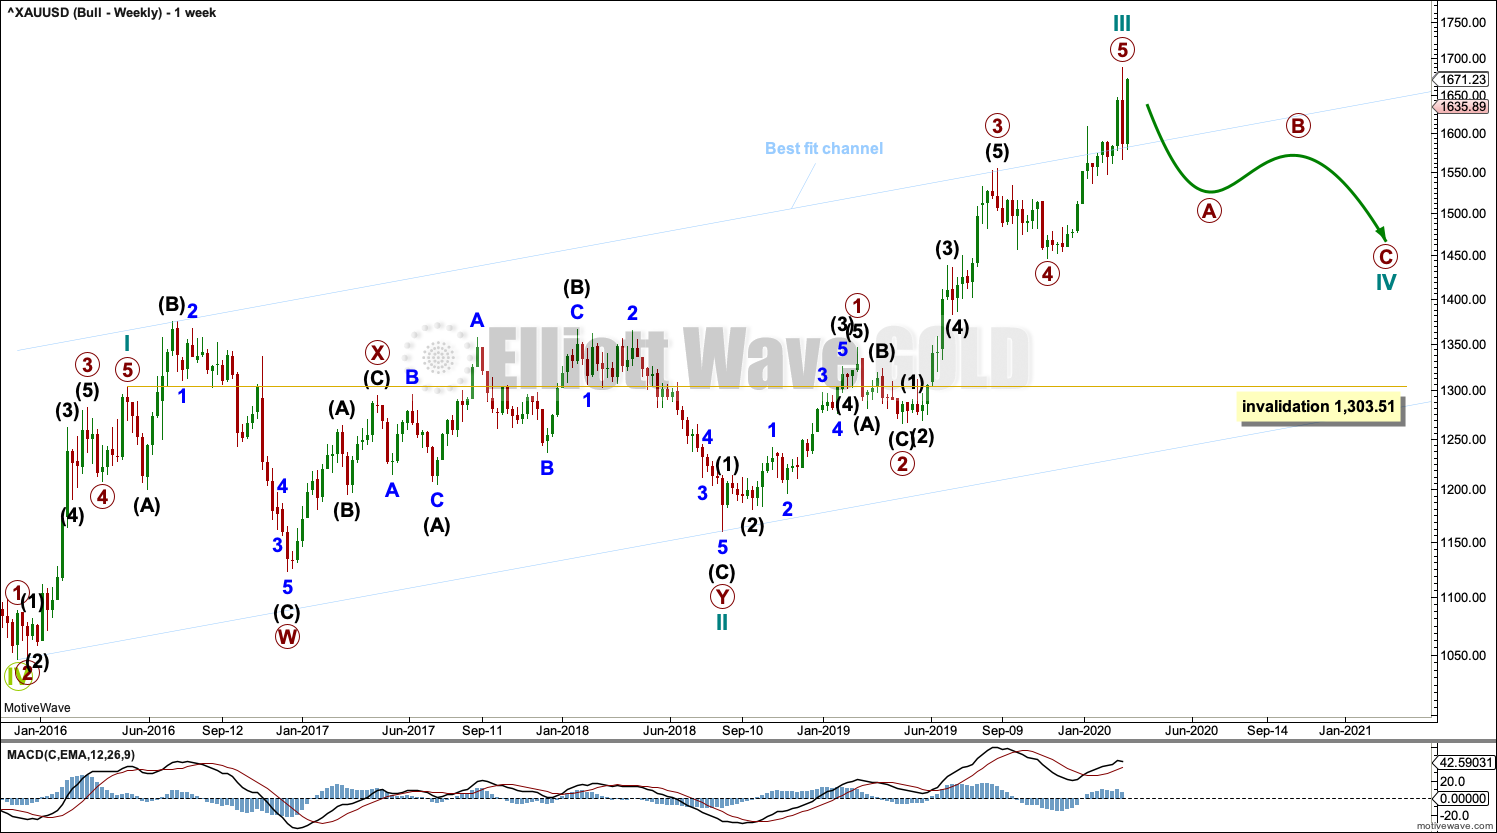
Super Cycle wave (b) may be a complete double zigzag.
The first zigzag in the double is labelled cycle wave w. The double is joined by a three in the opposite direction, a triangle labelled cycle wave x. The second zigzag in the double is labelled cycle wave y.
The purpose of the second zigzag in a double is to deepen the correction. Cycle wave y has achieved this purpose.
A wide best fit channel is added in light blue. Copy this channel over to daily charts. Price is now above the upper edge of this channel, which may now provide some support.
DAILY CHART
Click chart to enlarge.
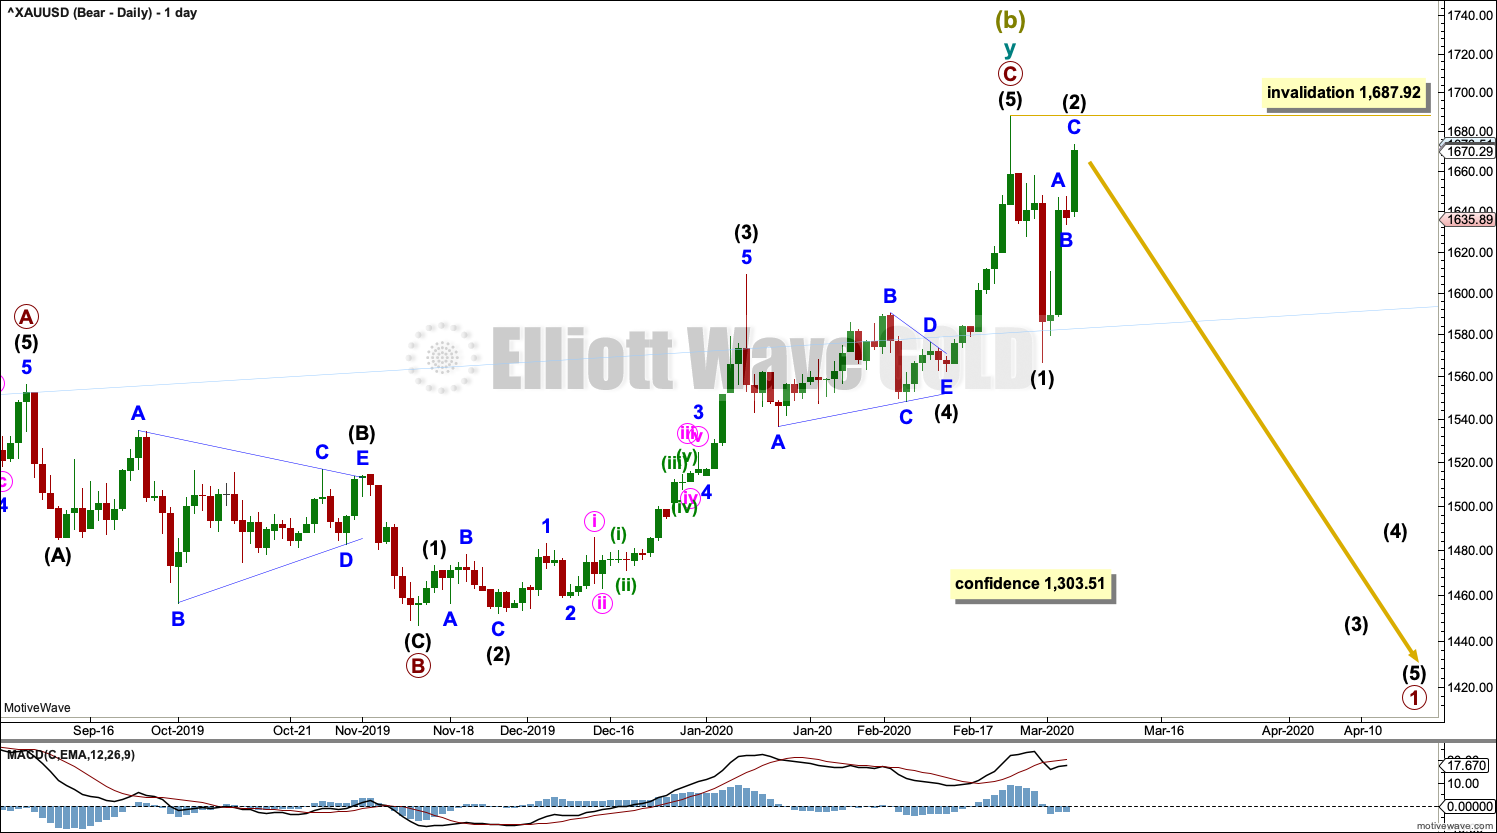
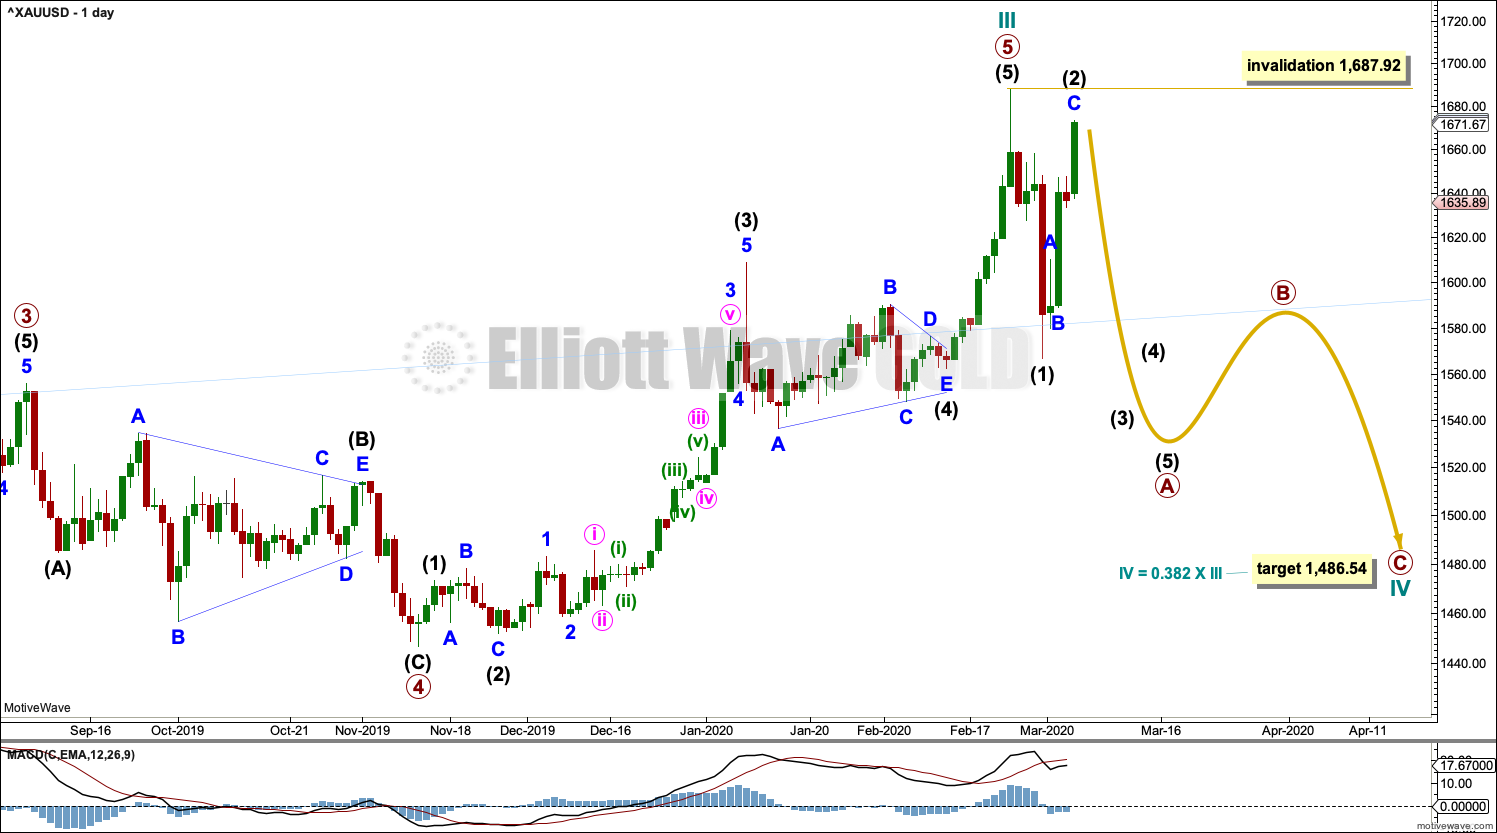
Super Cycle wave (b) may be complete.
A new trend at Super Cycle degree should begin with a five down at all time frames. This is labelled intermediate wave (1). Following the completion of intermediate wave (1), intermediate wave (2) may not move beyond the start of intermediate wave (1) above 1,687.92.
Intermediate wave (1) may have completed in four days. Intermediate wave (2) may be over as a quick sharp bounce.
The first large second wave correction for a new trend in Gold is usually very deep and time consuming. Intermediate wave (2) may be very deep, although so far it is not very time consuming.
HOURLY CHART
Click chart to enlarge.
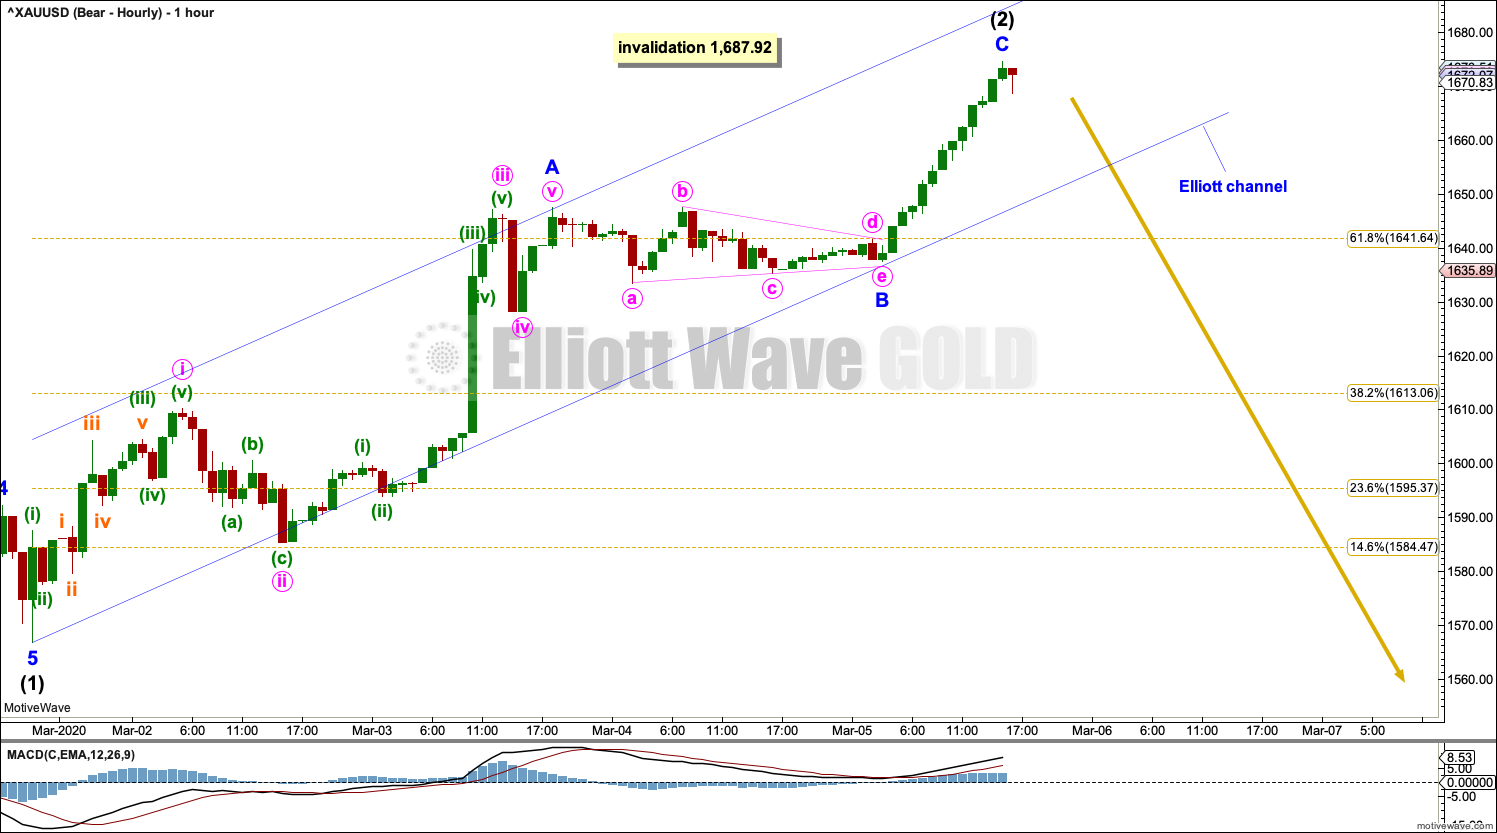
Today intermediate wave (2) is relabelled. It fits perfectly as a zigzag, with a triangle for minor wave B.
The channel is redrawn. While price remains within the channel, there may be no confidence that intermediate wave (2) is over; it may continue higher. If the channel is breached by downwards movement (not sideways), then that may be taken as earliest indication that intermediate wave (2) may be over and intermediate wave (3) may then have begun.
Intermediate wave (2) may not move beyond the start of intermediate wave (1) above 1,687.92.
ALTERNATE DAILY CHART
Click chart to enlarge.
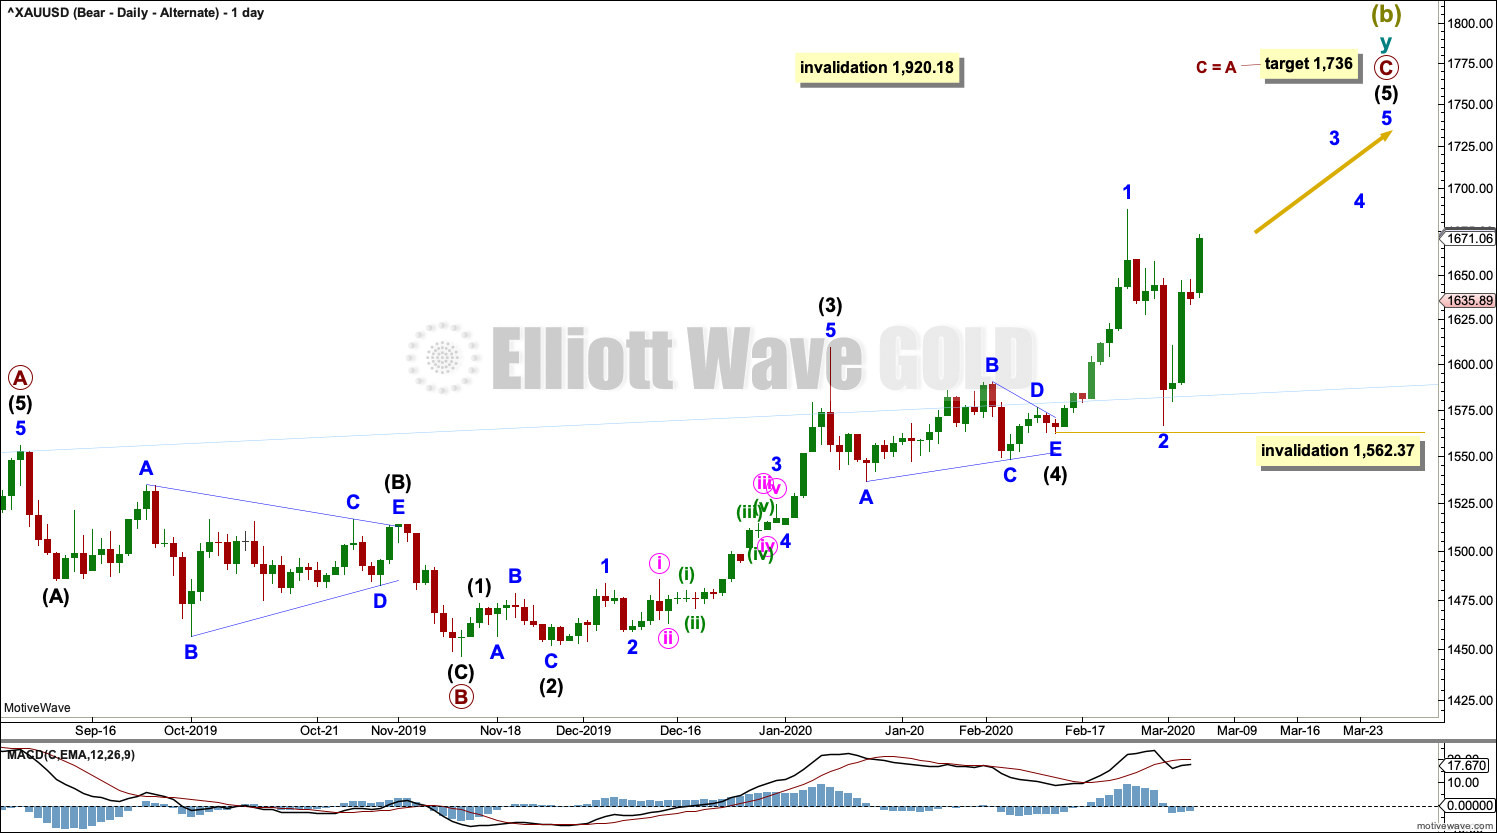
Alternatively, it remains possible that Super Cycle wave (b) may not be over. If the degree of labelling within intermediate wave (5) of primary wave C is moved down one degree, then at the last high only minor wave 1 of intermediate wave (5) may have been complete.
Minor wave 2 may be a complete zigzag. At the daily chart level, this does look best as a three wave structure.
Minor wave 2 may not move beyond the start of minor wave 1 below 1,562.37.
A target is calculated for primary wave C to end. If price makes a new high above 1,687.92 by any amount at any time frame, then this alternate would become the main wave count.
BULLISH ELLIOTT WAVE COUNT
WEEKLY CHART
Click chart to enlarge.
This wave count sees the the bear market complete at the last major low for Gold on 3 December 2015.
If Gold is in a new bull market, then it should begin with a five wave structure upwards on the weekly chart.
Cycle wave I fits as a five wave impulse with reasonably proportionate corrections for primary waves 2 and 4. This resolves a previous major problem with the bullish wave count.
Cycle wave II now fits as a double flat. However, a problem arises with the relabelling of this structure. Within the first flat correction labelled primary wave W, this wave count now needs to ignore what looks like an obvious triangle from July to September 2016 (this can be seen labelled as a triangle on the bear wave count above). This movement must now be labelled as a series of overlapping first and second waves.
Within the first flat correction labelled primary wave W of the double flat of cycle wave II, intermediate wave (B) is 1.69 the length of intermediate wave (A). This is longer than the common range of up to 1.38, but within an allowable guideline of up to 2. The length of intermediate wave (B) reduces the probability of this wave count.
Cycle wave III may now be complete. Cycle wave IV may have just begun, and it may not move into cycle wave I price territory below 1,303.51.
DAILY CHART
Click chart to enlarge.
Cycle wave IV may end within the price territory of the fourth wave of one lesser degree. Primary wave 4 has its territory from 1,556.11 to 1,446.68. Within this territory is the 0.382 Fibonacci ratio of cycle wave III at 1,486.64.
Cycle wave IV would most likely subdivide as a zigzag. This is the most common Elliott wave corrective structure, and it would provide alternation with the double combination of cycle wave II.
Hourly charts are again essentially the same, so only one will be published.
TECHNICAL ANALYSIS
WEEKLY CHART
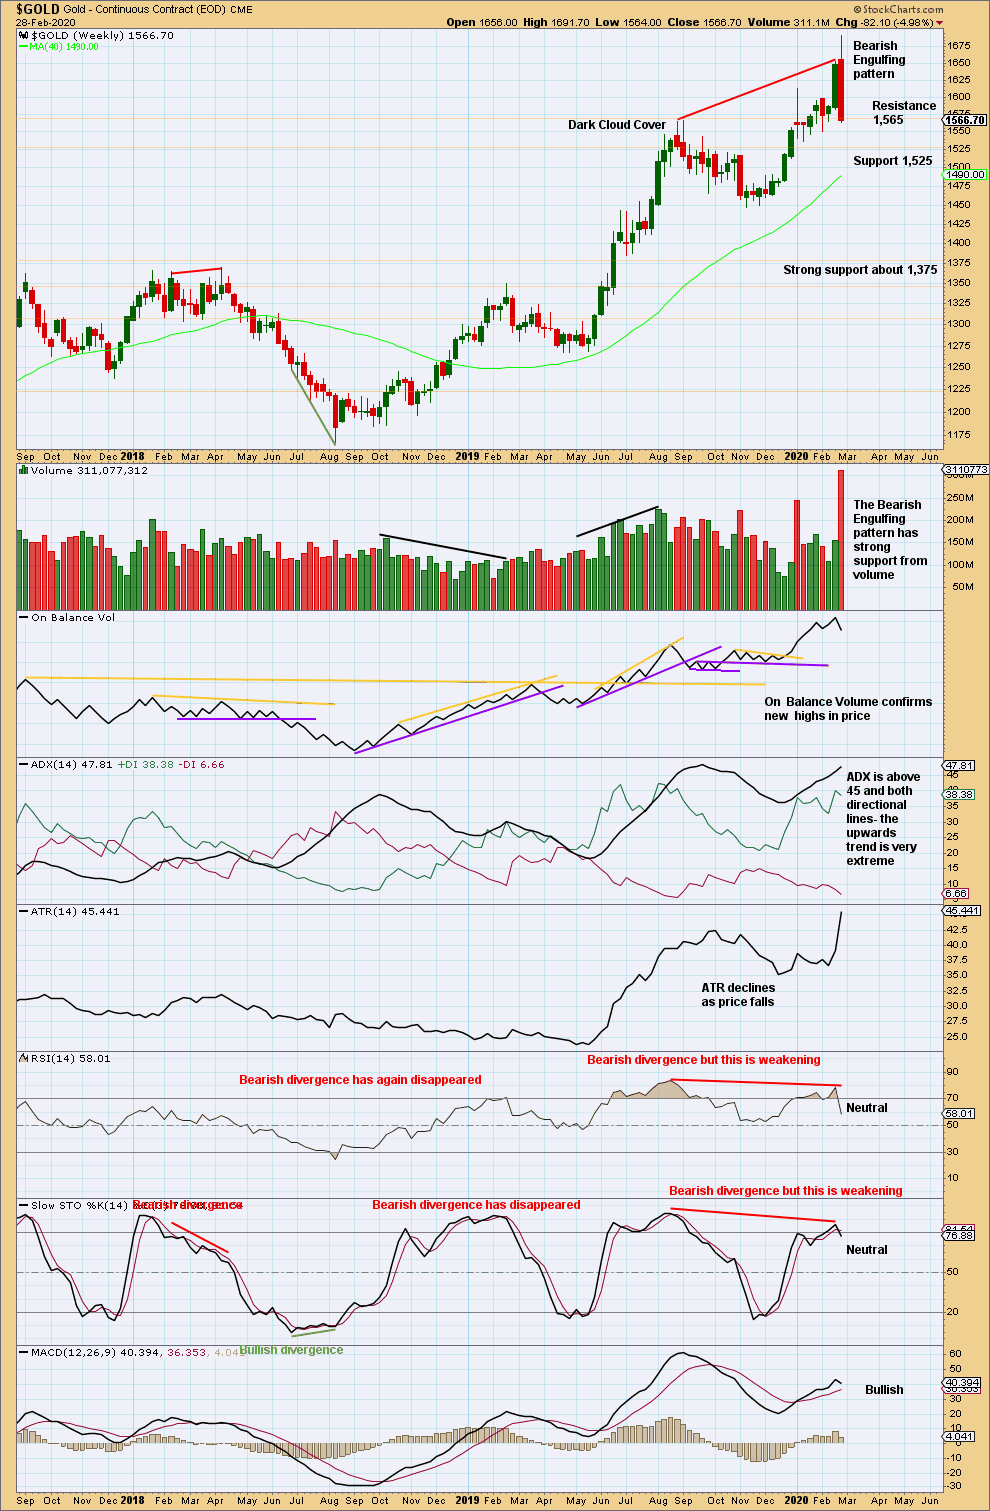
Click chart to enlarge. Chart courtesy of StockCharts.com.
After an upwards trend reached very extreme and RSI reached overbought then exhibited bearish divergence, a very strong bearish candlestick reversal pattern should be given weight. A trend change here now looks extremely likely.
DAILY CHART
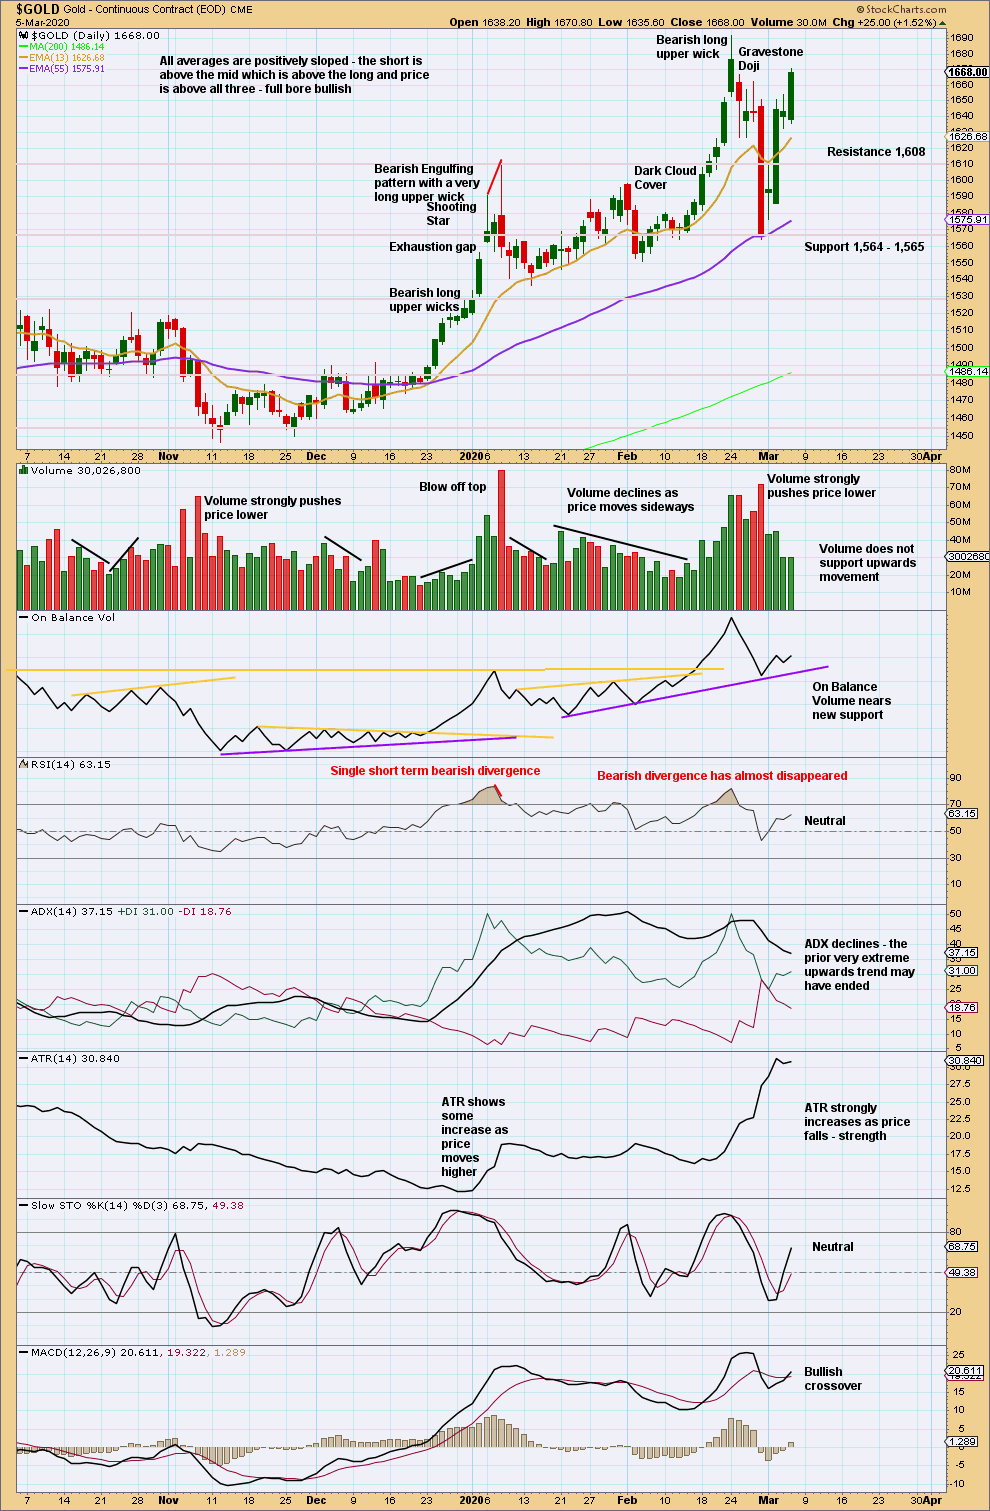
Click chart to enlarge. Chart courtesy of StockCharts.com.
An extremely strong bearish candlestick for Friday gives confidence that a sustainable high now looks likely to be in place.
Do not expect price to continue to move in a straight line. There will be bounces and consolidations along the way. If price reaches an area of support when Stochastics reaches oversold, then expect a bounce.
Bounces in a downwards trend are opportunities to join the trend.
Volume data for this last session shows a very slight increase beyond the prior session, but overall volume remains relatively light. Volume at this stage suggests upwards movement may be a counter trend movement, but this could still change.
Extreme conditions have been relieved. If price makes new highs here, then it may move a reasonable distance before conditions are again extreme.
GDX WEEKLY CHART
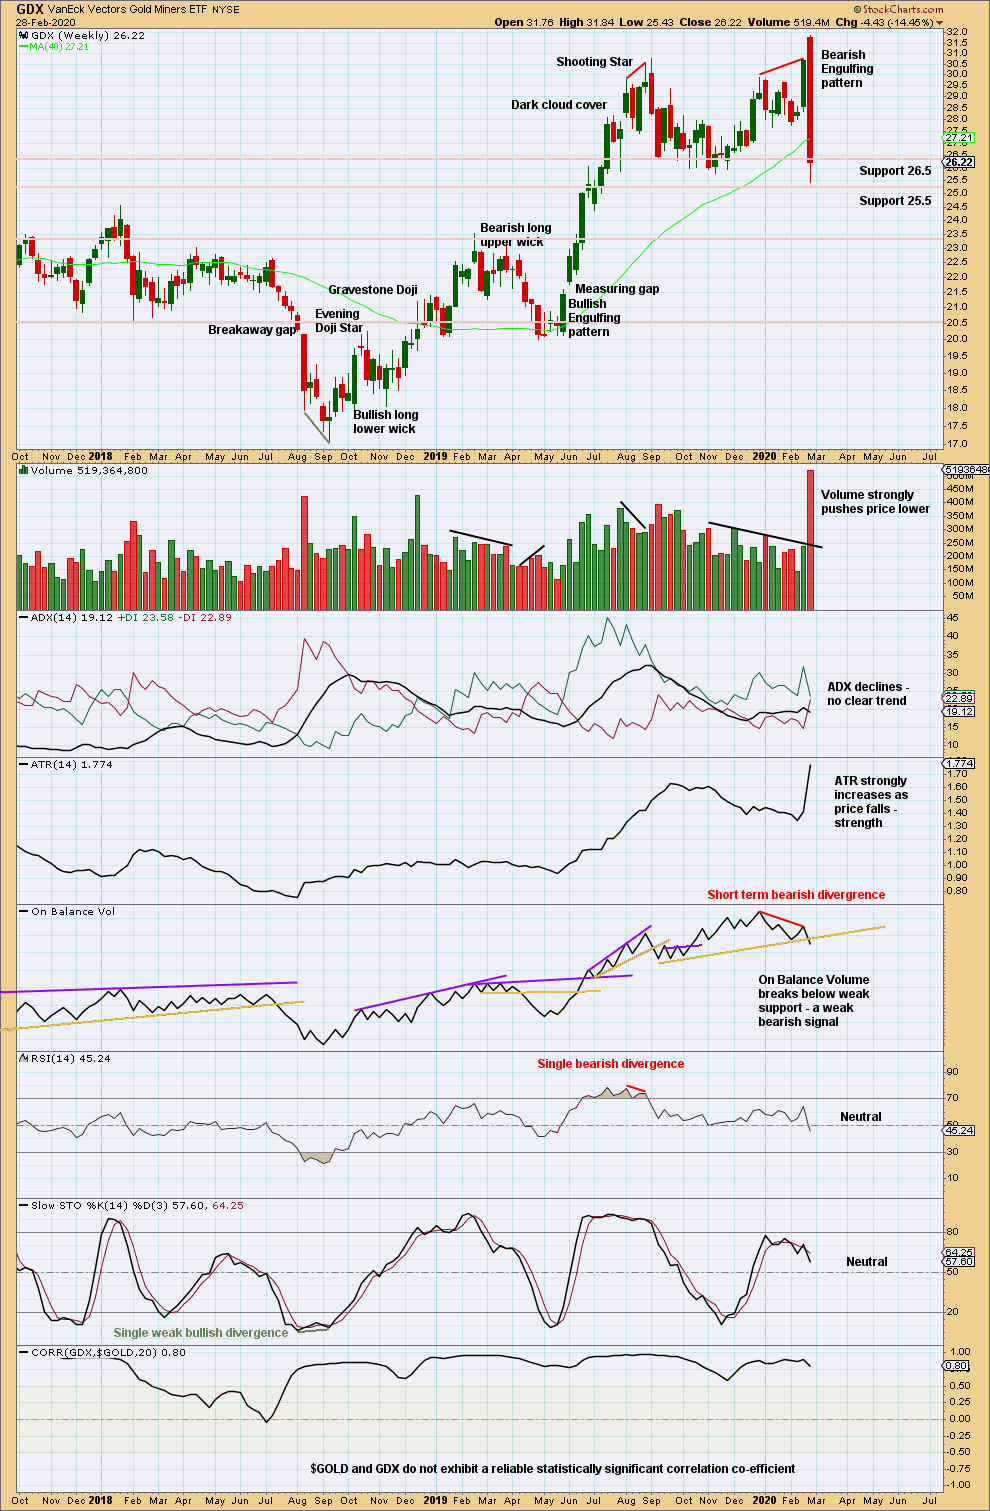
Click chart to enlarge. Chart courtesy of StockCharts.com.
GDX has had a trend change. Look for bounces and consolidations to possibly arrive about identified support areas.
GDX DAILY CHART
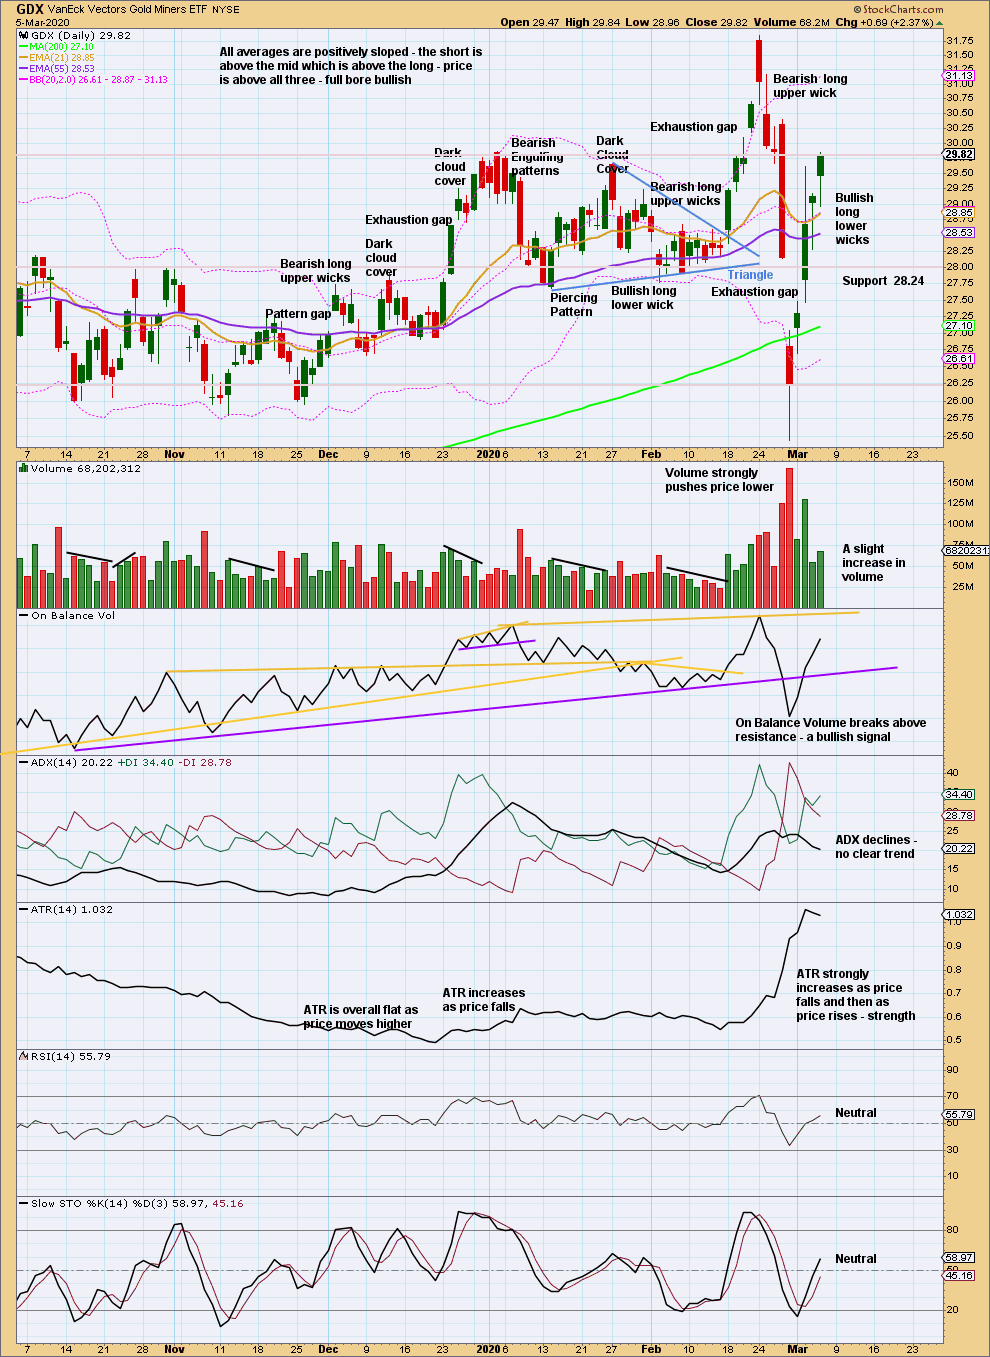
Click chart to enlarge. Chart courtesy of StockCharts.com.
Another reasonably strong upwards day with another long lower wick suggests more upwards movement tomorrow. So far volume remains relatively light, so upwards movement may be limited.
Published @ 06:40 p.m. EST.
—
Careful risk management protects your trading account(s).
Follow my two Golden Rules:
1. Always trade with stops.
2. Risk only 1-5% of equity on any one trade.
—
New updates to this analysis are in bold.
Hourly chart updated:
The target remains the same. I’ll be calculating targets for the bull count as well.
It looks like an ending expanding diagonal to me (broadening top, megaphone).
Thanks
Volume is up and it’s in positive territory for the moment.
1/2 1/2 3 down soon, I think.
Nope. Counted wrong. E over down now for megaphone pattern.
New high, barely. !736?
Megaphone pattern? Top in I think.
Long term you think ?
Who knows? However, I’m leaning toward bull count.