
GOLD: Elliott Wave and Technical Analysis | Charts – March 6, 2020
Barchart data has made a new high at the end of Friday’s session, but Stockcharts data has not
A new high invalidates the main Elliott wave count and confirms an alternate. Members were warned in last analysis that more upwards movement looked likely. The target is now the same for bull and bear wave counts.
Summary: A target for upwards movement to end is at 1,736.
Conditions are still extreme. This trend may reasonably be expected to end soon. If the target is wrong, it may be too high.
Grand SuperCycle analysis is here.
Monthly charts were last updated here.
BEARISH ELLIOTT WAVE COUNT
WEEKLY CHART
Click chart to enlarge.
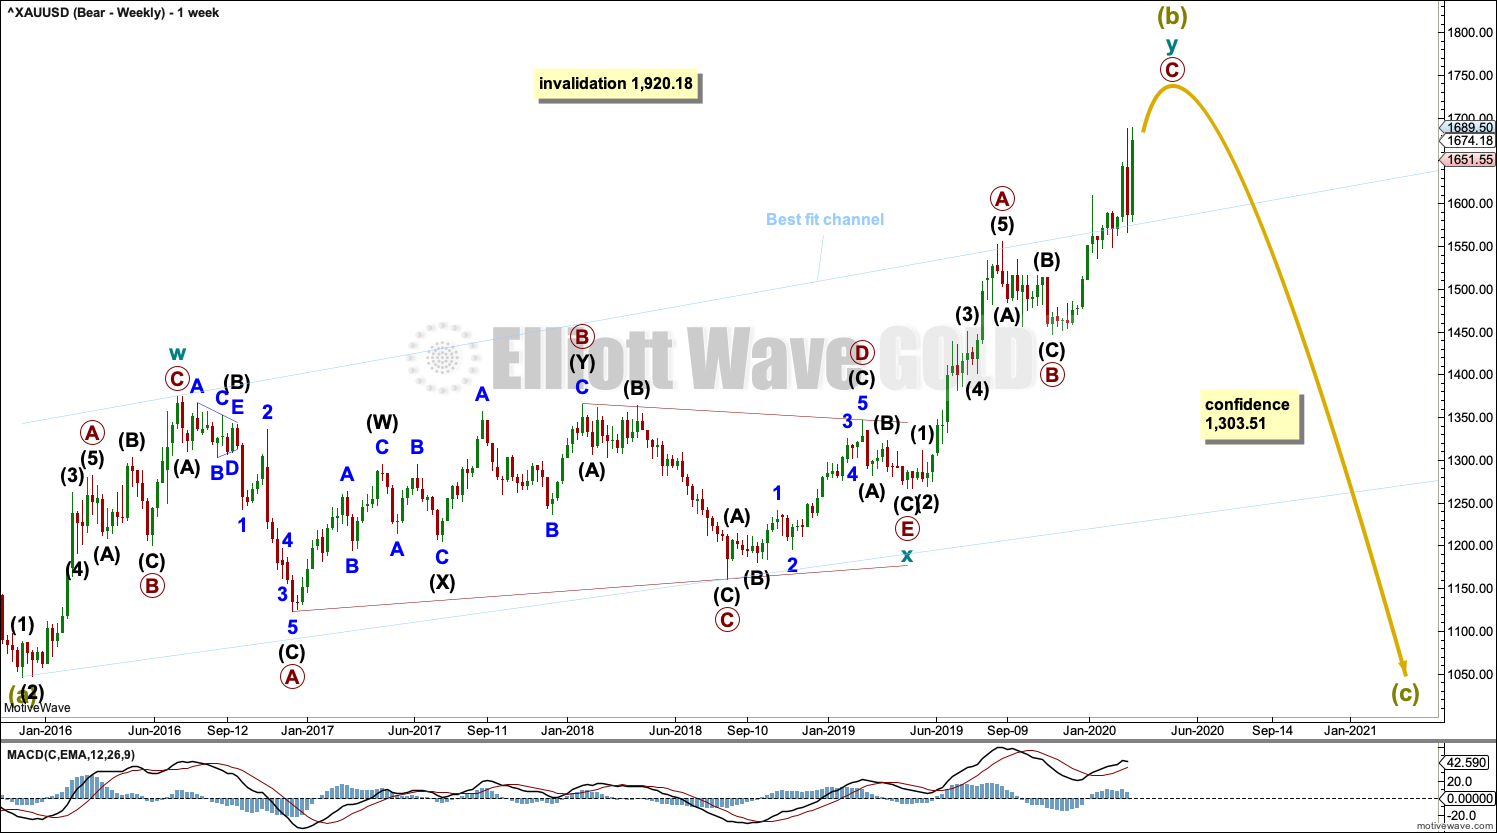
Super Cycle wave (b) may be an incomplete double zigzag.
The first zigzag in the double is labelled cycle wave w. The double is joined by a three in the opposite direction, a triangle labelled cycle wave x. The second zigzag in the double is labelled cycle wave y.
The purpose of the second zigzag in a double is to deepen the correction. Cycle wave y has achieved this purpose.
A wide best fit channel is added in light blue. Copy this channel over to daily charts. Price is now above the upper edge of this channel, which may now provide some support.
DAILY CHART
Click chart to enlarge.
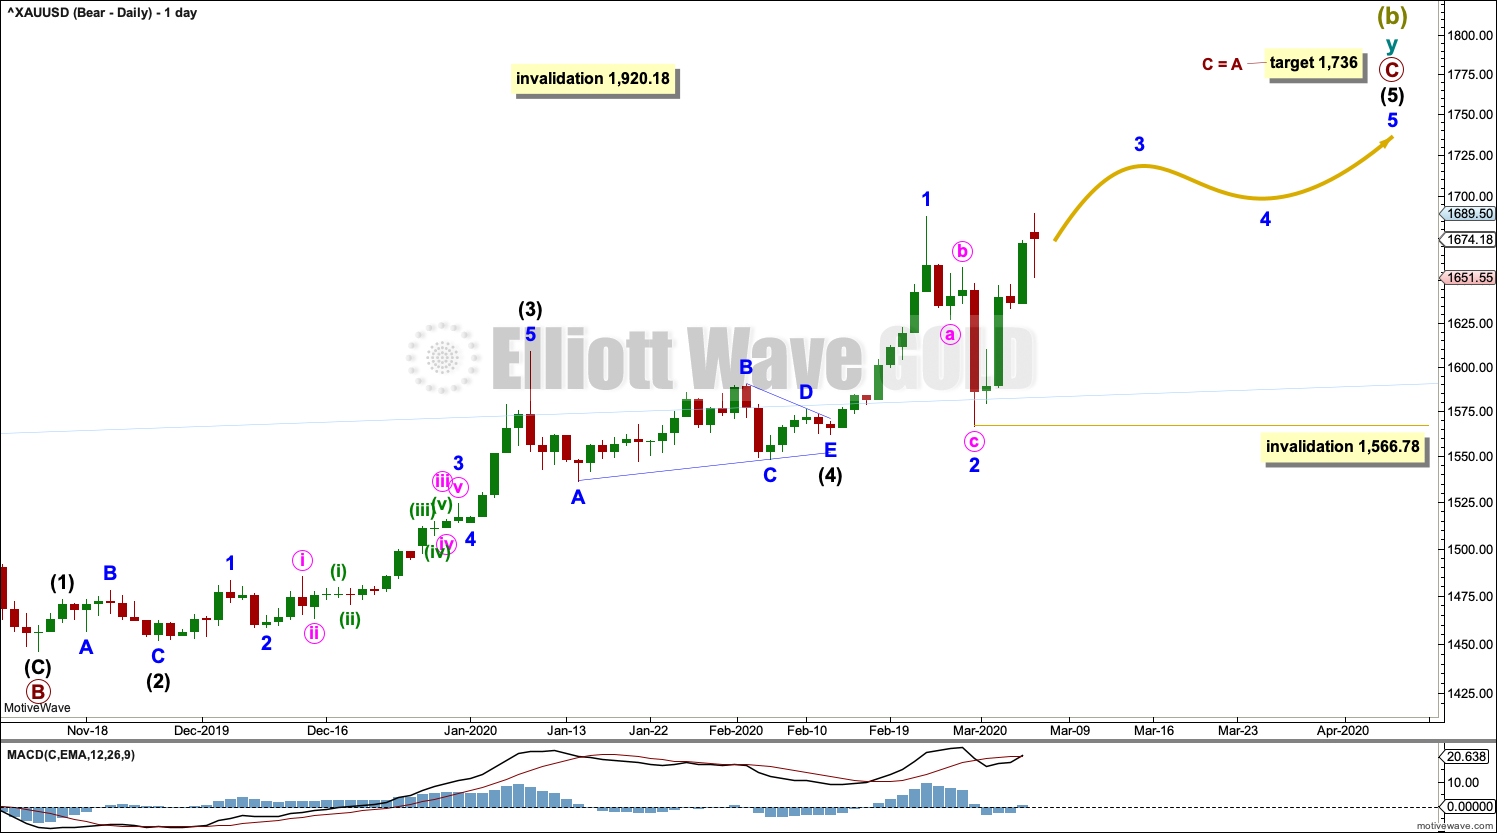
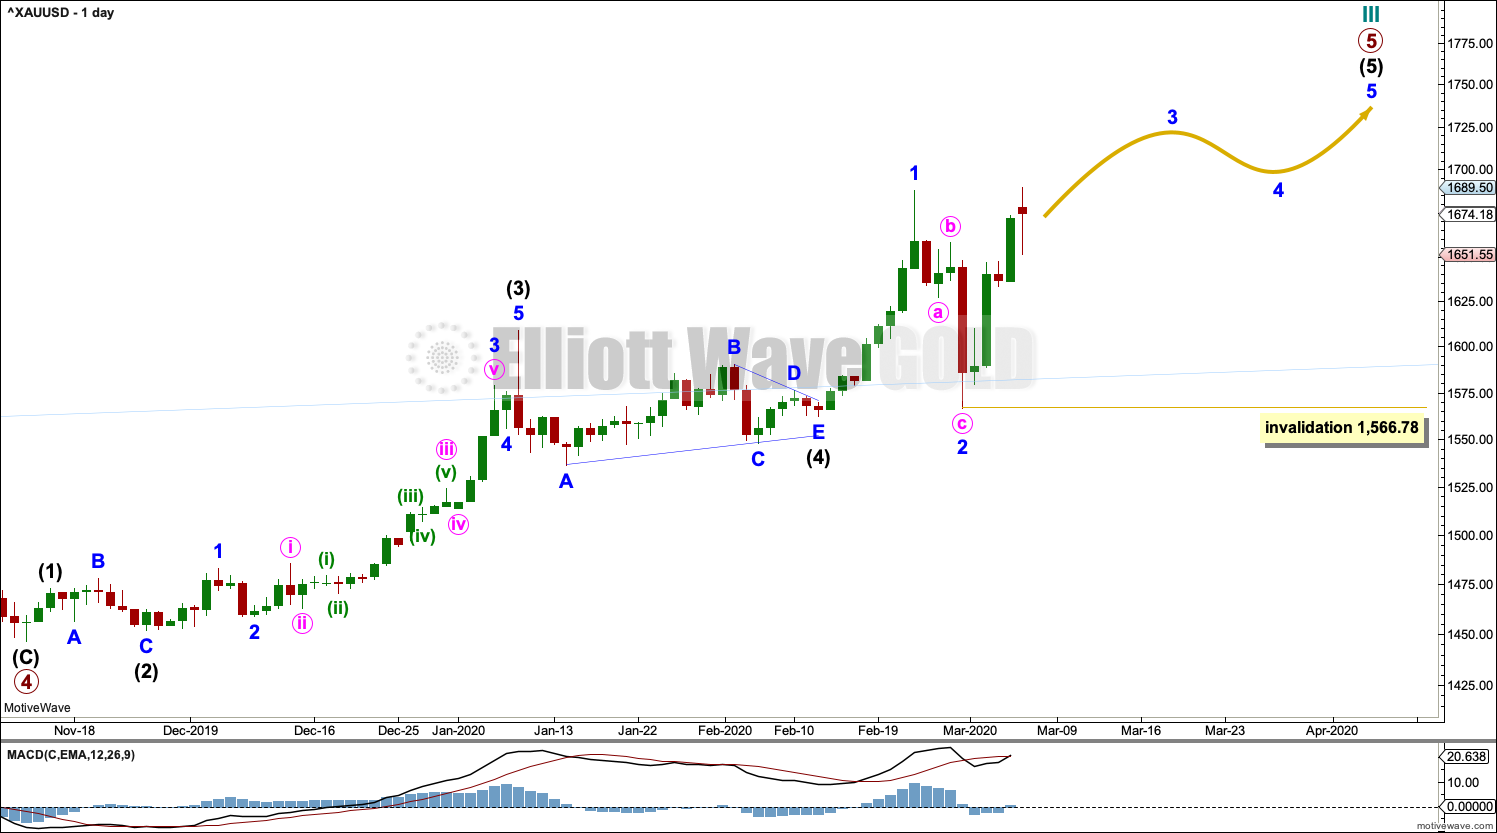
Super Cycle wave (b) may be incomplete.
The second zigzag in the double, labelled cycle wave y, may be continuing higher. Within cycle wave y, primary wave C may be an incomplete five wave impulse. Within primary wave C, intermediate wave (5) may be an incomplete five wave impulse.
Within intermediate wave (5), minor waves 1 and 2 may be complete. Minor wave 3 may now move above the end of minor wave 1, and it must move far enough above this point to allow room for minor wave 4 to unfold and remain above minor wave 1 price territory.
The target expects primary waves A and C to exhibit the most common Fibonacci ratio.
Within minor wave 3, no second wave correction may move beyond its start below 1,566.78.
HOURLY CHART
Click chart to enlarge.
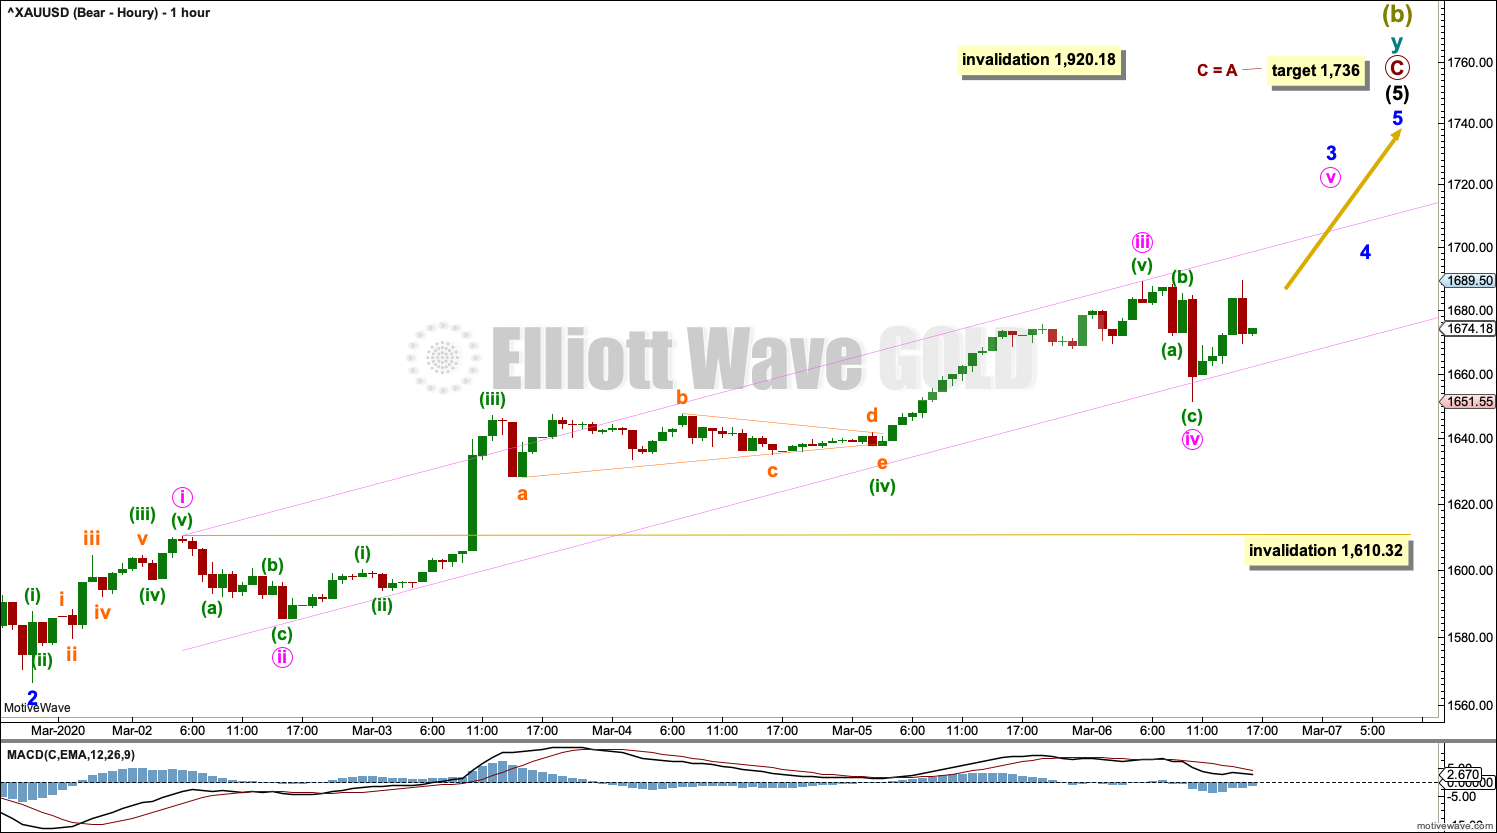
The hourly chart shows all of minor wave 3 so far.
Minor wave 3 may only subdivide as an impulse. Within minor wave 3, minute waves i, ii and iii may be complete. Minute wave iv may also be complete as labelled, or it may continue further. Minute wave iv may not move into minute wave i price territory below 1,610.32.
Draw an Elliott channel about the impulse of minor wave 3: draw the first trend line from the ends of minute waves i to iii, then place a parallel copy on the end of minute wave ii. So far minute wave iv remains contained within the channel, which suggests minute wave iv is fairly likely to be over.
Minute wave v may exhibit strength as it is a fifth wave to end a third wave impulse. Minute wave iv may break above the upper edge of the Elliott channel.
BULLISH ELLIOTT WAVE COUNT
WEEKLY CHART
Click chart to enlarge.
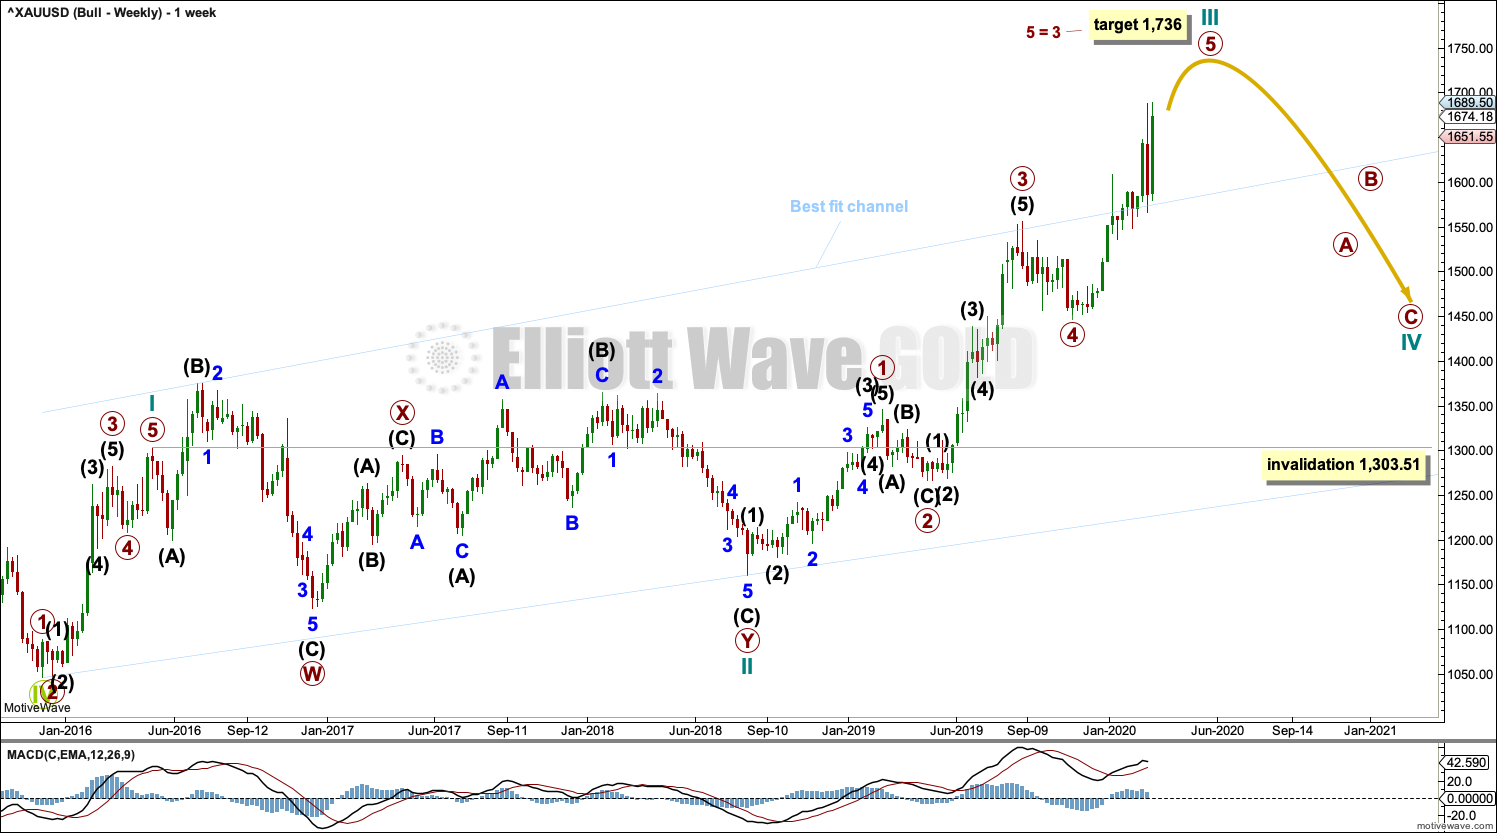
This wave count sees the the bear market complete at the last major low for Gold on 3 December 2015.
If Gold is in a new bull market, then it should begin with a five wave structure upwards on the weekly chart.
Cycle wave I fits as a five wave impulse with reasonably proportionate corrections for primary waves 2 and 4. This resolves a previous major problem with the bullish wave count.
Cycle wave II now fits as a double flat. However, a problem arises with the relabelling of this structure. Within the first flat correction labelled primary wave W, this wave count now needs to ignore what looks like an obvious triangle from July to September 2016 (this can be seen labelled as a triangle on the bear wave count above). This movement must now be labelled as a series of overlapping first and second waves.
Within the first flat correction labelled primary wave W of the double flat of cycle wave II, intermediate wave (B) is 1.69 the length of intermediate wave (A). This is longer than the common range of up to 1.38, but within an allowable guideline of up to 2. The length of intermediate wave (B) reduces the probability of this wave count.
Cycle wave III may be incomplete. When it arrives, cycle wave IV may not move into cycle wave I price territory below 1,303.51.
DAILY CHART
Click chart to enlarge.
Cycle wave III may be incomplete. Intermediate wave (5) within primary wave 5 may be extending higher.
Within intermediate wave (5), minor waves 1 and 2 may be complete.
Minor wave 3 must move far enough above the end of minor wave 1 to allow room for minor wave 4 to unfold and remain above minor wave 1 price territory.
Within minor wave 3, no second wave correction may move beyond its start below 1,566.78.
TECHNICAL ANALYSIS
WEEKLY CHART
Click chart to enlarge. Chart courtesy of StockCharts.com.
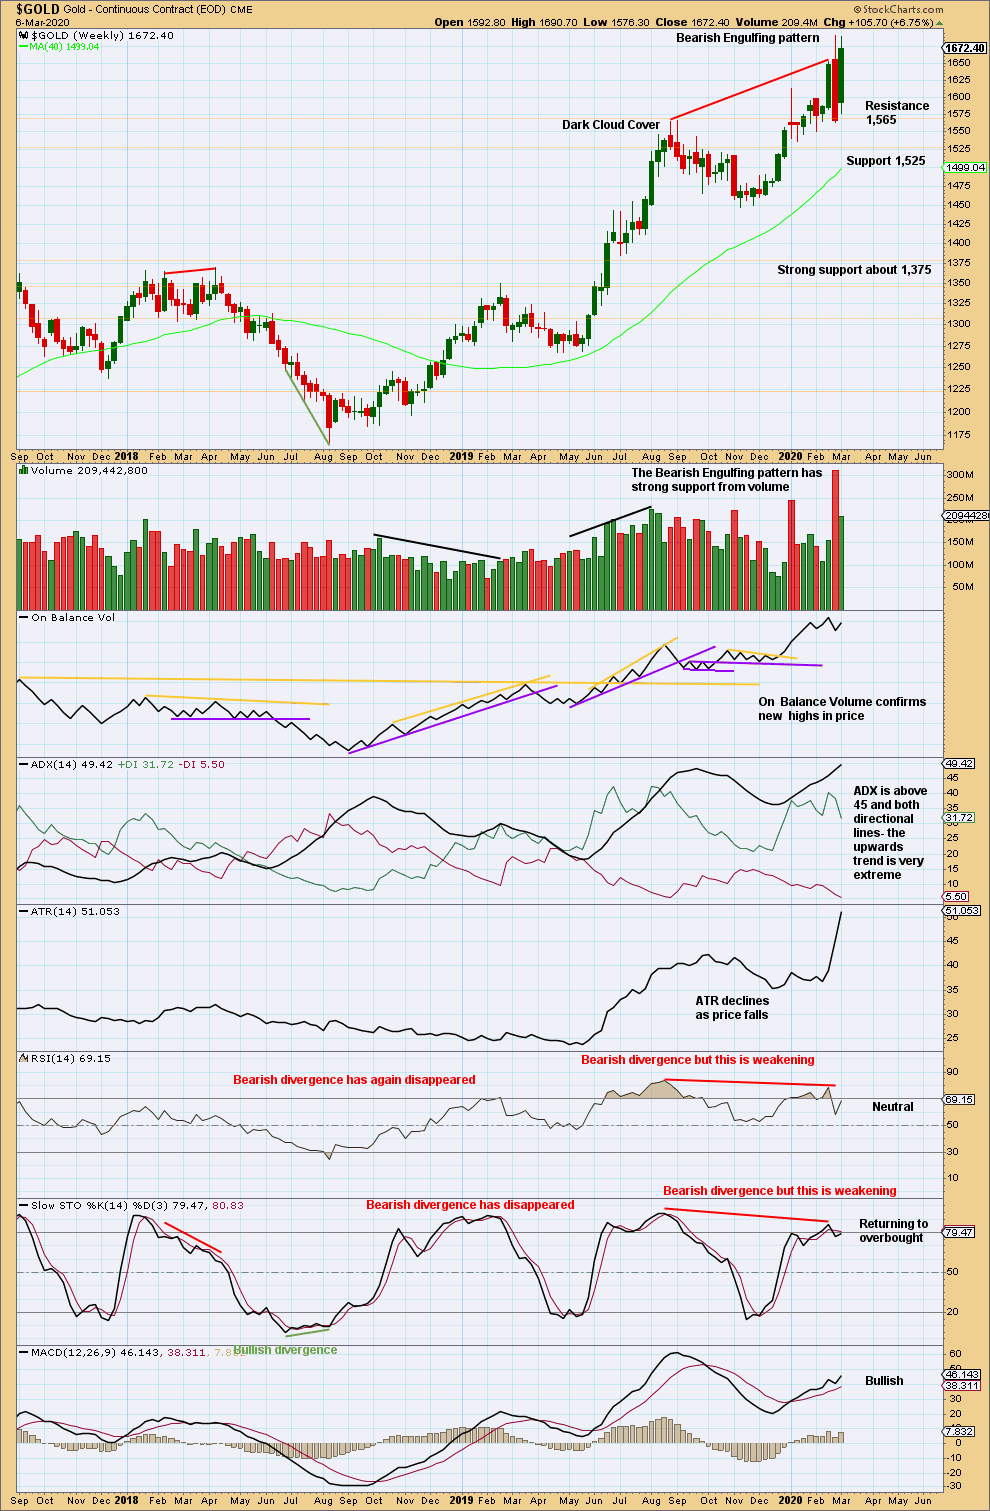
The upwards trend remains very extreme. The risk of a deep pullback or a large consolidation, or a 180° trend change, is high.
DAILY CHART
Click chart to enlarge. Chart courtesy of StockCharts.com.
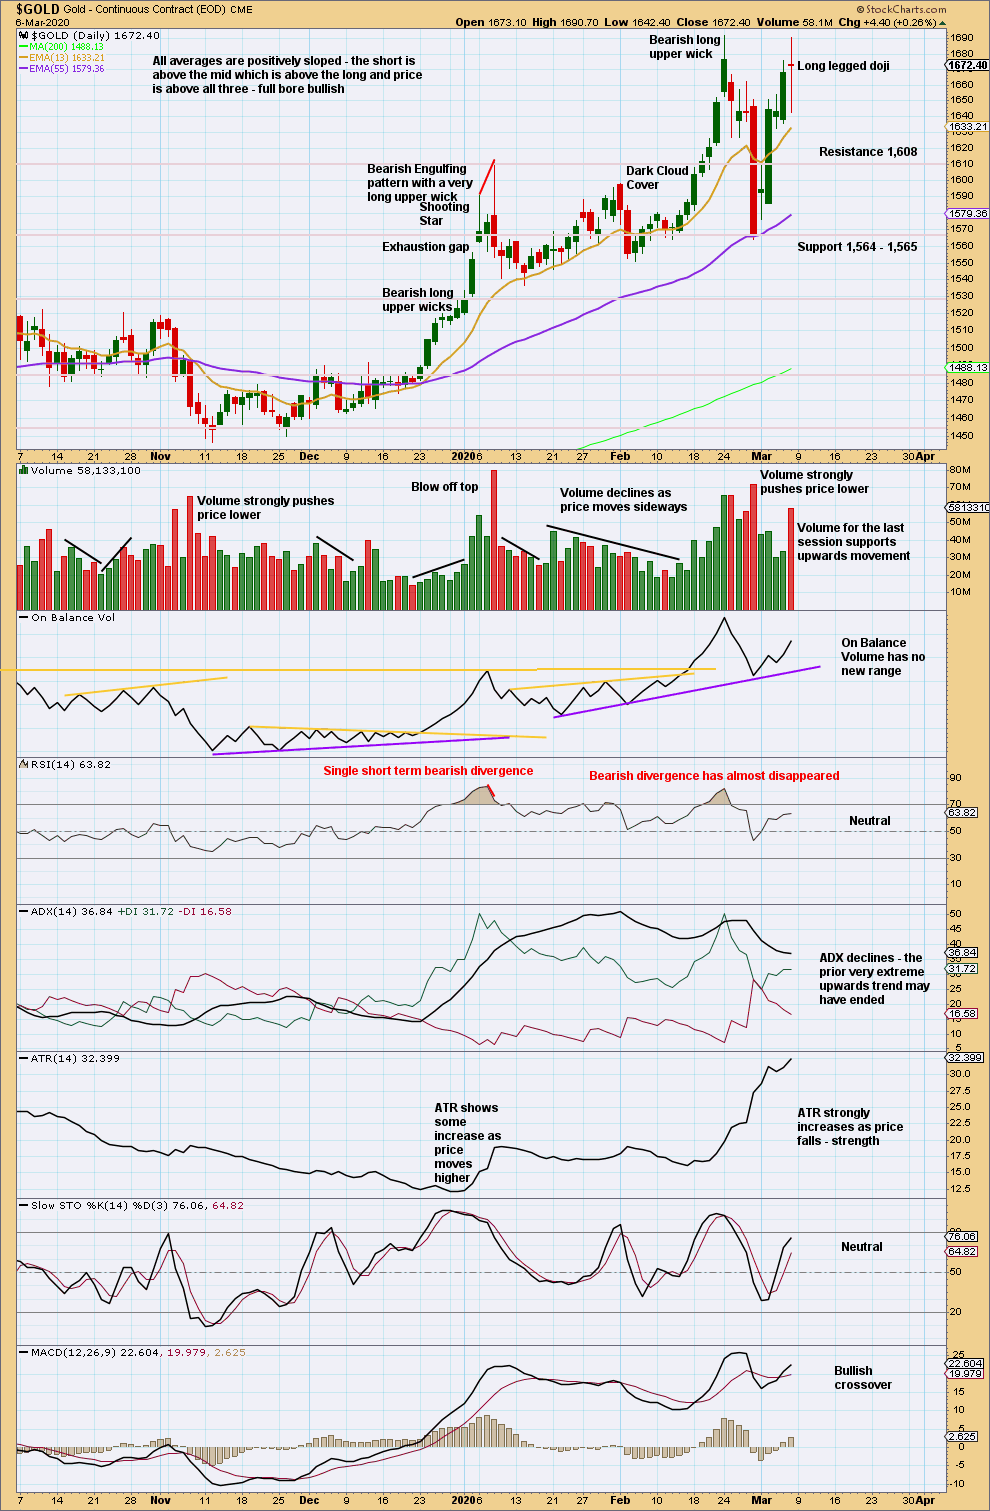
While Stockcharts data has not made a new high, Barchart data has. When there is a discrepancy between these two data feeds, it is usually resolved in the direction of the more extreme data.
Volume supports upwards movement. With ADX now declining, if it turns to increase, the trend may not be extreme at this time frame. Conditions are no longer overbought. There is room for upwards movement to continue.
GDX WEEKLY CHART

Click chart to enlarge. Chart courtesy of StockCharts.com.
GDX is a reasonable distance off new highs. The last signal was very bearish from a strong Bearish Engulfing pattern.
GDX DAILY CHART
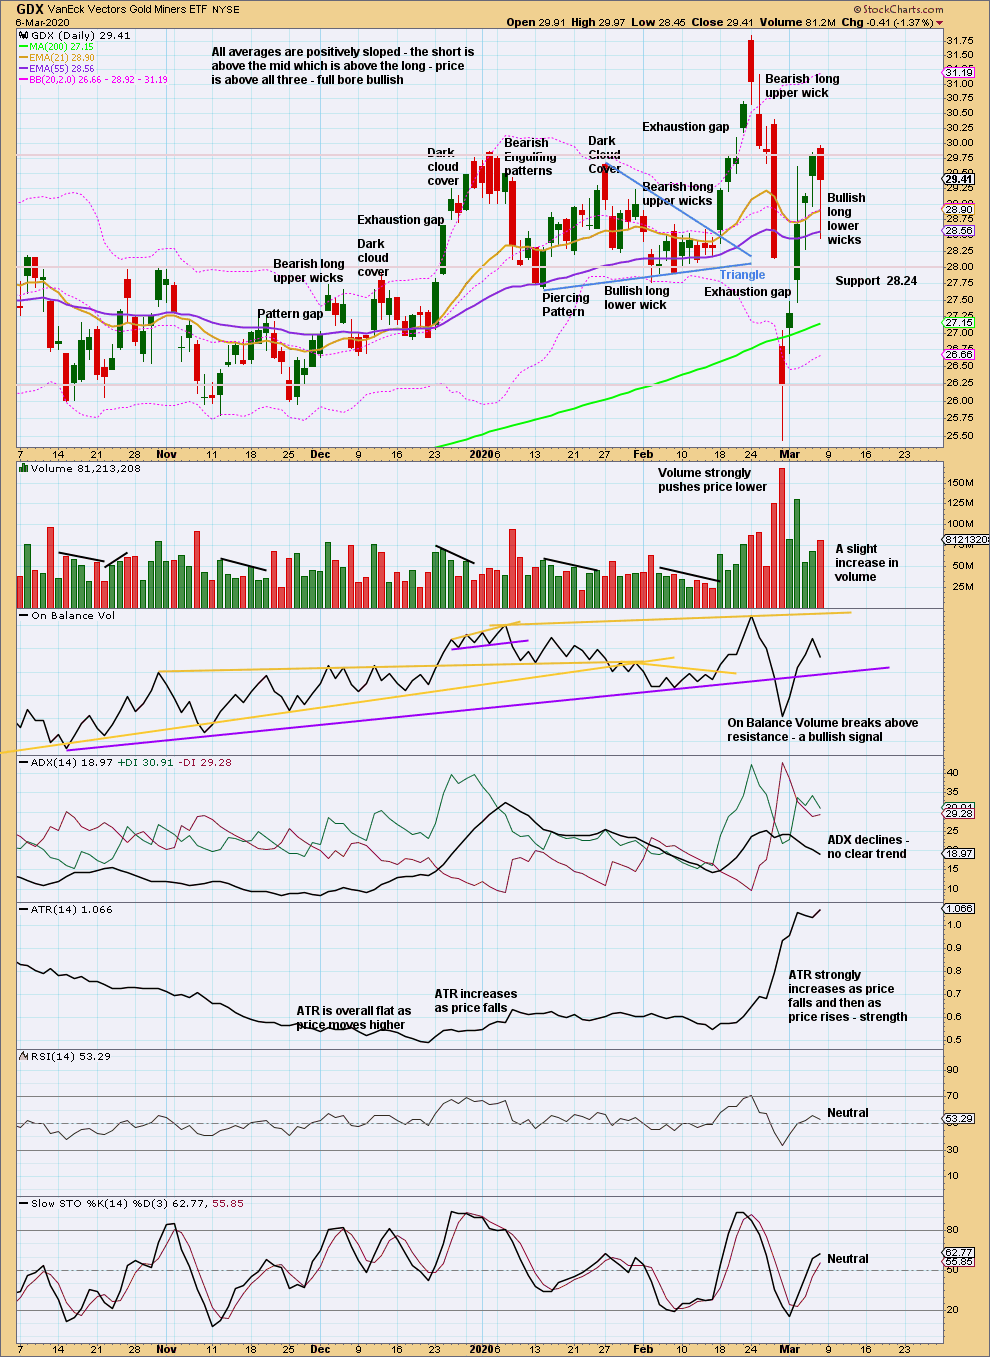
Click chart to enlarge. Chart courtesy of StockCharts.com.
Now three long lower wicks in a row suggest more upwards movement. Volume offers a little support to upwards movement.
Published @ 06:21 p.m. EST.
—
Careful risk management protects your trading account(s).
Follow my two Golden Rules:
1. Always trade with stops.
2. Risk only 1-5% of equity on any one trade.
—
New updates to this analysis are in bold.
I see a nice right shoulder today.
Relabeled. Fits ew rules. Just saying!
Andrew, I see what you are trying to do, and this does “look” better as a broadening top formation. However, if you are going to call it an expanding ending diagonal, all EW rules must be followed. Did you check the wave lengths?
Wave 3 must be longer than wave 1. Using Trading View data, it is not longer. What does your data say?
I think but, my knowledge of the rules is limited.
These are the rules for expanding diagonals (both leading and ending):
– wave 3 must be longer than wave 1
– wave 4 must be longer than wave 2
– wave 5 must be longer than wave 3
– wave 4 must overlap wave 1 price territory
– wave 4 may not move beyond the end of wave 2
In addition, the following rules for ending diagonals applies in your example:
– all subwaves must subdivide as zigzags
For members learning EW rules I recommend a copy of the text “Elliott Wave Principle” by Frost and Prechter. There is a list of all the rules and guidelines on (I think) page 89 and on, ordered by structure. Use that list as a check list when you label an EW structure and you’ll soon learn the rules by heart, and it’ll make sure you’re not working with invalid counts
My idea is no more!
Notice to members for the next week:
I am travelling in Panama on an orientation tour this week. I will probably not be able to provide updated hourly charts prior to session close during this week.
If on any day this week I am able to provide end of session updates I will do so.
I thank you for your patience and understanding. Normal bonus updates shall resume next week.
Another idea, ending expanding diagonal.
Pretty sure Wave 4 can’t go beyond the end of wave 2 in an expanding ending diagonal.
You might be able to label it an expanding triangle which would be a continuation pattern
The main rules for an ending diagonal
This pattern subdivides into five waves.
Wave 2 never ends beyond the starting point of wave 1.
Wave 3 always breaks the ending point of wave 1.
Wave 4 usually breaks beyond the ending point of wave 1.
Wave 5 in the absolute majority of cases breaks the ending point of wave 3.
I copied that from elliotwave rules. The main idea here is that the increasing volatility scares investors and breaks the trend. It looks to me like it could happen here.
Wave 4 of a diagonal may not move beyond the end of wave 2. Which is why that example is not a diagonal.
It could however be an expanding triangle, but that is labelled with letters A-B-C-D-E
Andrew, if you’re going to quote EW rules, it’s best to go by the source that Lara uses, which is by Robert Prechter, Jr., the author of the Elliott Wave Principal. The rules you list are incomplete. Furthermore, an ending expanding diagonal in a bull trend needs to slope upward. Your chart has a sideways look.
I am attaching a picture from the book for the rules. I hope this helps.
Thanks Dreamer.
IMO the rules outlined in Elliott Wave Principle by Frost and Prechter should be the ones used because they are based directly on Elliott’s work.
There are a great many other listed rules for EW online. And in various textbooks too. They may differ from Elliott’s original work.
It is my opinion that if the rules are re-written then any rewriting should be based upon reasonable research and evidence. But I have yet to see any differing rules based upon much more than… a feeling or hunch. Not on solid evidence.
You are correct. The pattern does conform to non Elliot wave patterns such as broadening top and/or megaphone pattern. We will see what the outcome is soon. Busted wanted to present an alternative view., since the short term bull and bear case look the same.