
GOLD: Elliott Wave and Technical Analysis | Charts – March 9, 2020
The Elliott wave target remains the same, and is the same for both bullish and bearish Elliott wave counts.
Summary: A target for upwards movement to end is at 1,736.
Conditions are still extreme. This trend may reasonably be expected to end soon. If the target is wrong, it may be too high.
Grand SuperCycle analysis is here.
Monthly charts were last updated here.
BEARISH ELLIOTT WAVE COUNT
WEEKLY CHART

Click chart to enlarge.
Super Cycle wave (b) may be an incomplete double zigzag.
The first zigzag in the double is labelled cycle wave w. The double is joined by a three in the opposite direction, a triangle labelled cycle wave x. The second zigzag in the double is labelled cycle wave y.
The purpose of the second zigzag in a double is to deepen the correction. Cycle wave y has achieved this purpose.
A wide best fit channel is added in light blue. Copy this channel over to daily charts. Price is now above the upper edge of this channel, which may now provide some support.
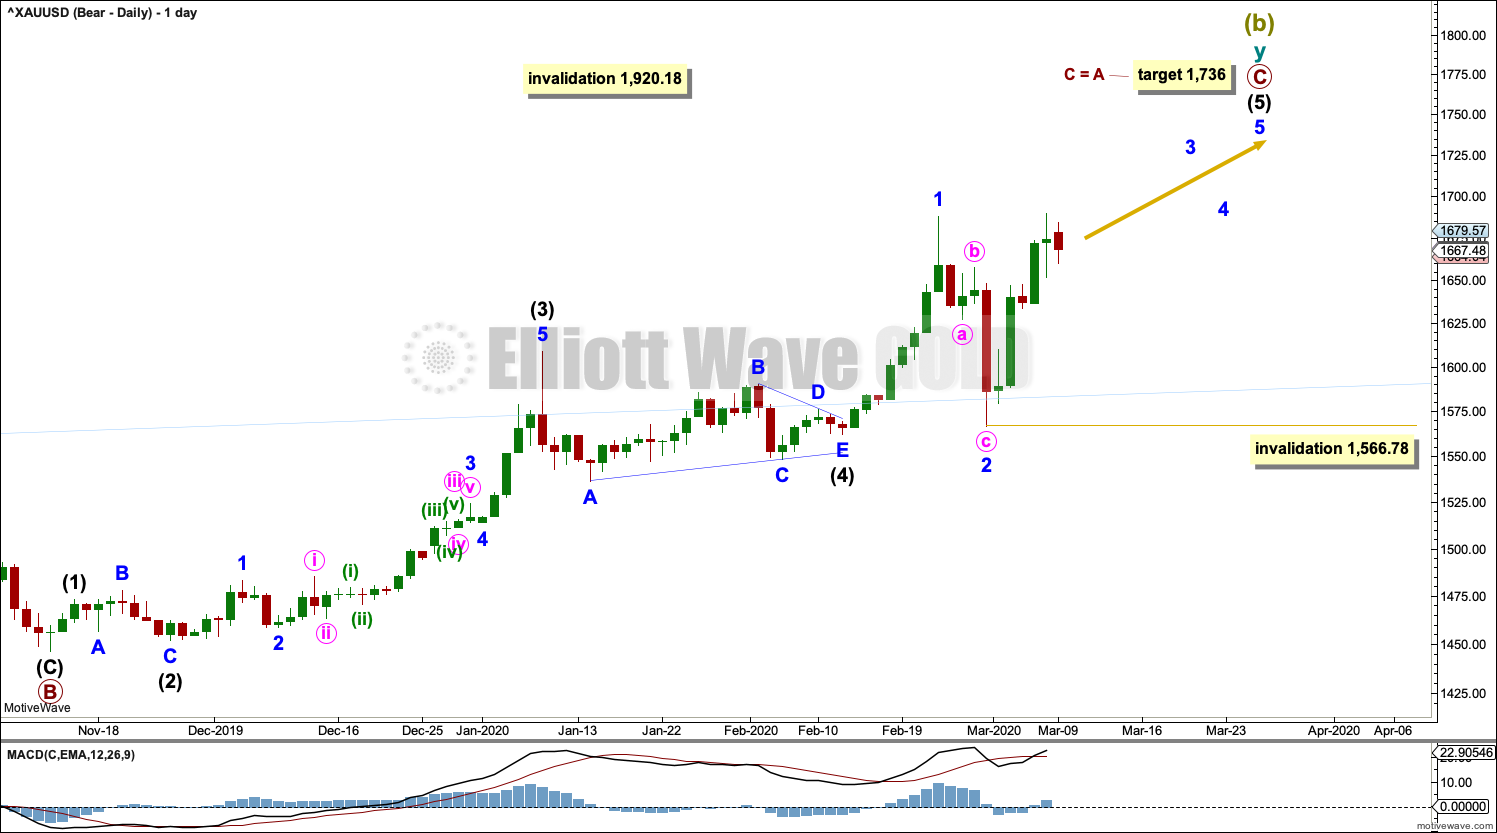
DAILY CHART
Click chart to enlarge.
Super Cycle wave (b) may be incomplete.
The second zigzag in the double, labelled cycle wave y, may be continuing higher. Within cycle wave y, primary wave C may be an incomplete five wave impulse. Within primary wave C, intermediate wave (5) may be an incomplete five wave impulse.
Within intermediate wave (5), minor waves 1 and 2 may be complete. Minor wave 3 may now move above the end of minor wave 1, and it must move far enough above this point to allow room for minor wave 4 to unfold and remain above minor wave 1 price territory. So far it has not done this, so further upwards movement would be needed to complete the structure if this wave count is correct.
The target expects primary waves A and C to exhibit the most common Fibonacci ratio.
Within minor wave 3, no second wave correction may move beyond its start below 1,566.78.
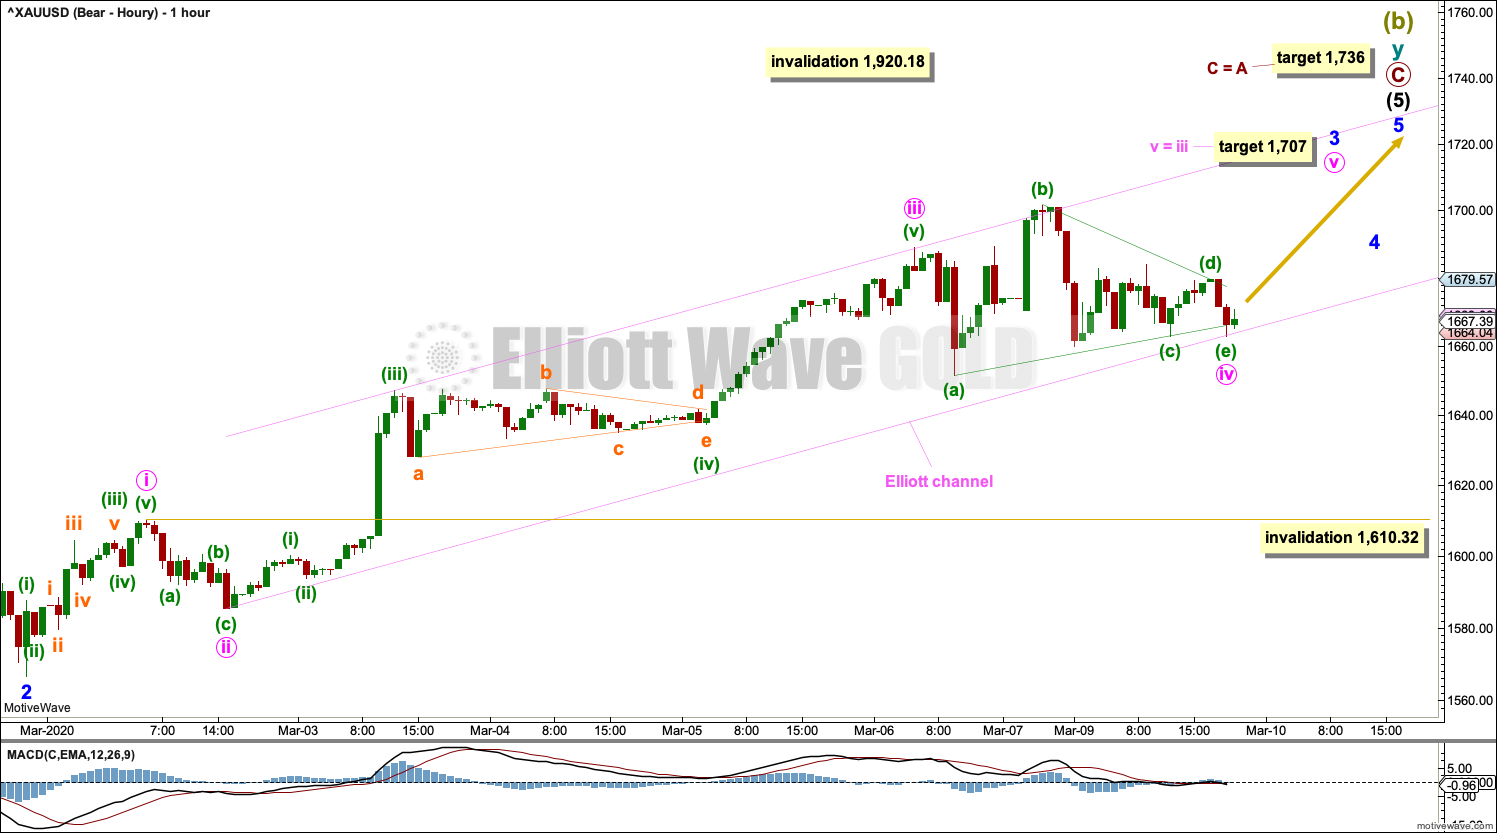
HOURLY CHART
Click chart to enlarge.
The hourly chart shows all of minor wave 3 so far.
Minor wave 3 may only subdivide as an impulse. Within minor wave 3, minute waves i to iv may be complete. Minute wave iv may be complete as labelled, or it may continue further. Minute wave iv may not move into minute wave i price territory below 1,610.32.
Re-draw an Elliott channel about the impulse of minor wave 3 using Elliott’s second technique: draw the first trend line from the ends of minute waves ii to iv, then place a parallel copy on the end of minute wave iii. Minute wave v may find resistance at the upper edge of this channel.
A target is calculated for minute wave v to end based upon the most common Fibonacci ratio for a fifth wave. This target would allow enough room for a very shallow correction for minor wave 4 to unfold.
Minute wave v may exhibit strength as it is a fifth wave to end a third wave impulse. Minute wave iv may break above the upper edge of the Elliott channel.
BULLISH ELLIOTT WAVE COUNT
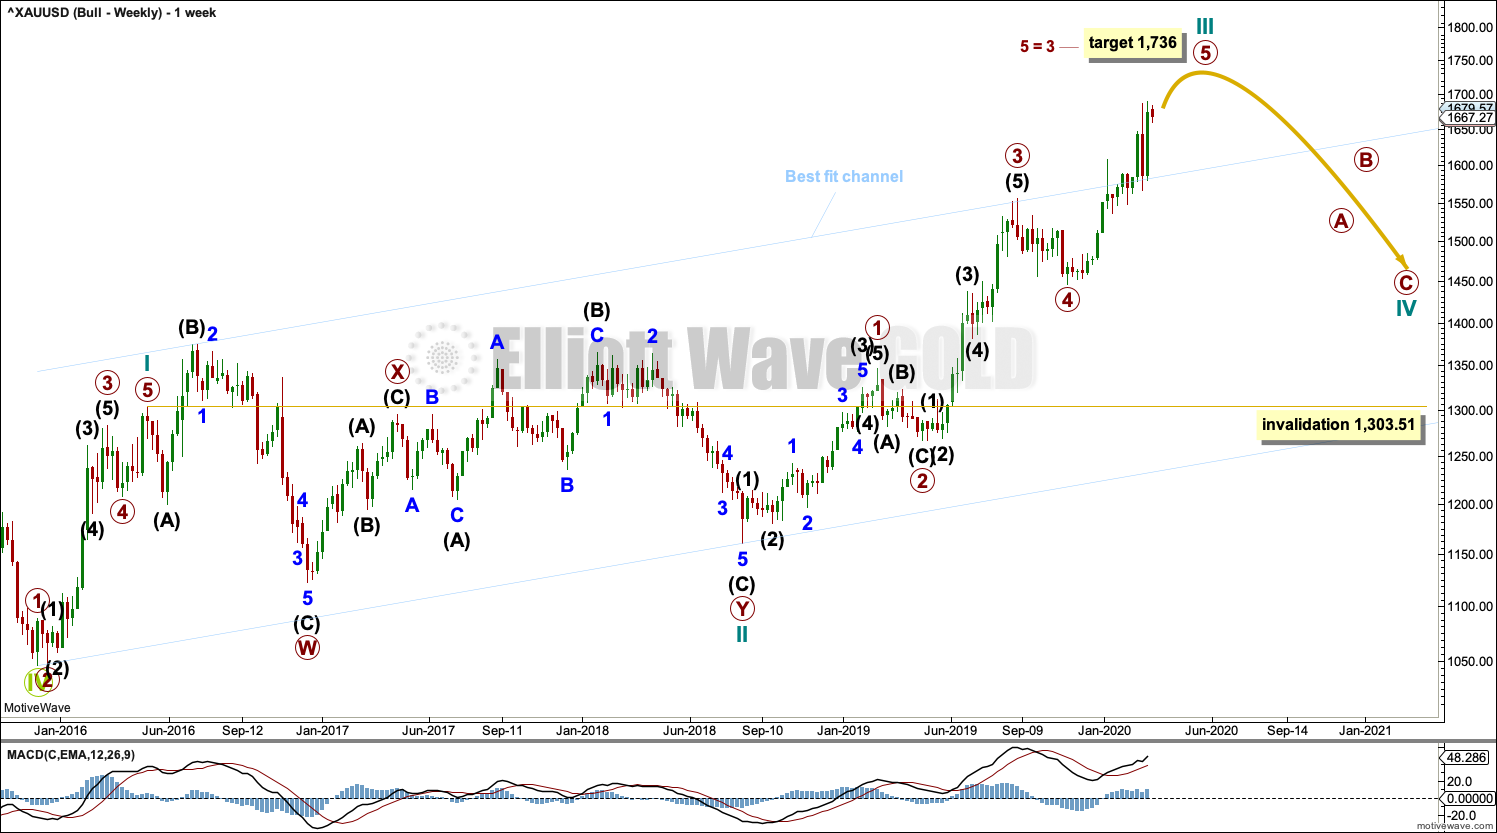
WEEKLY CHART
Click chart to enlarge.
This wave count sees the the bear market complete at the last major low for Gold on 3 December 2015.
If Gold is in a new bull market, then it should begin with a five wave structure upwards on the weekly chart.
Cycle wave I fits as a five wave impulse with reasonably proportionate corrections for primary waves 2 and 4. This resolves a previous major problem with the bullish wave count.
Cycle wave II now fits as a double flat. However, a problem arises with the relabelling of this structure. Within the first flat correction labelled primary wave W, this wave count now needs to ignore what looks like an obvious triangle from July to September 2016 (this can be seen labelled as a triangle on the bear wave count above). This movement must now be labelled as a series of overlapping first and second waves.
Within the first flat correction labelled primary wave W of the double flat of cycle wave II, intermediate wave (B) is 1.69 the length of intermediate wave (A). This is longer than the common range of up to 1.38, but within an allowable guideline of up to 2. The length of intermediate wave (B) reduces the probability of this wave count.
Cycle wave III may be incomplete. When it arrives, cycle wave IV may not move into cycle wave I price territory below 1,303.51.
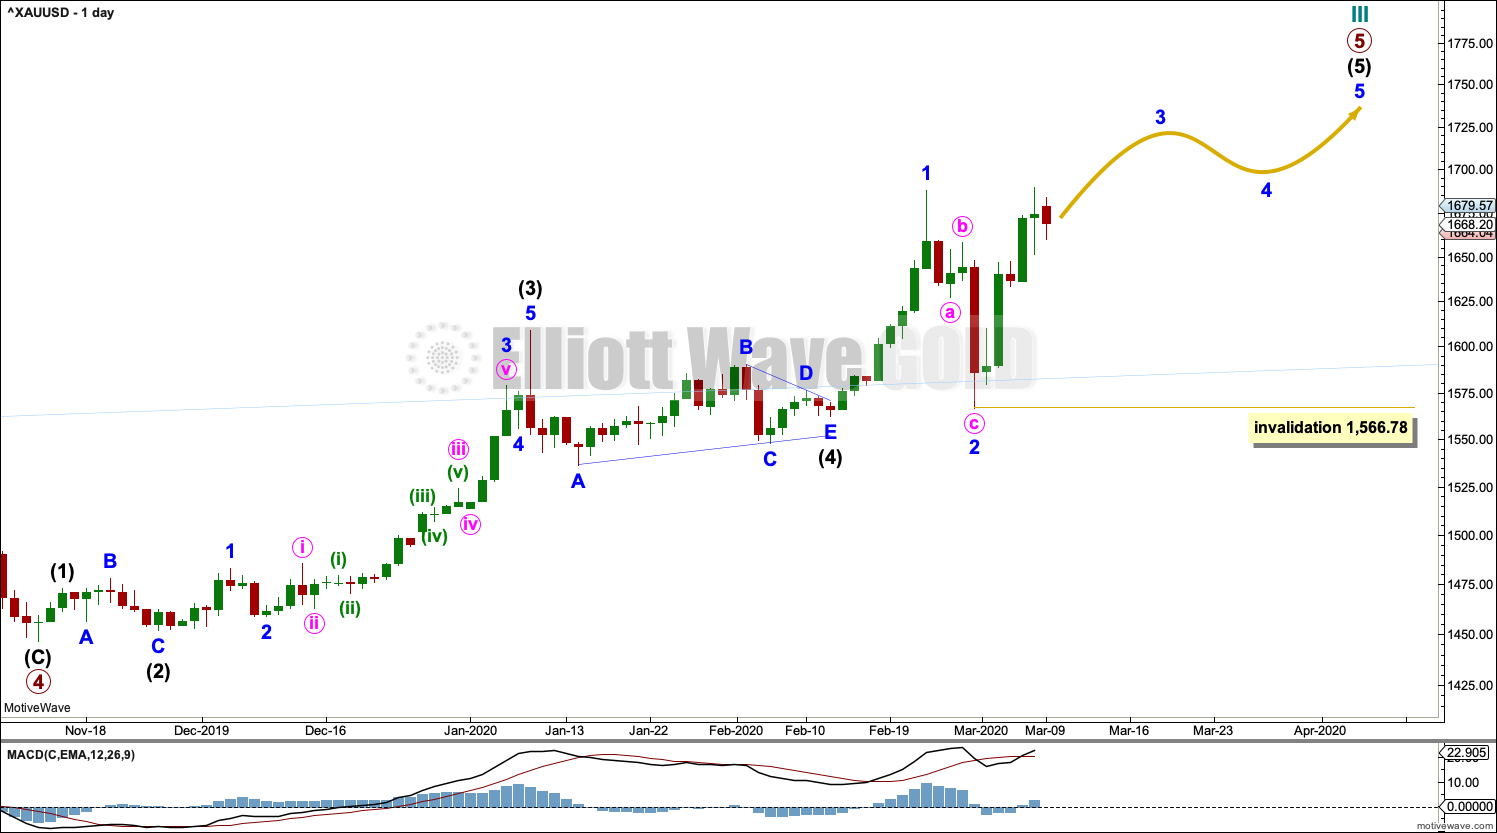
DAILY CHART
Click chart to enlarge.
Cycle wave III may be incomplete. Intermediate wave (5) within primary wave 5 may be extending higher.
Within intermediate wave (5), minor waves 1 and 2 may be complete.
Minor wave 3 must move far enough above the end of minor wave 1 to allow room for minor wave 4 to unfold and remain above minor wave 1 price territory.
Within minor wave 3, no second wave correction may move beyond its start below 1,566.78.
TECHNICAL ANALYSIS
WEEKLY CHART
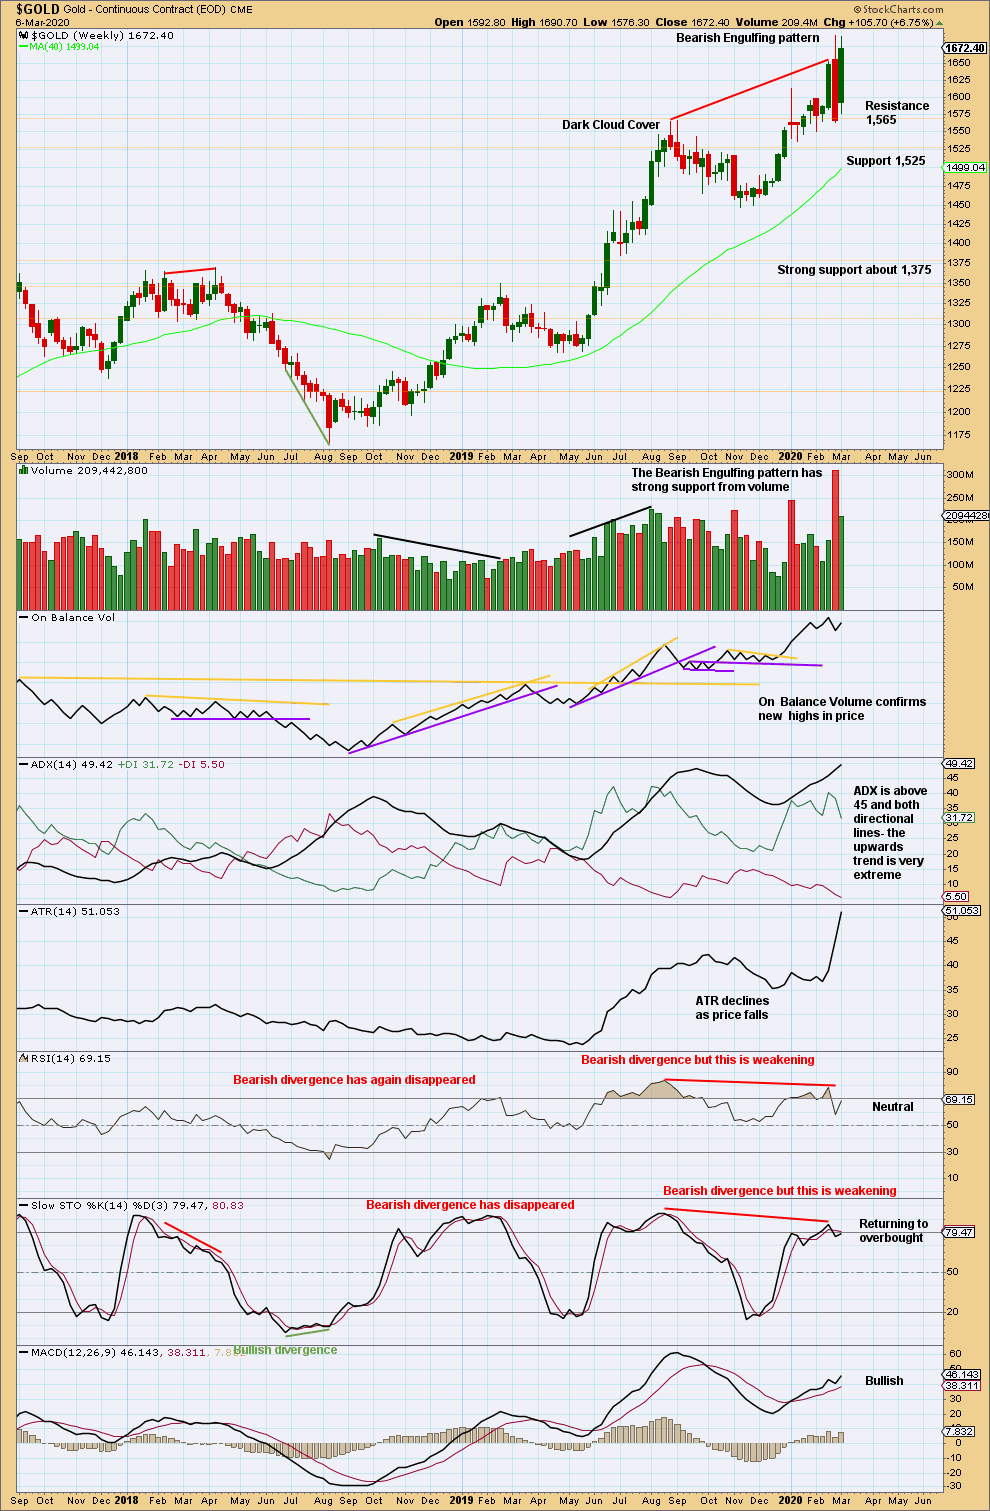
Click chart to enlarge. Chart courtesy of StockCharts.com.
The upwards trend remains very extreme. The risk of a deep pullback or a large consolidation, or a 180° trend change, is high.
DAILY CHART
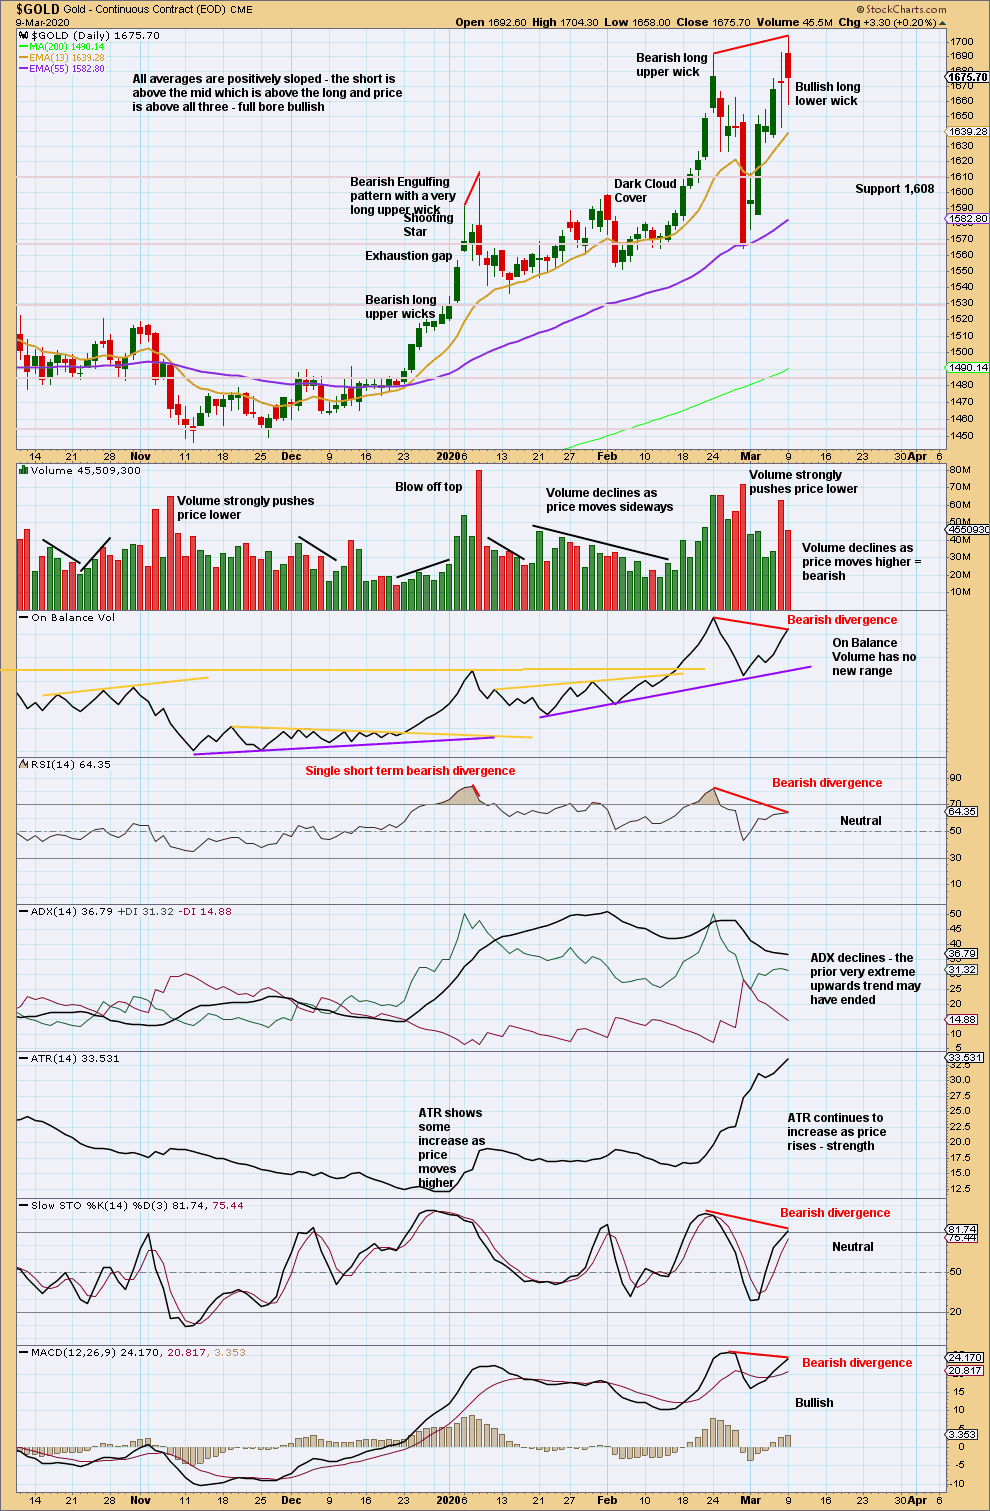
Click chart to enlarge. Chart courtesy of StockCharts.com.
There is now bearish divergence between price and all of On Balance Volume, RSI, Stochastics and MACD. The risk of a trend change to either sideways or a 180° change is high.
GDX WEEKLY CHART

Click chart to enlarge. Chart courtesy of StockCharts.com.
GDX is a reasonable distance off new highs. The last signal was very bearish from a strong Bearish Engulfing pattern.
GDX DAILY CHART
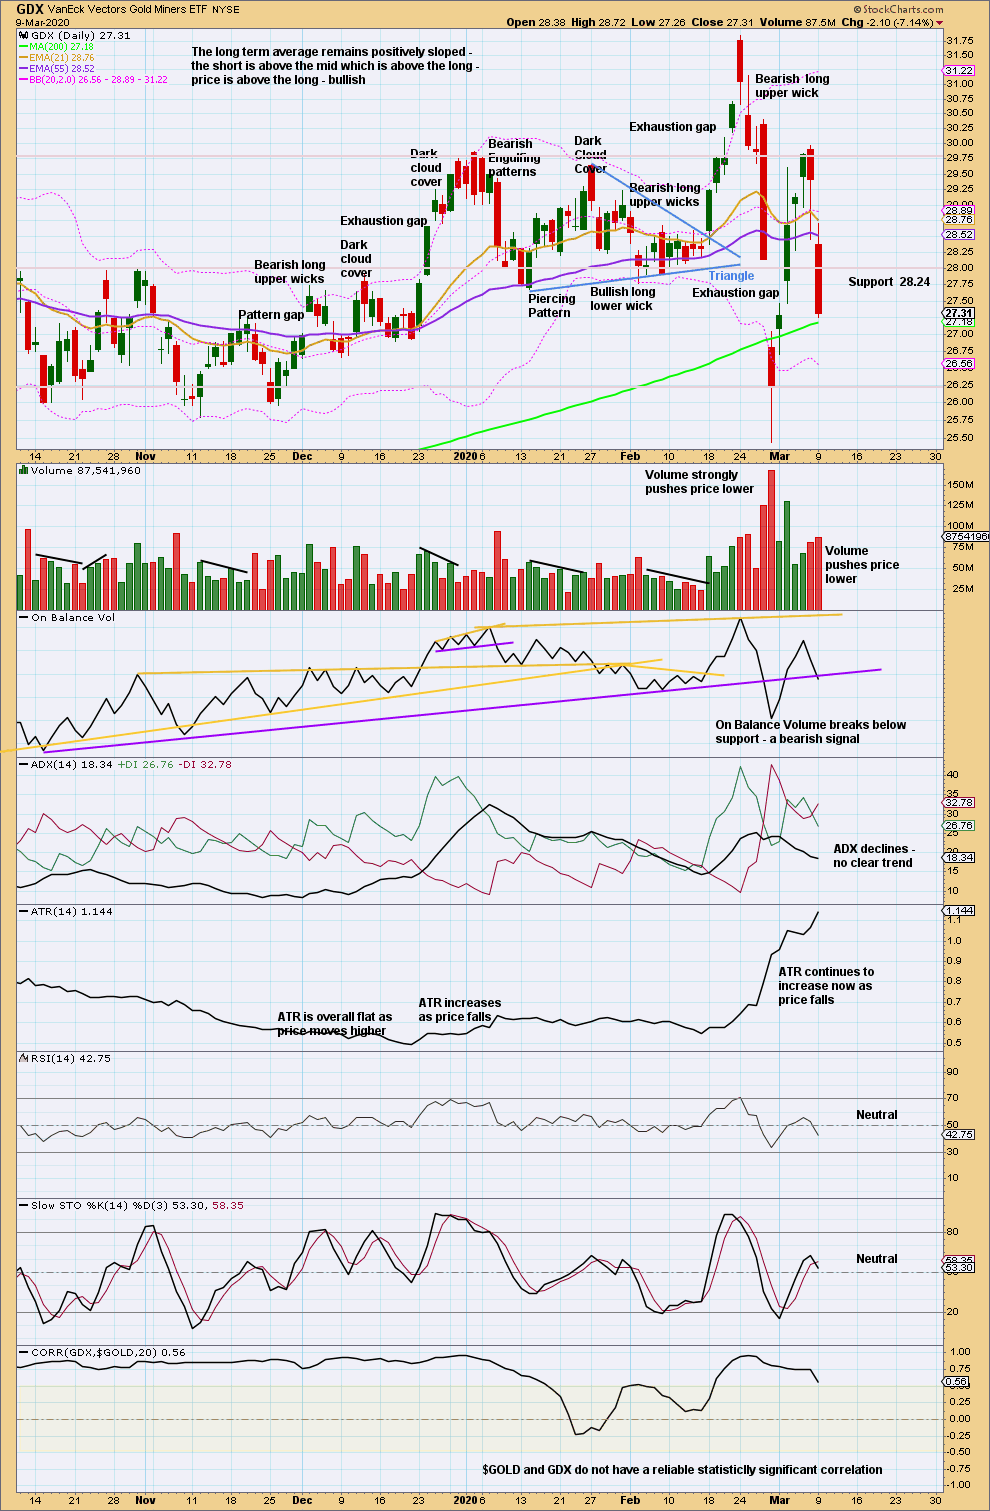
Click chart to enlarge. Chart courtesy of StockCharts.com.
GDX has today moved very strongly lower despite the three previous bullish long lower wicks. GDX looks more immediately bearish than Gold. Note that GDX and Gold do not have a reliable statistically significant positive correlation.
Published @ 08:47 p.m. EST.
—
Careful risk management protects your trading account(s).
Follow my two Golden Rules:
1. Always trade with stops.
2. Risk only 1-5% of equity on any one trade.
—
New updates to this analysis are in bold.
Hourly chart updated:
There is a lot of overlapping in this upwards movement from the low on 12th February (end of intermediate (4) and start of intermediate (5) ).
Downwards movement today is back within price territory of minor 1, so this can’t be minor 4. It’s too large to look right for minute iv, so I’m moving the degree of labelling down one.