
GOLD: Elliott Wave and Technical Analysis | Charts – March 10, 2020
The target remains the same, but some weakness suggests it may be a little too high. A new alternate wave count today is considered.
Summary: A target for upwards movement to end is at 1,736.
Conditions are still extreme. This trend may reasonably be expected to end soon. If the target is wrong, it may be too high.
The new alternate allows for a trend change after one final high slightly above 1,701.61.
Grand SuperCycle analysis is here.
Monthly charts were last updated here.
BEARISH ELLIOTT WAVE COUNT
WEEKLY CHART
Click chart to enlarge.
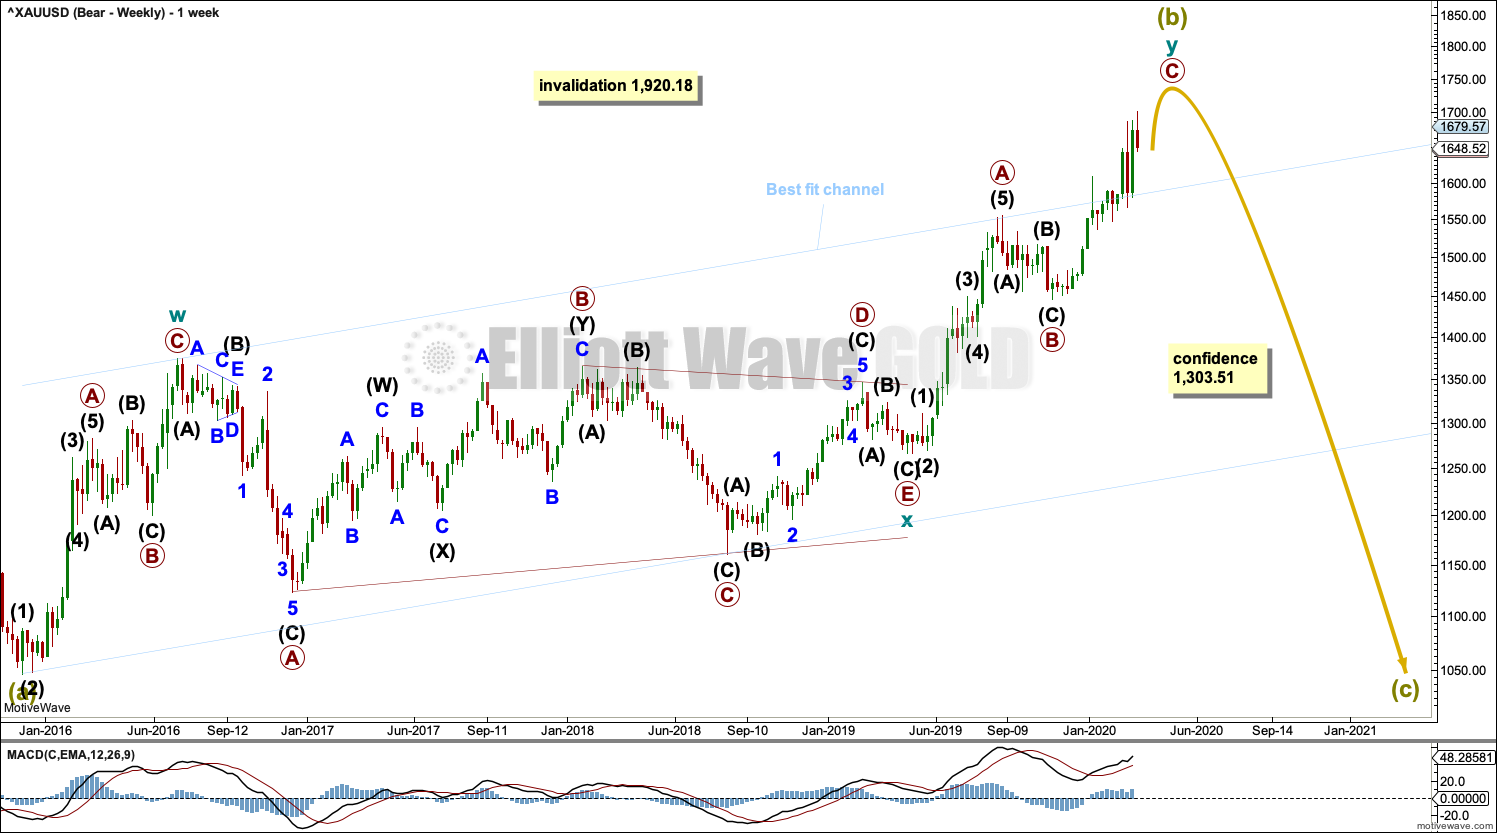
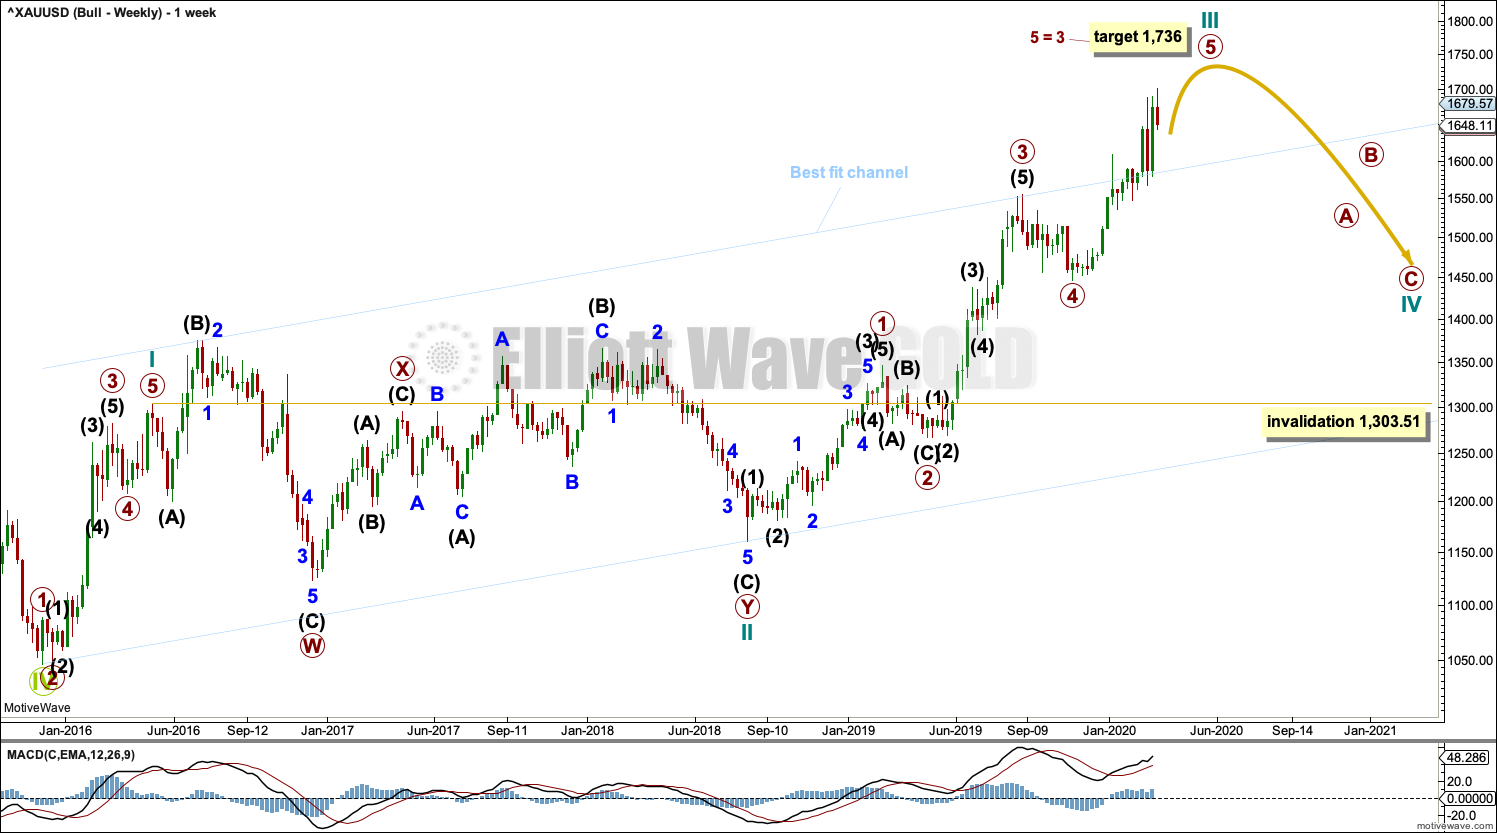
Super Cycle wave (b) may be an incomplete double zigzag.
The first zigzag in the double is labelled cycle wave w. The double is joined by a three in the opposite direction, a triangle labelled cycle wave x. The second zigzag in the double is labelled cycle wave y.
The purpose of the second zigzag in a double is to deepen the correction. Cycle wave y has achieved this purpose.
A wide best fit channel is added in light blue. Copy this channel over to daily charts. Price is now above the upper edge of this channel, which may now provide some support.
DAILY CHART
Click chart to enlarge.
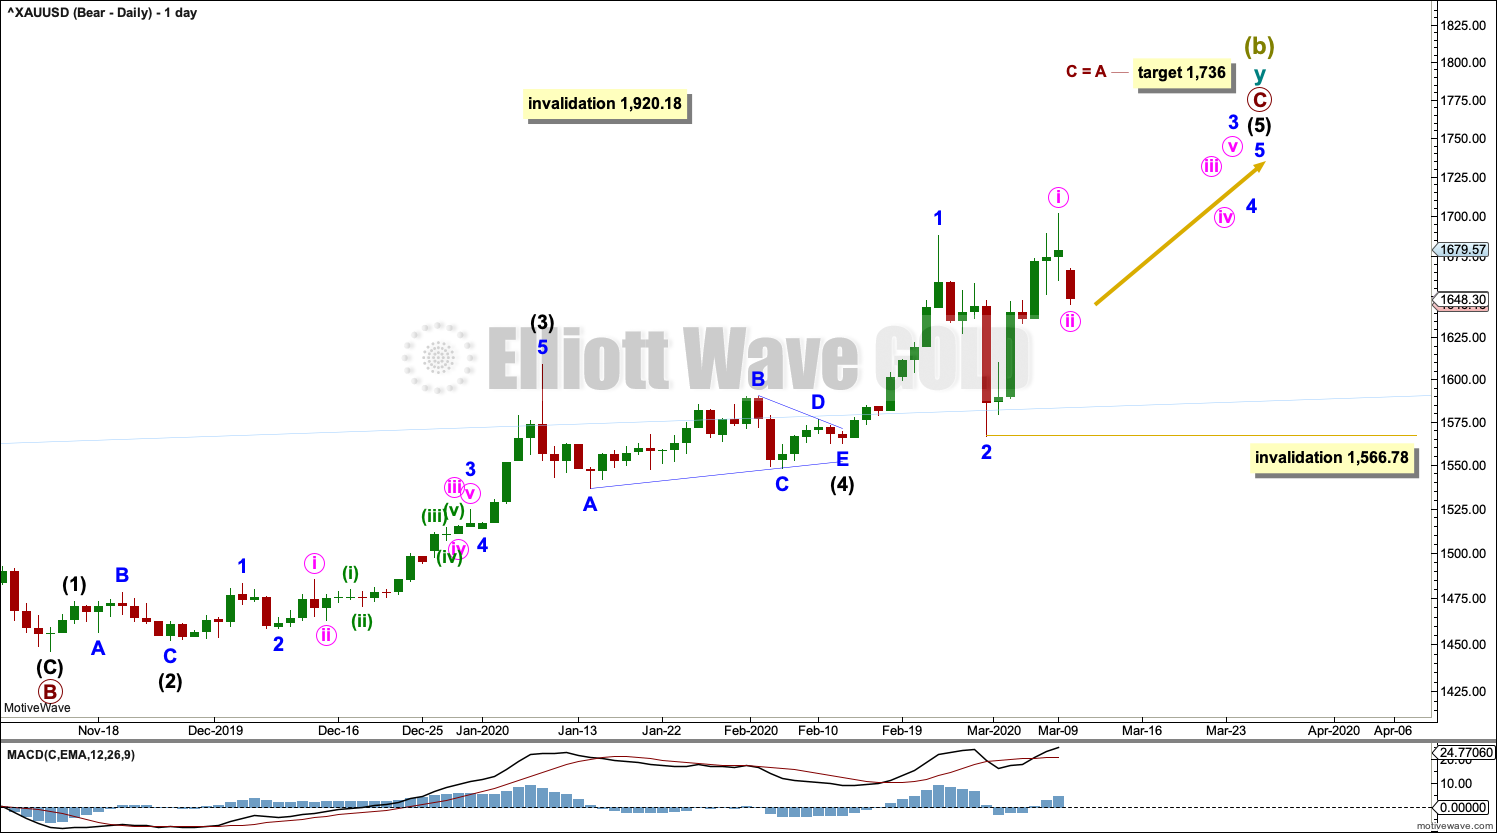
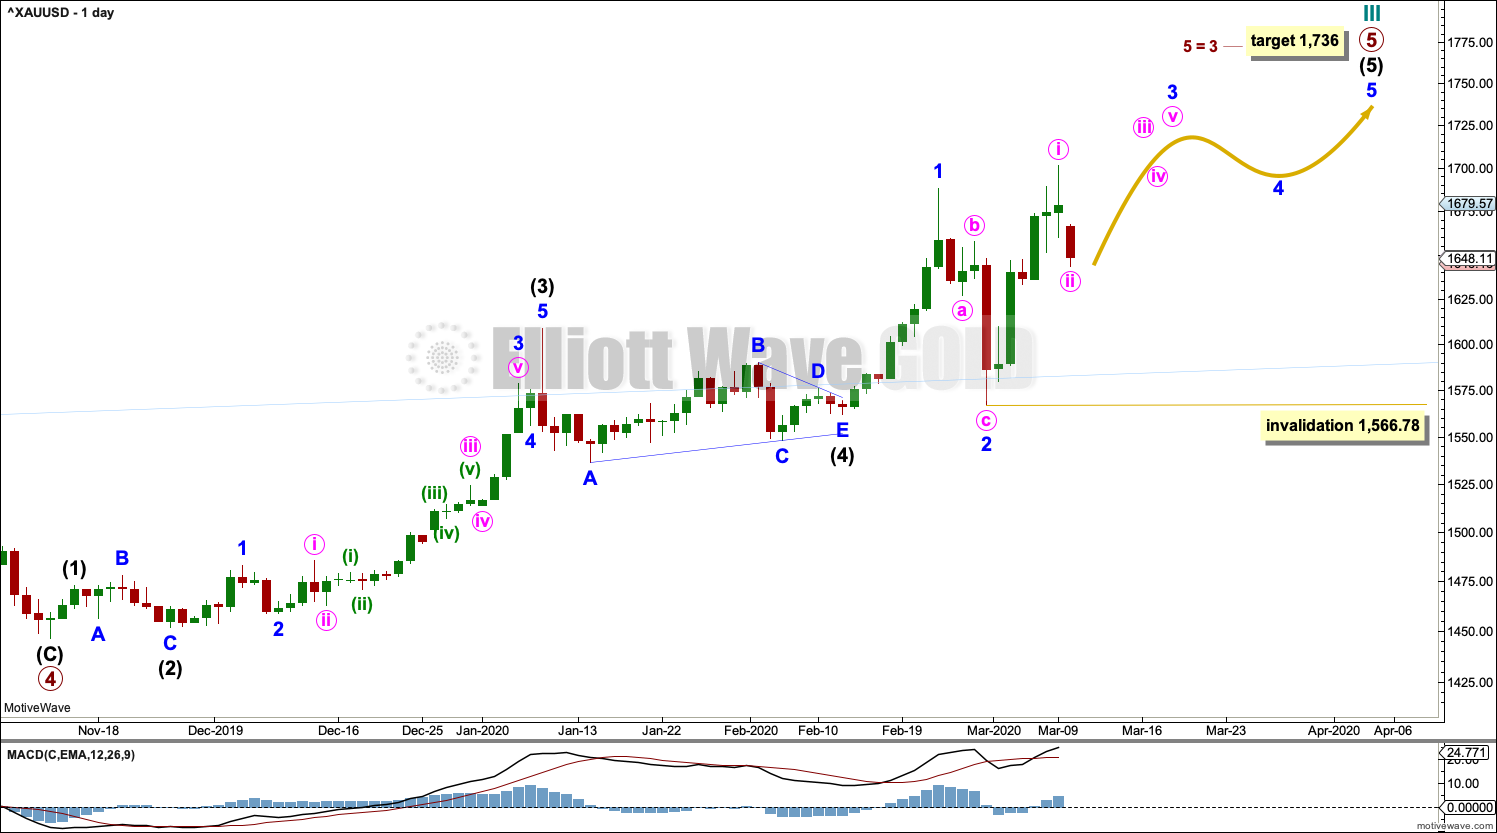
Super Cycle wave (b) may be incomplete.
The second zigzag in the double, labelled cycle wave y, may be continuing higher. Within cycle wave y, primary wave C may be an incomplete five wave impulse. Within primary wave C, intermediate wave (5) may be an incomplete five wave impulse.
Within intermediate wave (5), minor waves 1 and 2 may be complete. Minor wave 3 may now move above the end of minor wave 1, and it must move far enough above this point to allow room for minor wave 4 to unfold and remain above minor wave 1 price territory. So far it has not done this, so further upwards movement would be needed to complete the structure if this wave count is correct.
The target expects primary waves A and C to exhibit the most common Fibonacci ratio.
Within minor wave 3, minute wave ii may not move beyond the start of minute wave i below 1,566.78.
HOURLY CHART
Click chart to enlarge.
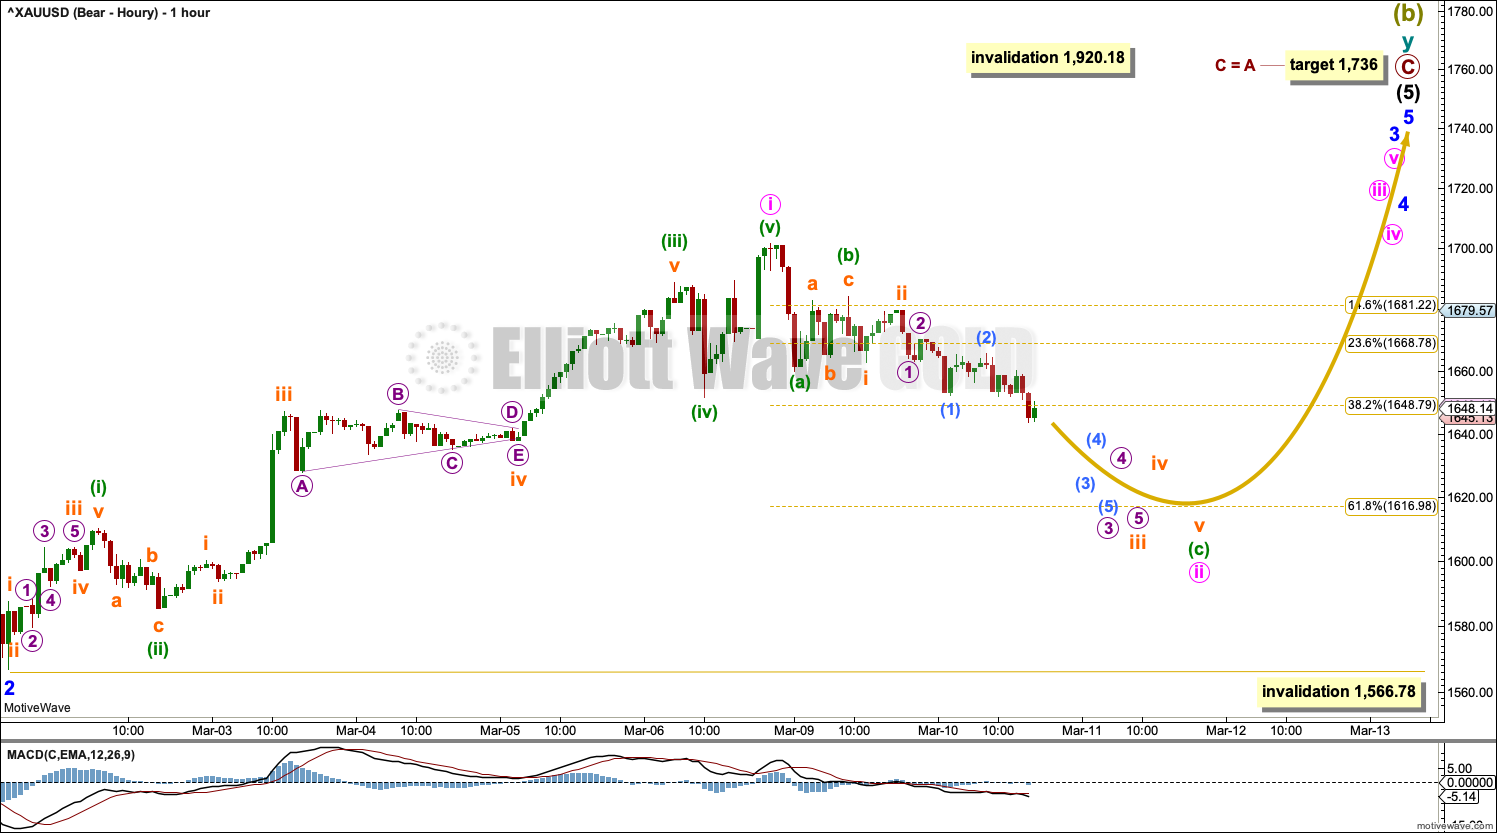
The size of the last downwards session is too big to be a correction within the last upwards wave shown here, so the degree of labelling is changed.
The last upwards wave is now labelled minute wave i. This last session down may be the same degree, labelled minute wave ii. Minute wave ii may not move beyond the start of minute wave i below 1,566.78.
This wave count now expects there may be two overlapping first and second waves to begin intermediate wave (5). This wave count expects some increase in upwards momentum.
ALTERNATE DAILY CHART
Click chart to enlarge.
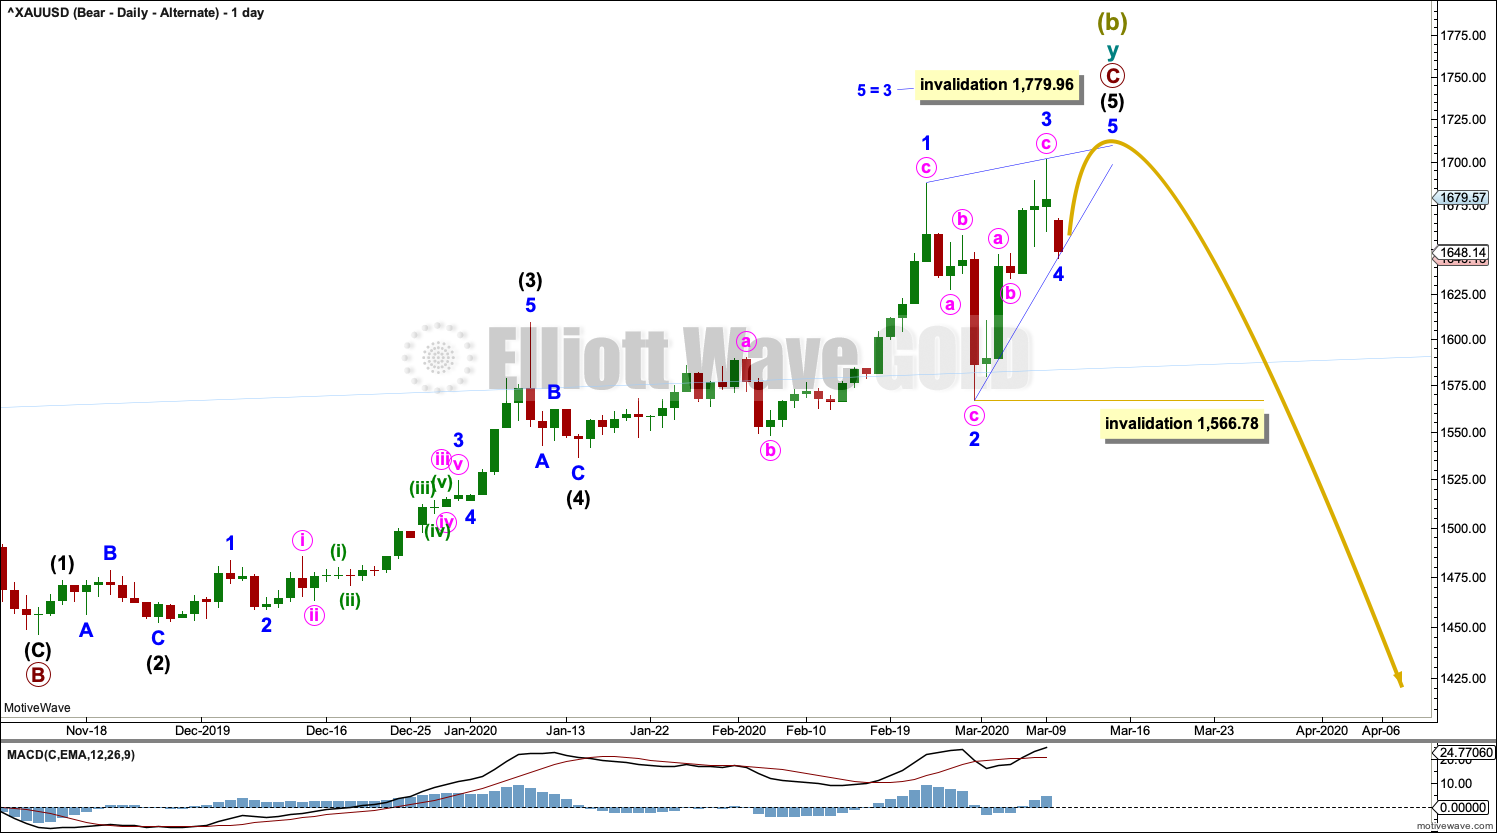
Alternatively, it is possible that intermediate wave (4) may have been over earlier as a zigzag and intermediate wave (5) may be an almost complete ending contracting diagonal.
Ending diagonals require all sub-waves to subdivide as zigzags. Wave 4 should overlap wave 1 price territory. Minor wave 4 may not move beyond the end of minor wave 2 below 1,566.78.
This diagonal may be contracting. If minor wave 5 begins here, then it may not be longer than equality in length with minor wave 3 (minor wave 3 may not be the shortest actionary wave). Minor wave 5 may end as soon as it has moved beyond the end of minor wave 3 at 1,701.61 to avoid a truncation. Minor wave 5 may end with a small overshoot of the 1-3 trend line.
BULLISH ELLIOTT WAVE COUNT
WEEKLY CHART
Click chart to enlarge.
This wave count sees the the bear market complete at the last major low for Gold on 3 December 2015.
If Gold is in a new bull market, then it should begin with a five wave structure upwards on the weekly chart.
Cycle wave I fits as a five wave impulse with reasonably proportionate corrections for primary waves 2 and 4. This resolves a previous major problem with the bullish wave count.
Cycle wave II now fits as a double flat. However, a problem arises with the relabelling of this structure. Within the first flat correction labelled primary wave W, this wave count now needs to ignore what looks like an obvious triangle from July to September 2016 (this can be seen labelled as a triangle on the bear wave count above). This movement must now be labelled as a series of overlapping first and second waves.
Within the first flat correction labelled primary wave W of the double flat of cycle wave II, intermediate wave (B) is 1.69 the length of intermediate wave (A). This is longer than the common range of up to 1.38, but within an allowable guideline of up to 2. The length of intermediate wave (B) reduces the probability of this wave count.
Cycle wave III may be incomplete. When it arrives, cycle wave IV may not move into cycle wave I price territory below 1,303.51.
DAILY CHART
Click chart to enlarge.
Cycle wave III may be incomplete. Intermediate wave (5) within primary wave 5 may be extending higher.
Within intermediate wave (5), minor waves 1 and 2 may be complete.
Minor wave 3 must move far enough above the end of minor wave 1 to allow room for minor wave 4 to unfold and remain above minor wave 1 price territory.
Within minor wave 3, no second wave correction may move beyond its start below 1,566.78.
TECHNICAL ANALYSIS
WEEKLY CHART
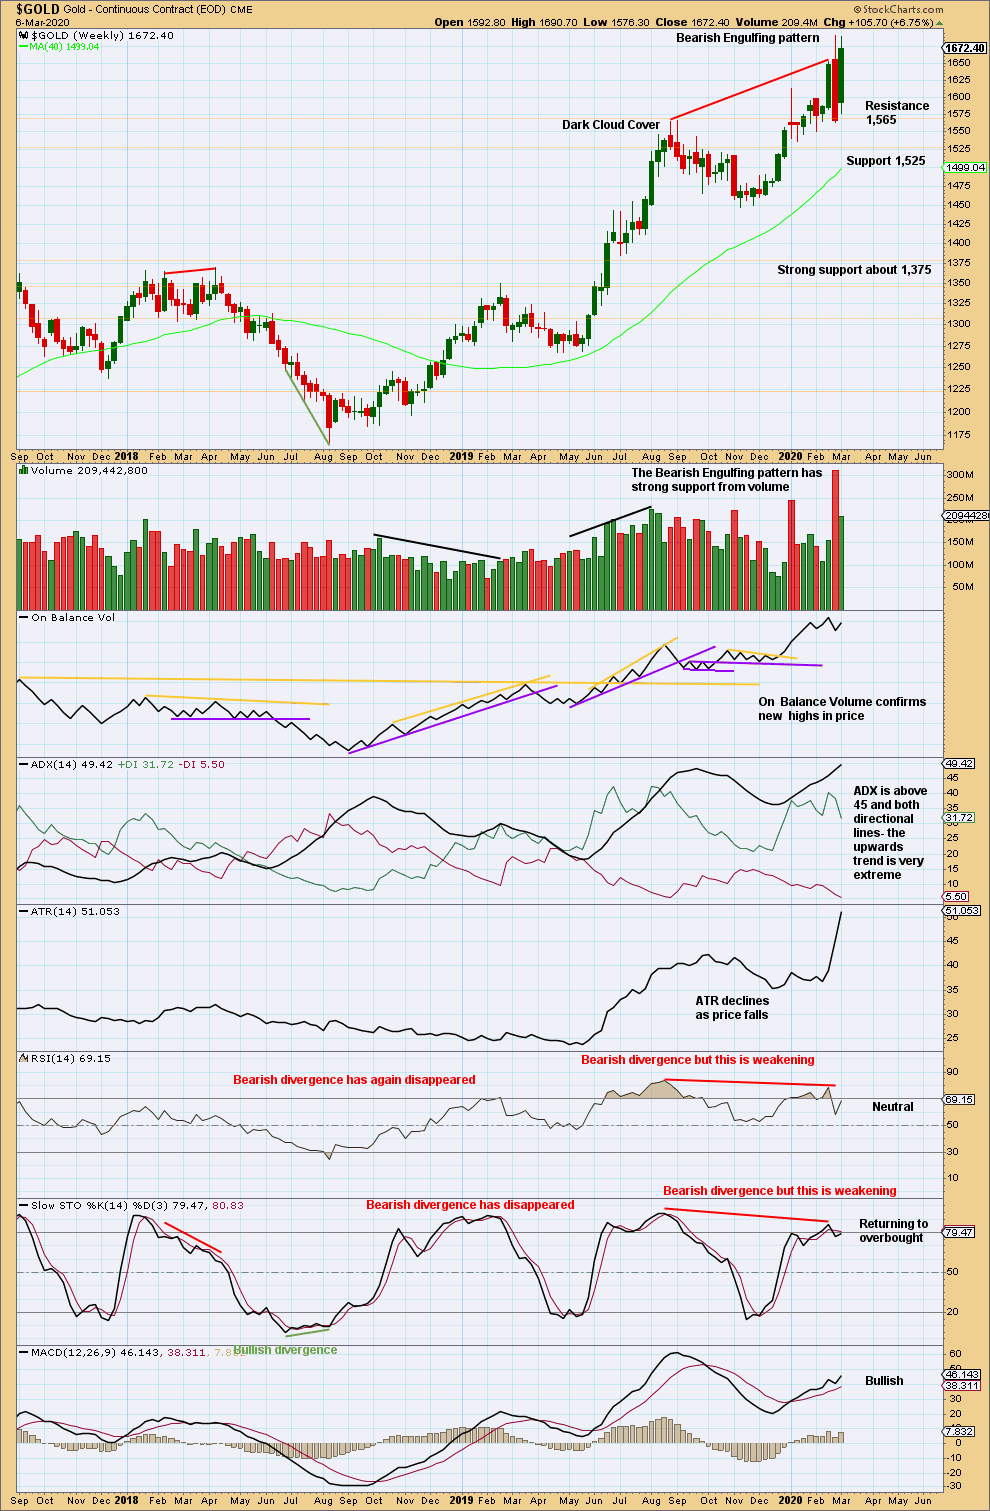
Click chart to enlarge. Chart courtesy of StockCharts.com.
The upwards trend remains very extreme. The risk of a deep pullback or a large consolidation, or a 180° trend change, is high.
DAILY CHART
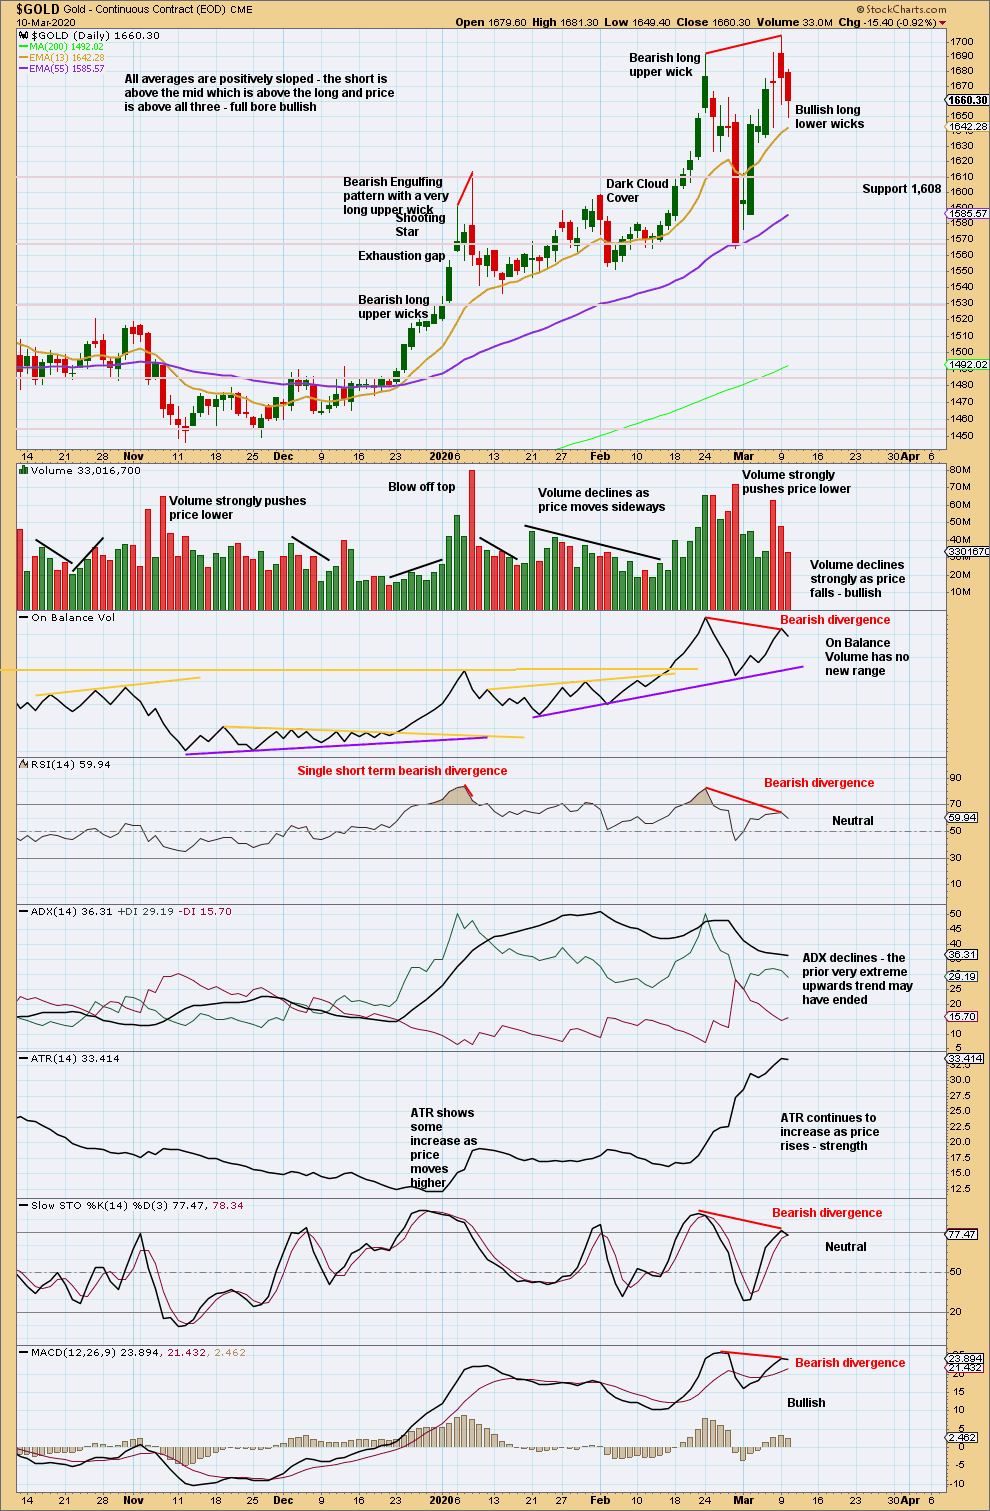
Click chart to enlarge. Chart courtesy of StockCharts.com.
There is now bearish divergence between price and all of On Balance Volume, RSI, Stochastics and MACD. The risk of a trend change to either sideways or a 180° change is high.
GDX WEEKLY CHART

Click chart to enlarge. Chart courtesy of StockCharts.com.
GDX is a reasonable distance off new highs. The last signal was very bearish from a strong Bearish Engulfing pattern.
GDX DAILY CHART
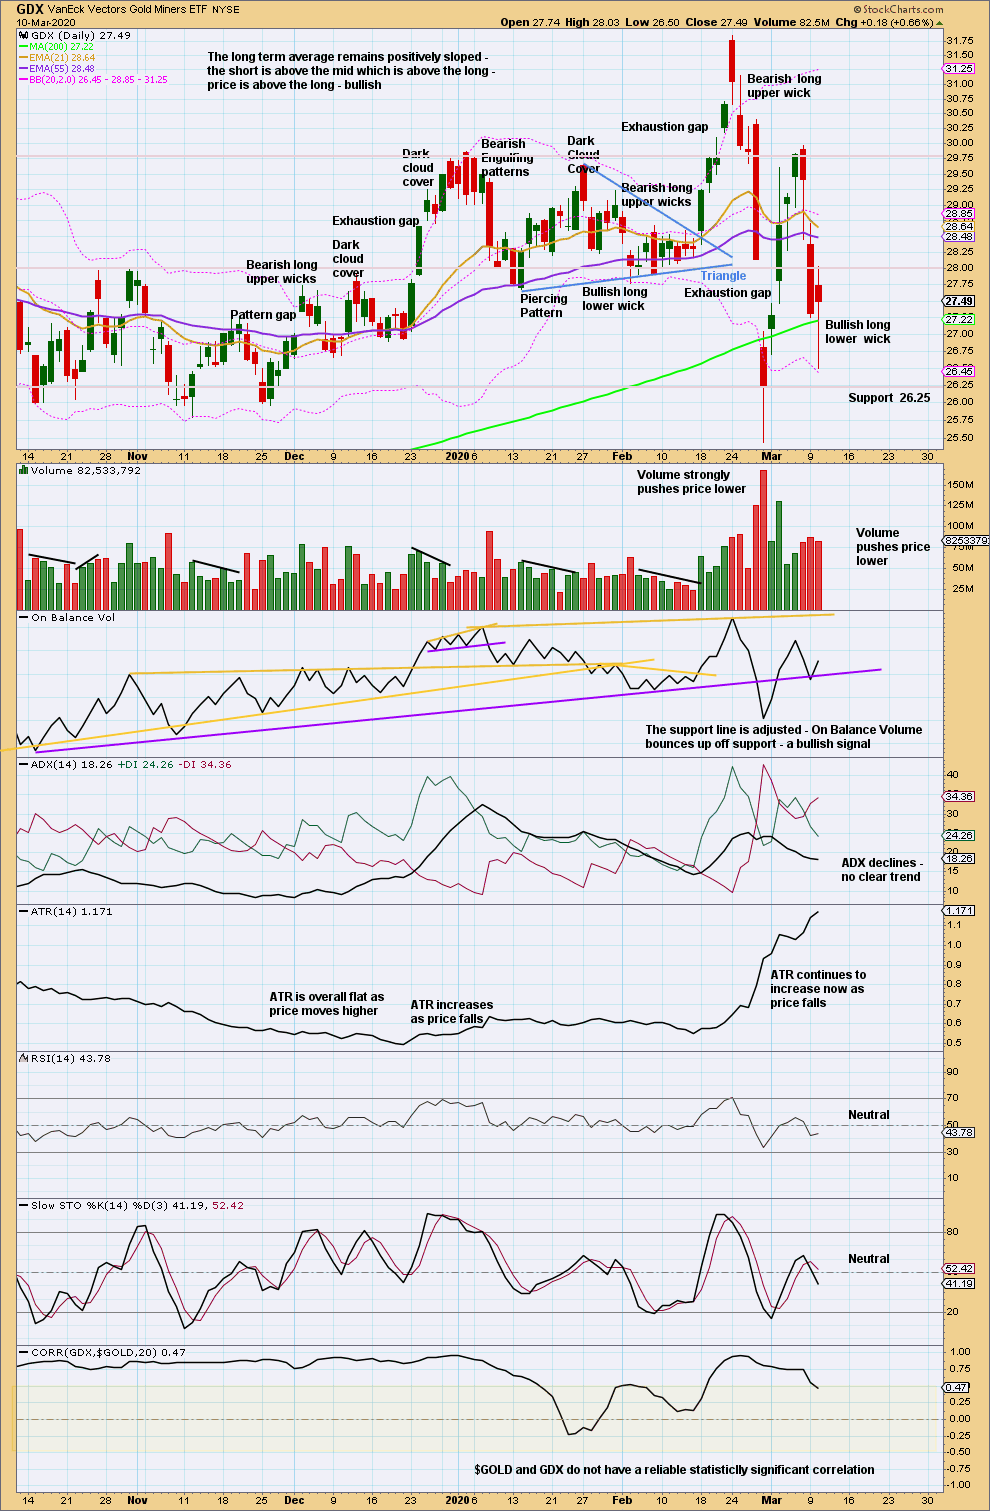
Click chart to enlarge. Chart courtesy of StockCharts.com.
A long lower wick today suggests a bounce about here.
There may have been a trend change to downwards. The -DX line has crossed above the +DX line, but ADX does not yet indicate a trend.
Published @ 05:34 p.m. EST.
—
Careful risk management protects your trading account(s).
Follow my two Golden Rules:
1. Always trade with stops.
2. Risk only 1-5% of equity on any one trade.
—
New updates to this analysis are in bold.
The S&P has breached its invalidation point for the main wave count today which changes the analysis for the mid and long term.
I’ve updated monthly charts for the S&P and I’ll be copying over the analysis here for Lara’s Weekly members to be updated.
Thank you.
Any impact on BTC as well ?? Not feeling the moon version at this stage (not that it matters what I feel)
LOL yeah, the market cares not what we feel
I will be updating BTC-USD next week.
Yes, I believe we have now topped and commenced a bear trend change.
Closed my shorts tonight – at what point do you think it’s ‘safe’ to go short again ??
Much of a bounce now you reckon ?
Hi Lara,
I hope you are having fun in Panama.
Regarding gold does it need one new high? I reworked my ending diagonal idea. I think it meets all EW rules? What do you think?
Looks like a nice solution.
I am hoping one of these days we can just get short, and forget about Gold for a while.
it doesn’t quite meet all EW rules for an expanding diagonal:
I have charted it to check, and 3 is longer than 1 but 5 is not longer than 3. 3 is 139.63 and 5 is 121.88.
However, I do have a new alternate today which considers a sustainable high in Gold. Chart here.
The first confidence point is essential for any confidence in this though.