
GOLD: Elliott Wave and Technical Analysis | Charts – March 11, 2020
Downwards movement today remains above the invalidation point for the main Elliott wave count, but weakness in GDX suggests a more bearish wave count may be considered for Gold.
Summary: A target for upwards movement to end is at 1,736.
Conditions are still extreme. This trend may reasonably be expected to end soon. If the target is wrong, it may be too high.
A new low by any amount at any time frame below 1,566.78 would increase the probability that a sustainable high is in place. At that stage, a bearish alternate wave count would be used.
Grand SuperCycle analysis is here.
Monthly charts were last updated here.
BEARISH ELLIOTT WAVE COUNT
WEEKLY CHART
Click chart to enlarge.
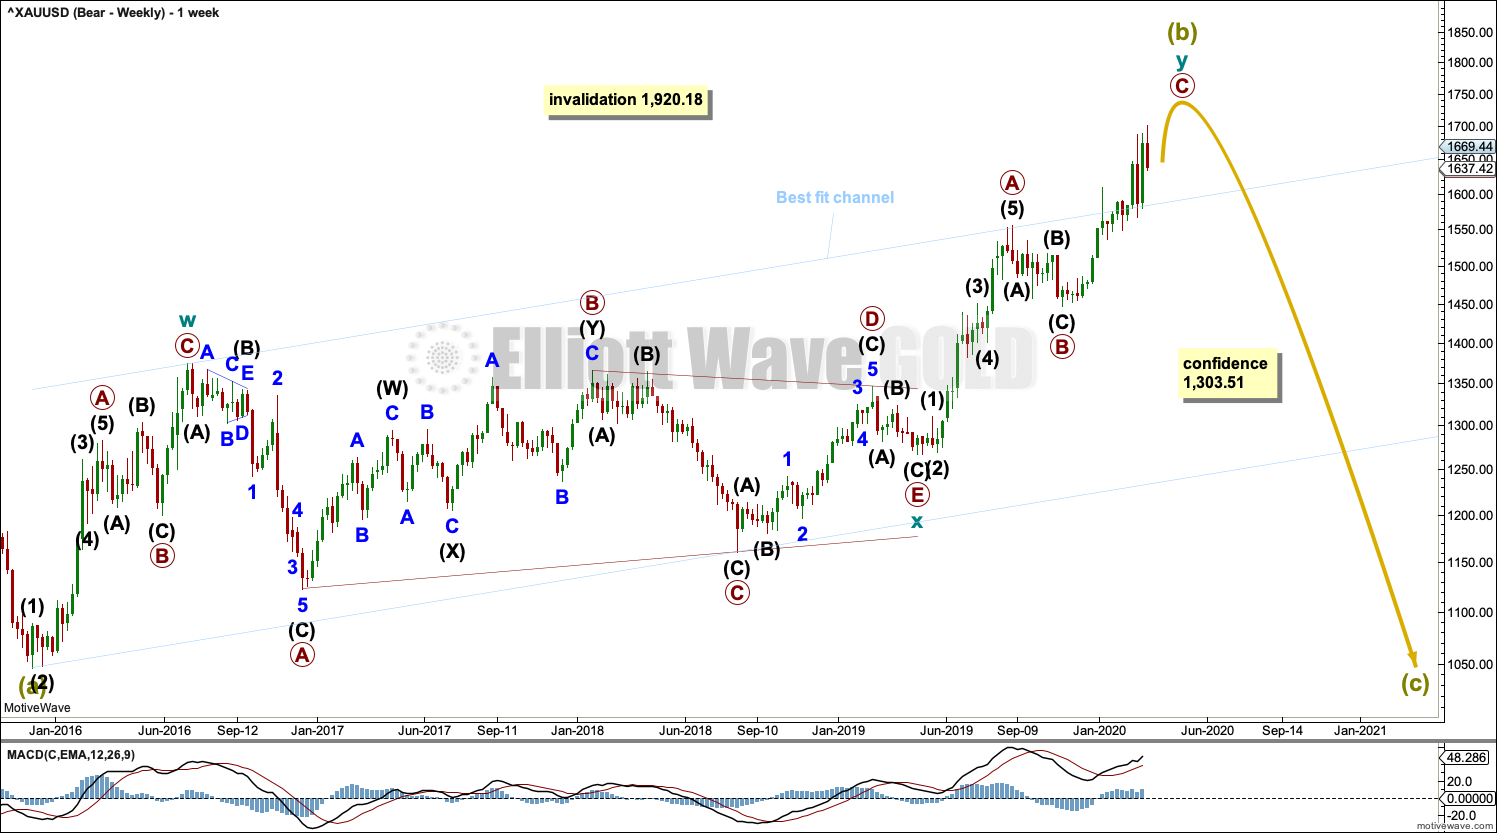
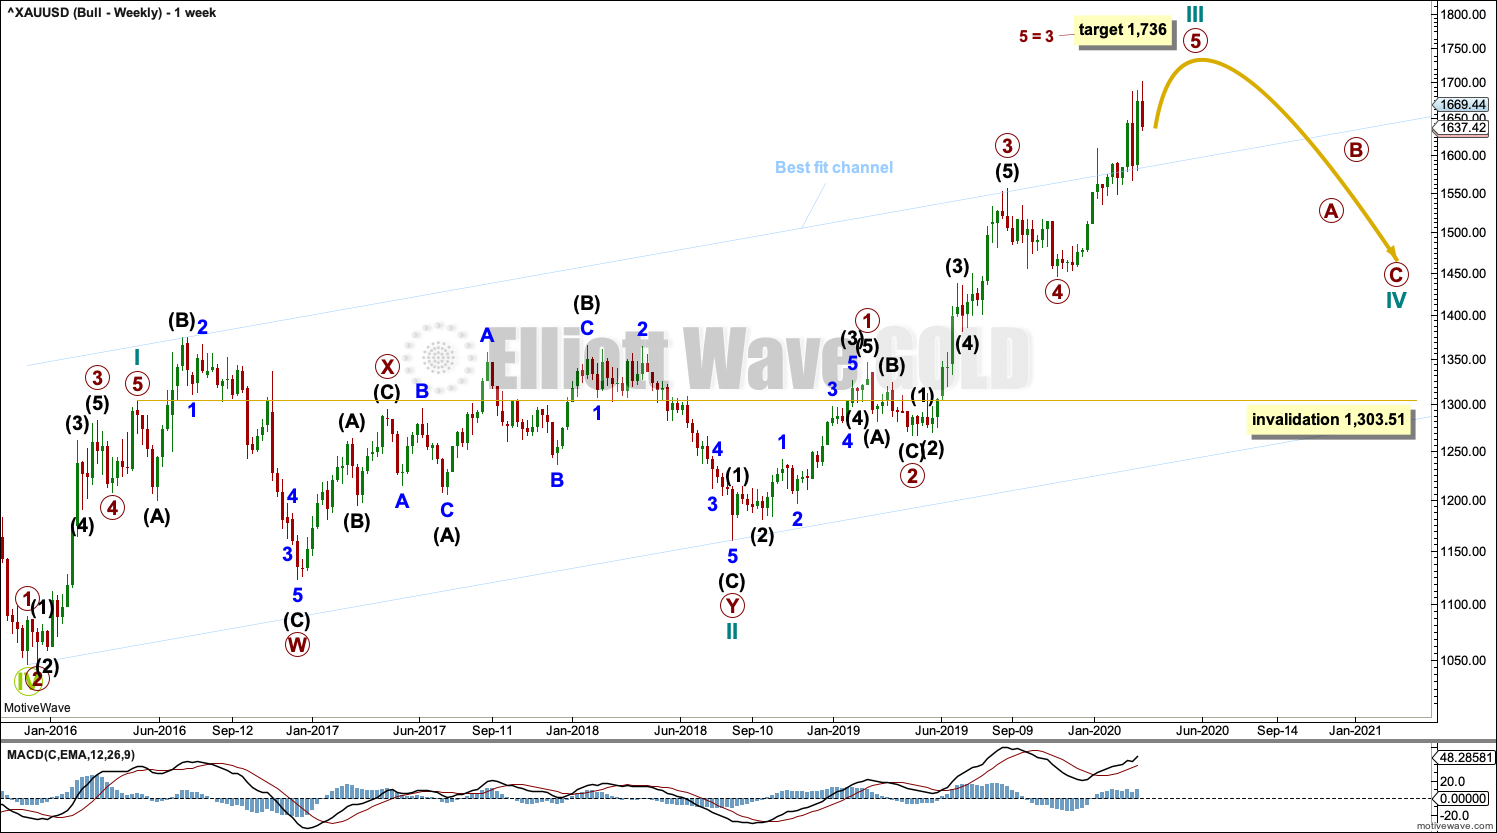
Super Cycle wave (b) may be an incomplete double zigzag.
The first zigzag in the double is labelled cycle wave w. The double is joined by a three in the opposite direction, a triangle labelled cycle wave x. The second zigzag in the double is labelled cycle wave y.
The purpose of the second zigzag in a double is to deepen the correction. Cycle wave y has achieved this purpose.
A wide best fit channel is added in light blue. Copy this channel over to daily charts. Price is now above the upper edge of this channel, which may now provide some support.
DAILY CHART
Click chart to enlarge.
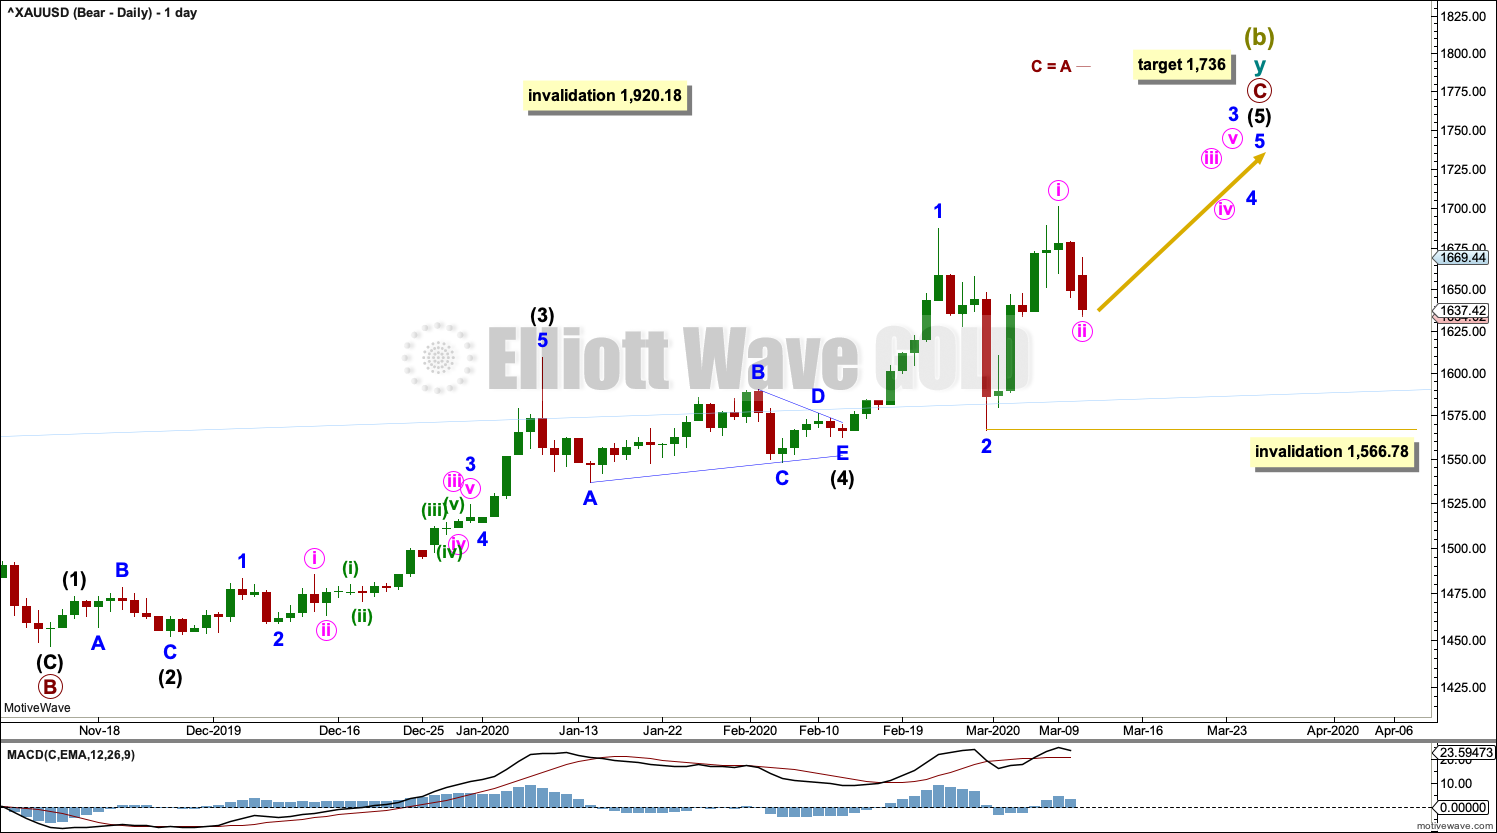
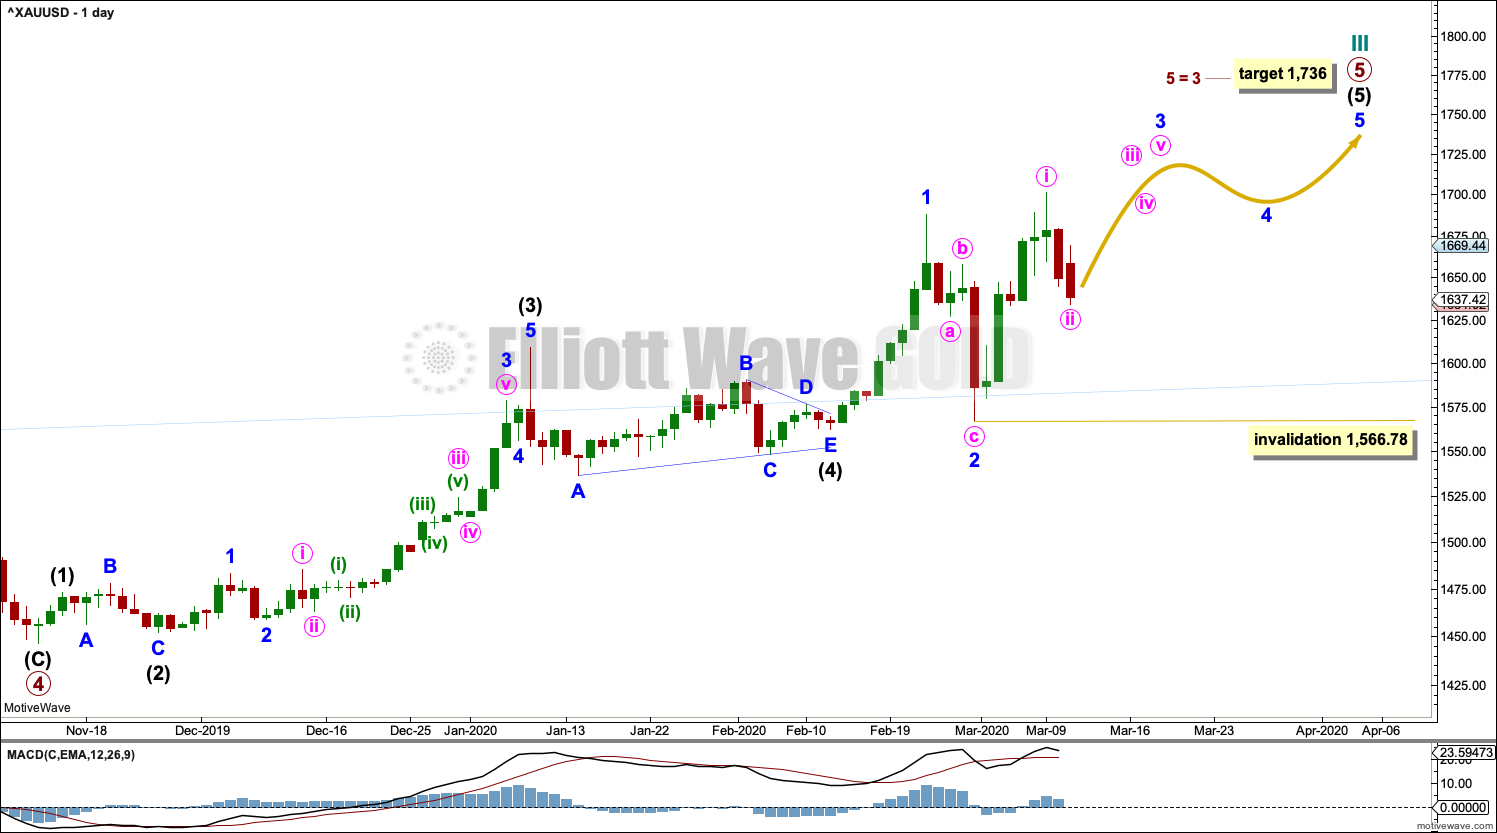
Super Cycle wave (b) may be incomplete.
The second zigzag in the double, labelled cycle wave y, may be continuing higher. Within cycle wave y, primary wave C may be an incomplete five wave impulse. Within primary wave C, intermediate wave (5) may be an incomplete five wave impulse.
Within intermediate wave (5), minor waves 1 and 2 may be complete. Minor wave 3 may now move above the end of minor wave 1, and it must move far enough above this point to allow room for minor wave 4 to unfold and remain above minor wave 1 price territory. So far it has not done this, so further upwards movement would be needed to complete the structure if this wave count is correct.
The target expects primary waves A and C to exhibit the most common Fibonacci ratio.
Within minor wave 3, minute wave ii may not move beyond the start of minute wave i below 1,566.78.
HOURLY CHART
Click chart to enlarge.
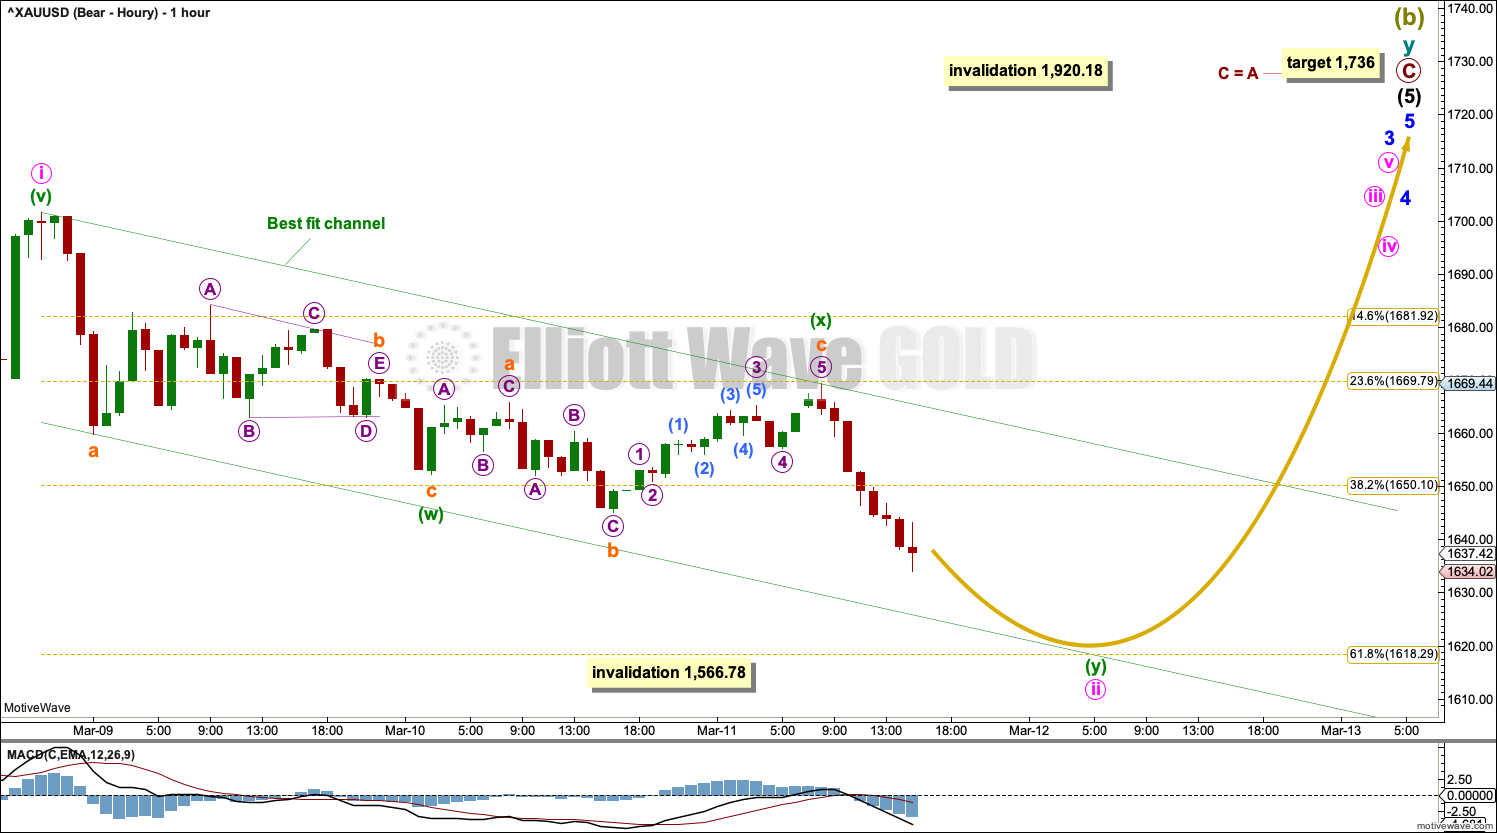
Minute wave ii may be an incomplete double zigzag. Minute wave ii may end about the 0.618 Fibonacci ratio of minute wave i.
A best fit channel is drawn about minute wave ii. Assume downwards movement will continue while price remains within the channel. Assume the trend (at this time frame) remains down. If the channel is breached by upwards movement, then that may be taken as an indication of a possible trend change.
Minute wave ii may not move beyond the start of minute wave i below 1,566.78.
This wave count now expects there may be two overlapping first and second waves to begin intermediate wave (5). This wave count expects some increase in upwards momentum.
ALTERNATE DAILY CHART
Click chart to enlarge.
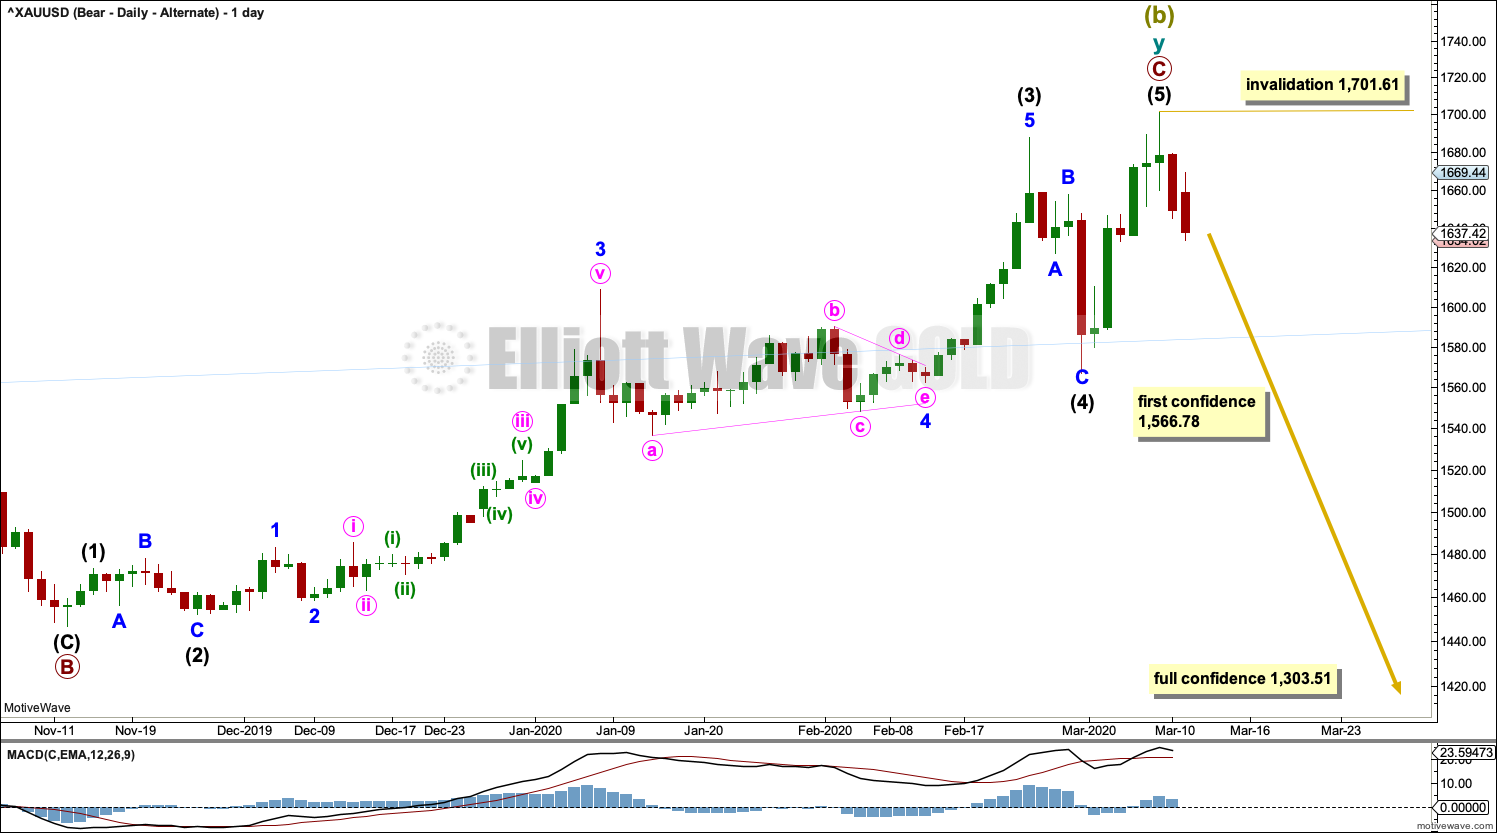
There are multiple ways to label primary wave C. This alternate considers the possibility that it was over at the last high and Gold has had a major trend change.
The proportions between minor waves 2 and 4 within intermediate wave (C) are poor. This reduces the probability of this wave count, but it is valid.
This wave count requires a new low by any amount at any time frame below 1,566.78 for confidence.
BULLISH ELLIOTT WAVE COUNT
WEEKLY CHART
Click chart to enlarge.
This wave count sees the the bear market complete at the last major low for Gold on 3 December 2015.
If Gold is in a new bull market, then it should begin with a five wave structure upwards on the weekly chart.
Cycle wave I fits as a five wave impulse with reasonably proportionate corrections for primary waves 2 and 4. This resolves a previous major problem with the bullish wave count.
Cycle wave II now fits as a double flat. However, a problem arises with the relabelling of this structure. Within the first flat correction labelled primary wave W, this wave count now needs to ignore what looks like an obvious triangle from July to September 2016 (this can be seen labelled as a triangle on the bear wave count above). This movement must now be labelled as a series of overlapping first and second waves.
Within the first flat correction labelled primary wave W of the double flat of cycle wave II, intermediate wave (B) is 1.69 the length of intermediate wave (A). This is longer than the common range of up to 1.38, but within an allowable guideline of up to 2. The length of intermediate wave (B) reduces the probability of this wave count.
Cycle wave III may be incomplete. When it arrives, cycle wave IV may not move into cycle wave I price territory below 1,303.51.
DAILY CHART
Click chart to enlarge.
Cycle wave III may be incomplete. Intermediate wave (5) within primary wave 5 may be extending higher.
Within intermediate wave (5), minor waves 1 and 2 may be complete.
Minor wave 3 must move far enough above the end of minor wave 1 to allow room for minor wave 4 to unfold and remain above minor wave 1 price territory.
Within minor wave 3, no second wave correction may move beyond its start below 1,566.78.
TECHNICAL ANALYSIS
WEEKLY CHART
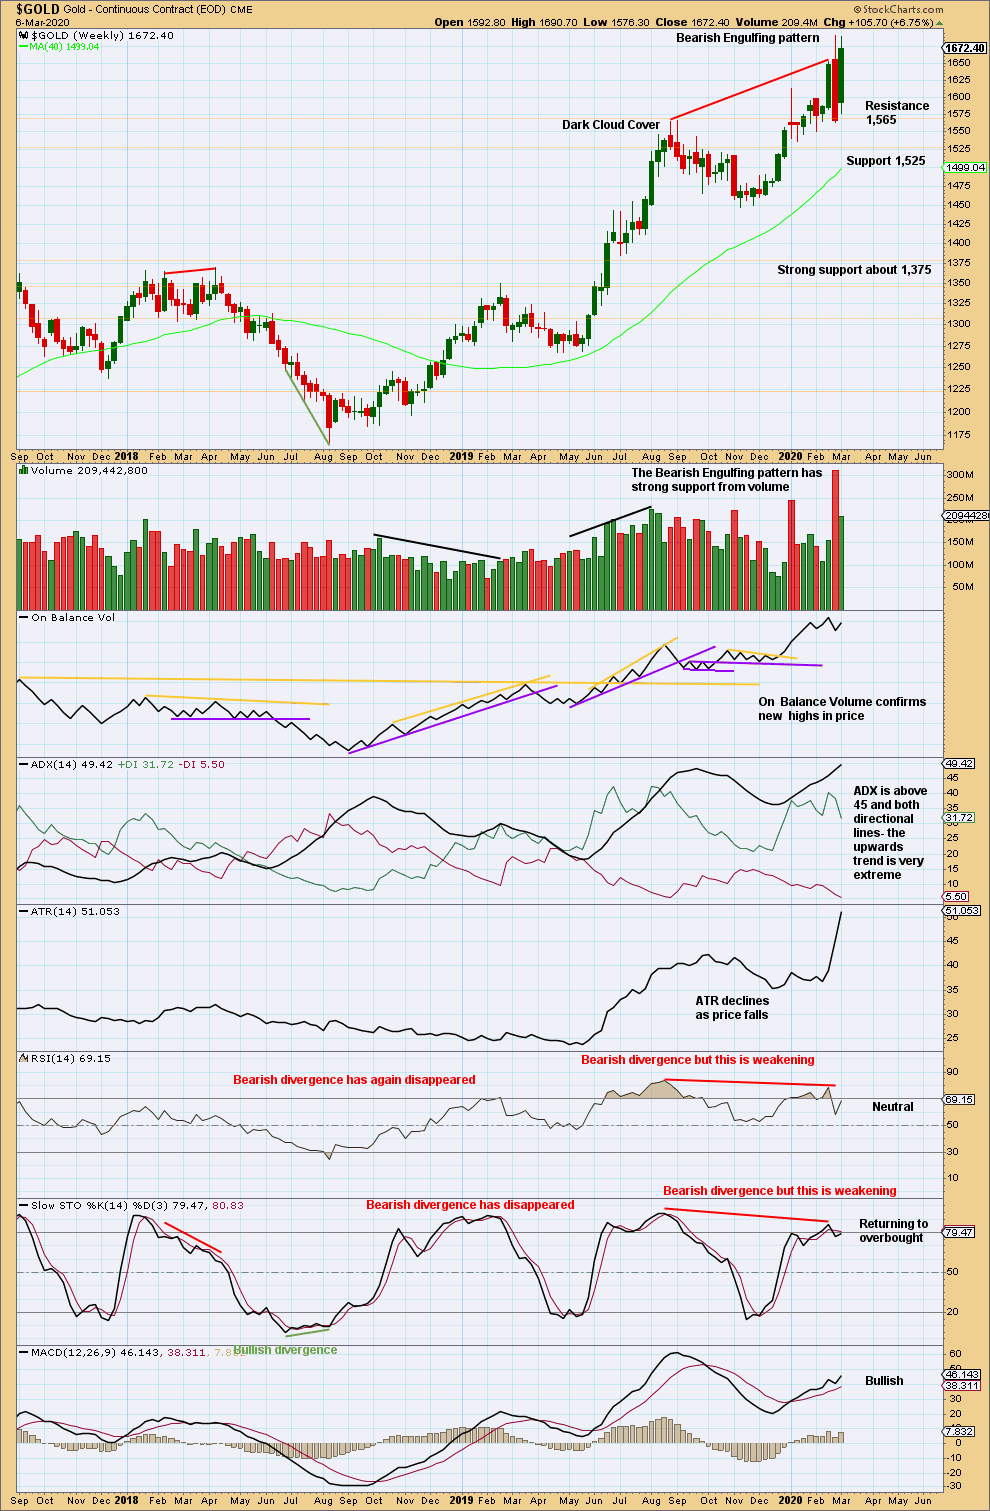
Click chart to enlarge. Chart courtesy of StockCharts.com.
The upwards trend remains very extreme. The risk of a deep pullback or a large consolidation, or a 180° trend change, is high.
DAILY CHART
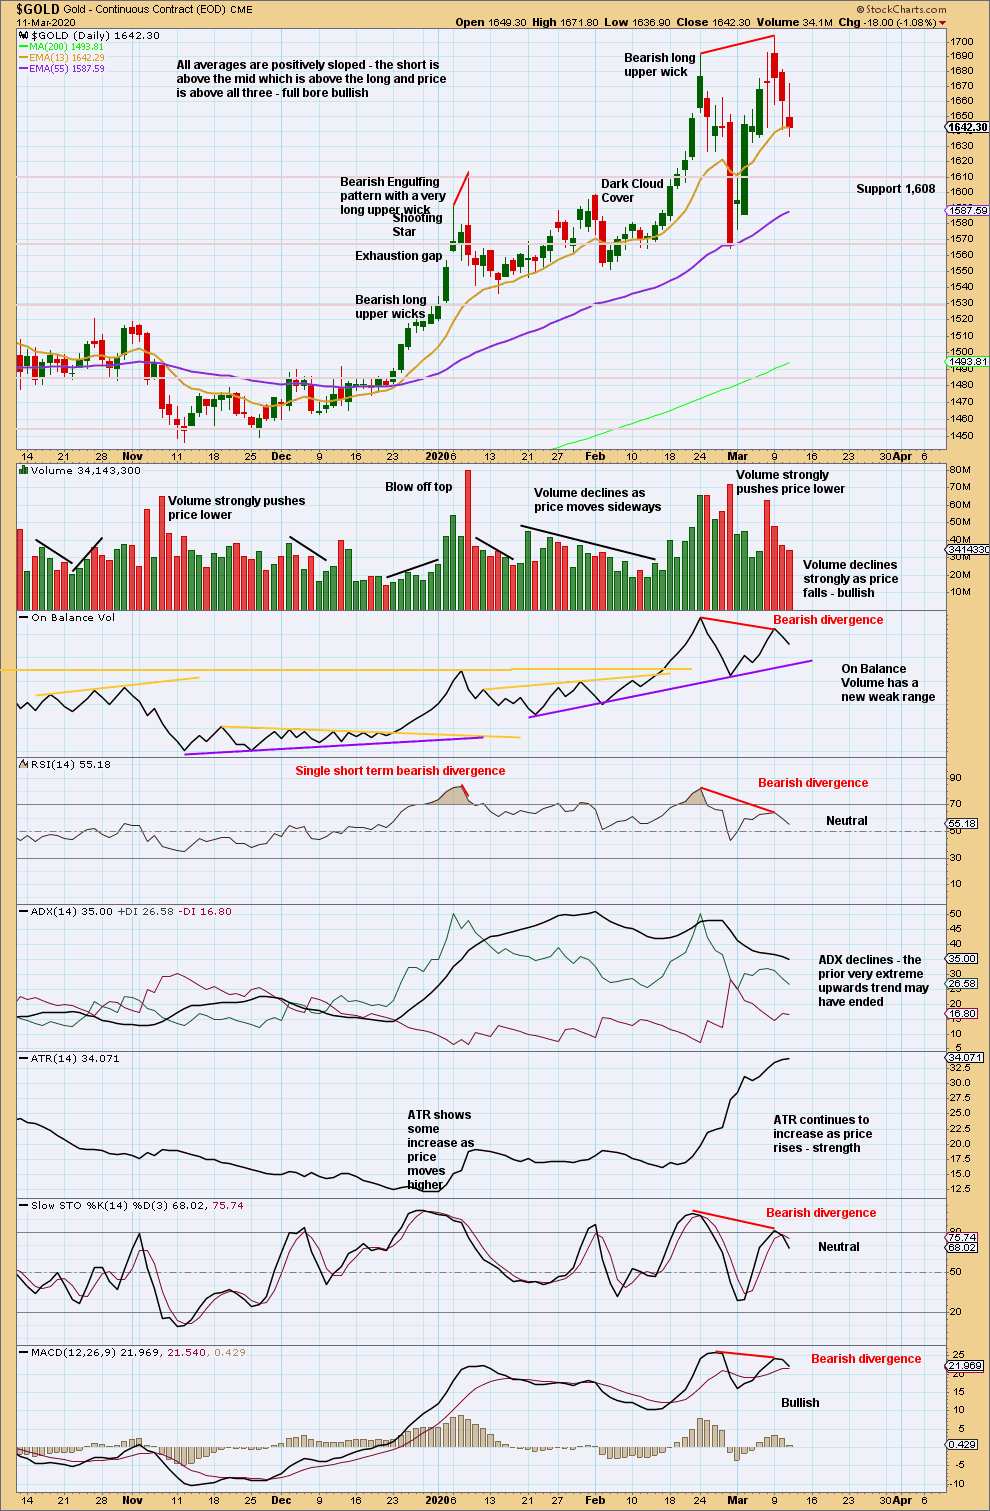
Click chart to enlarge. Chart courtesy of StockCharts.com.
There is now bearish divergence between price and all of On Balance Volume, RSI, Stochastics and MACD. The risk of a trend change to either sideways or a 180° change is high. However, there is no bearish candlestick reversal pattern at the high and volume is not pushing price lower here. The situation is inconclusive. A new swing low below 1,564 (February 28, 2020) would provide some indiction of a possible trend change.
GDX WEEKLY CHART

Click chart to enlarge. Chart courtesy of StockCharts.com.
GDX is a reasonable distance off new highs. The last signal was very bearish from a strong Bearish Engulfing pattern.
GDX DAILY CHART
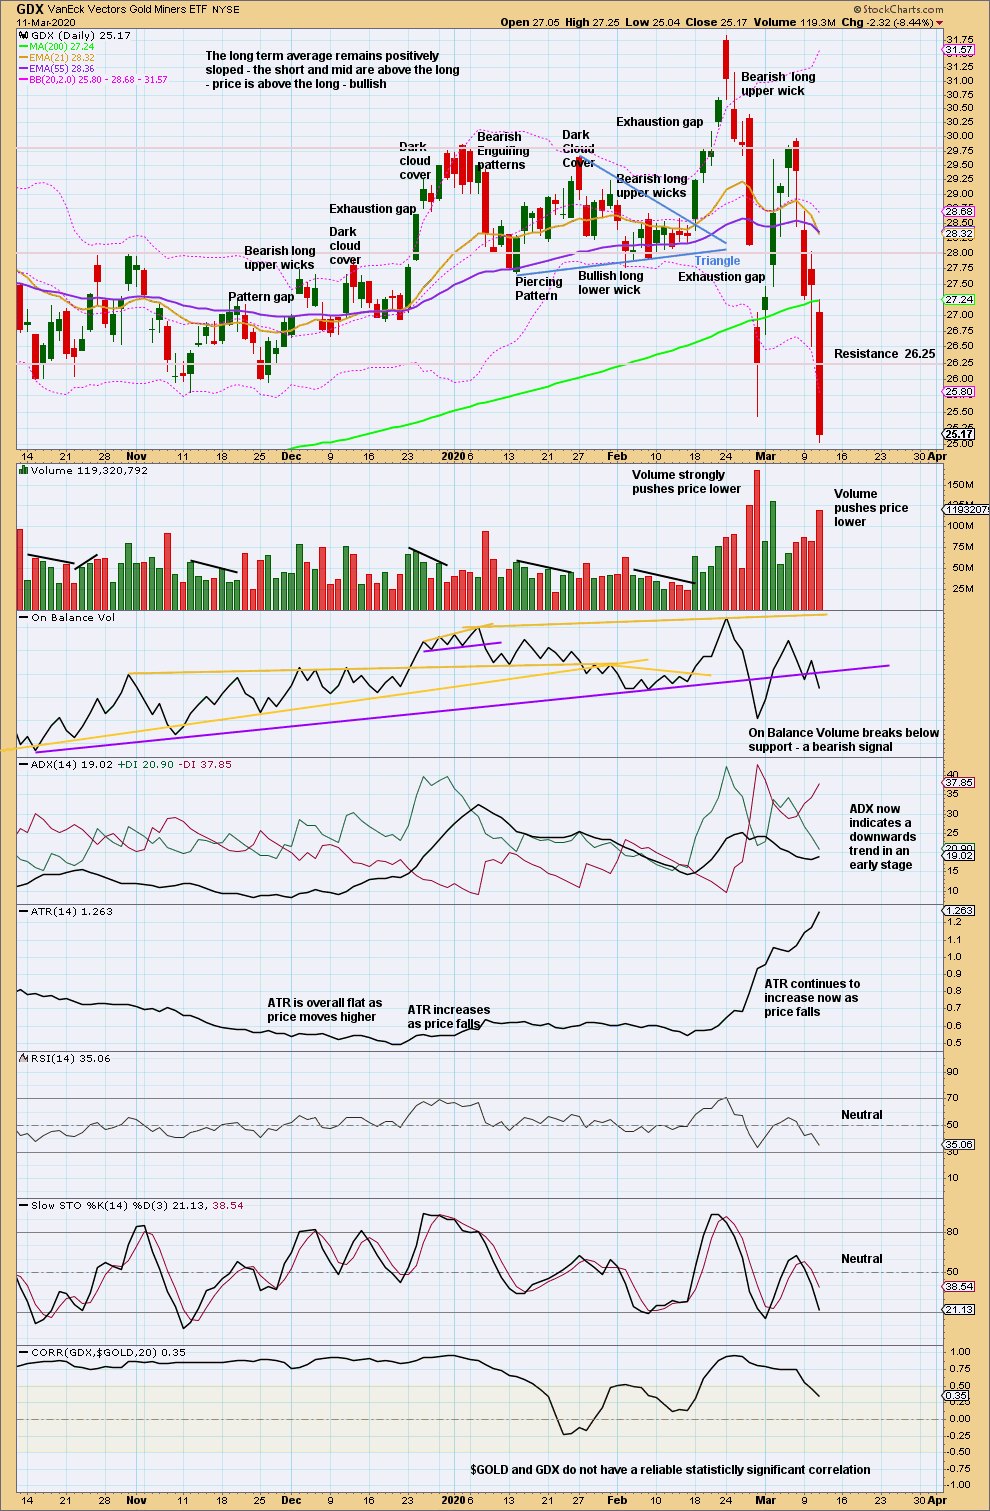
Click chart to enlarge. Chart courtesy of StockCharts.com.
There has been a trend change to downwards. This trend has support from volume pushing price lower and exhibits strength in increasing ATR. Look for next support below above 23.5.
Published @ 06:47 p.m. EST.
—
Careful risk management protects your trading account(s).
Follow my two Golden Rules:
1. Always trade with stops.
2. Risk only 1-5% of equity on any one trade.
—
New updates to this analysis are in bold.
Tried to sell some jdst and dust today. Just a word of warning to investors out there, fidelity won’t let you trade on big down days. This has happened to me a few times over the years. This is inexcusable. They do not let you get out of short positions. There is no way that they are overwhelmed. A company that big has to scale their servers to handle worst case. Worst case would be all users trading at the same time. Someone needs to investigate them. This is not a hardware or software issue. This is malicious and Criminal. Don’t open accounts with fidelity.
Sry to hear that.. I think traders prefer to use TD Ameritrade’s TOS or Interactive brokers’ platform. My TOS platform worked quite well today.