
GOLD: Elliott Wave and Technical Analysis | Charts – March 12, 2020
Downwards movement has made a new swing low today, indicating a trend change for Gold. Yesterday’s alternate Elliott wave count is now the main Elliott wave count.
Summary: A new low below 1,566.78 increases the probability that a sustainable high is in place. Expect more downwards movement as most likely now.
Grand SuperCycle analysis is here.
Monthly charts were last updated here.
BEARISH ELLIOTT WAVE COUNT
WEEKLY CHART
Click chart to enlarge.
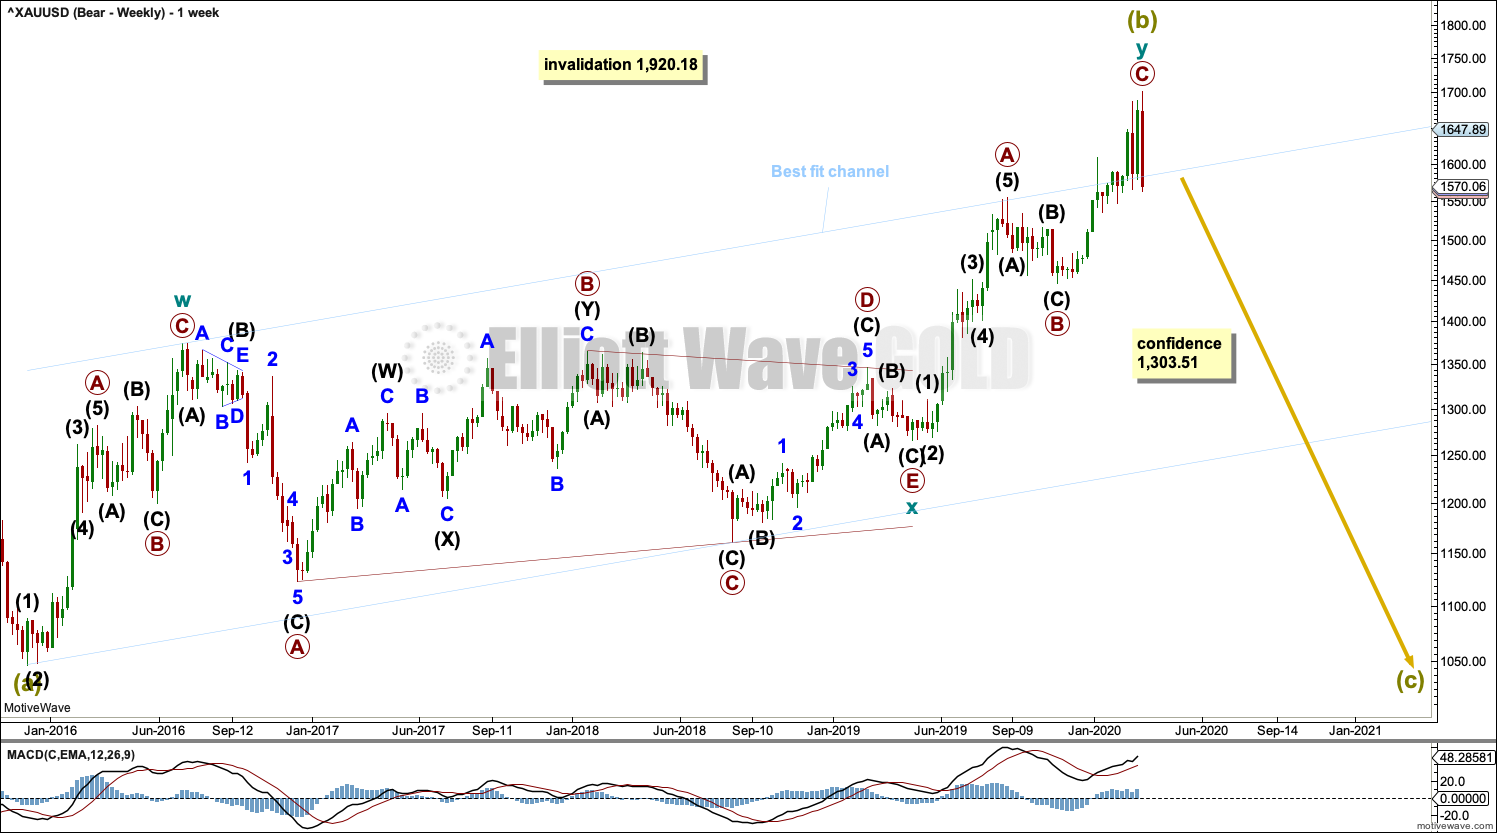
Super Cycle wave (b) may be a complete double zigzag.
The first zigzag in the double is labelled cycle wave w. The double is joined by a three in the opposite direction, a triangle labelled cycle wave x. The second zigzag in the double is labelled cycle wave y.
The purpose of the second zigzag in a double is to deepen the correction. Cycle wave y has achieved this purpose.
A wide best fit channel is added in light blue. Copy this channel over to daily charts. Price has today closed back below the upper edge of this channel.
DAILY CHART
Click chart to enlarge.
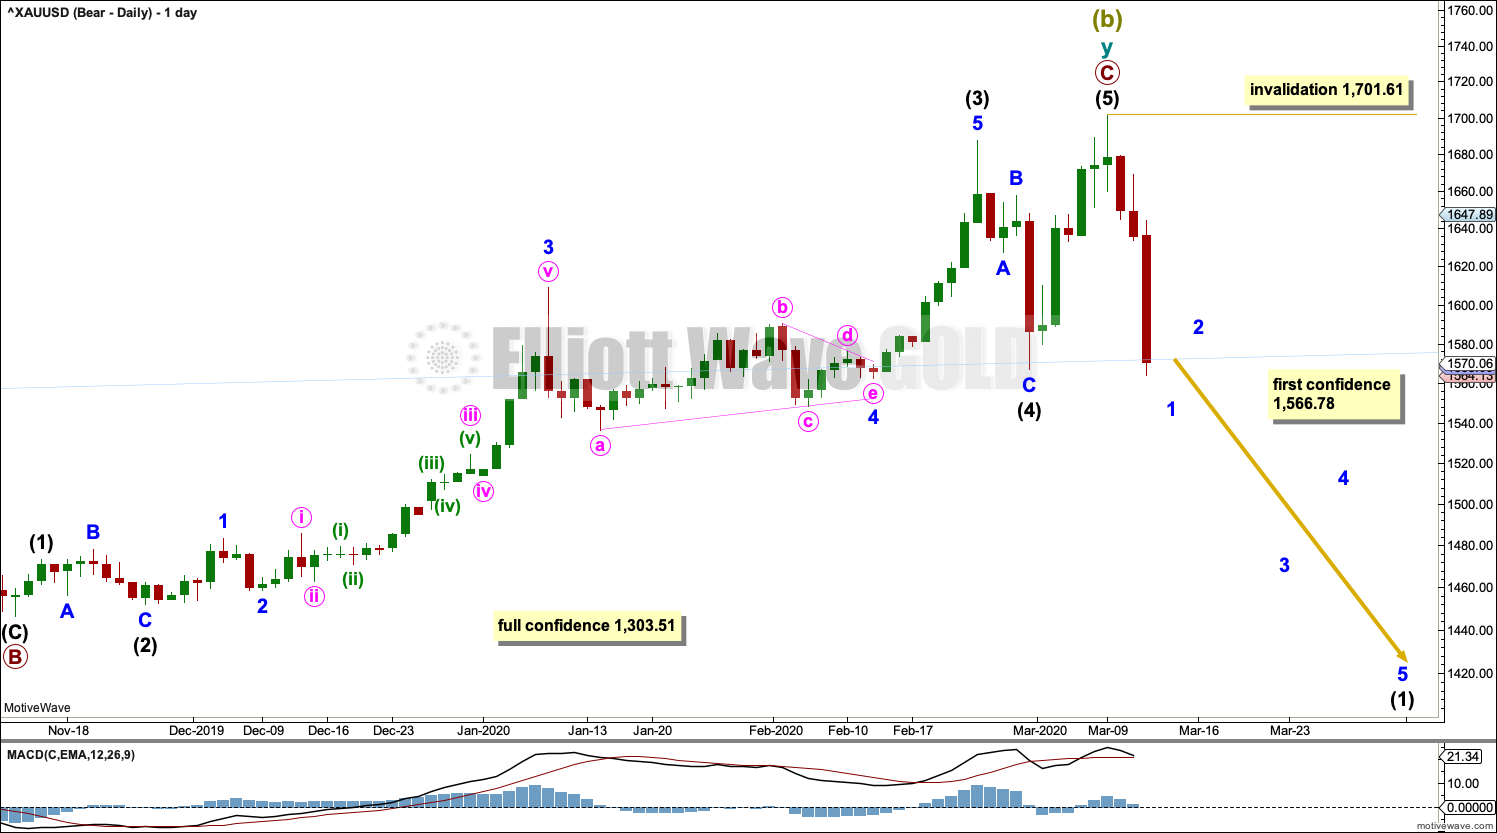
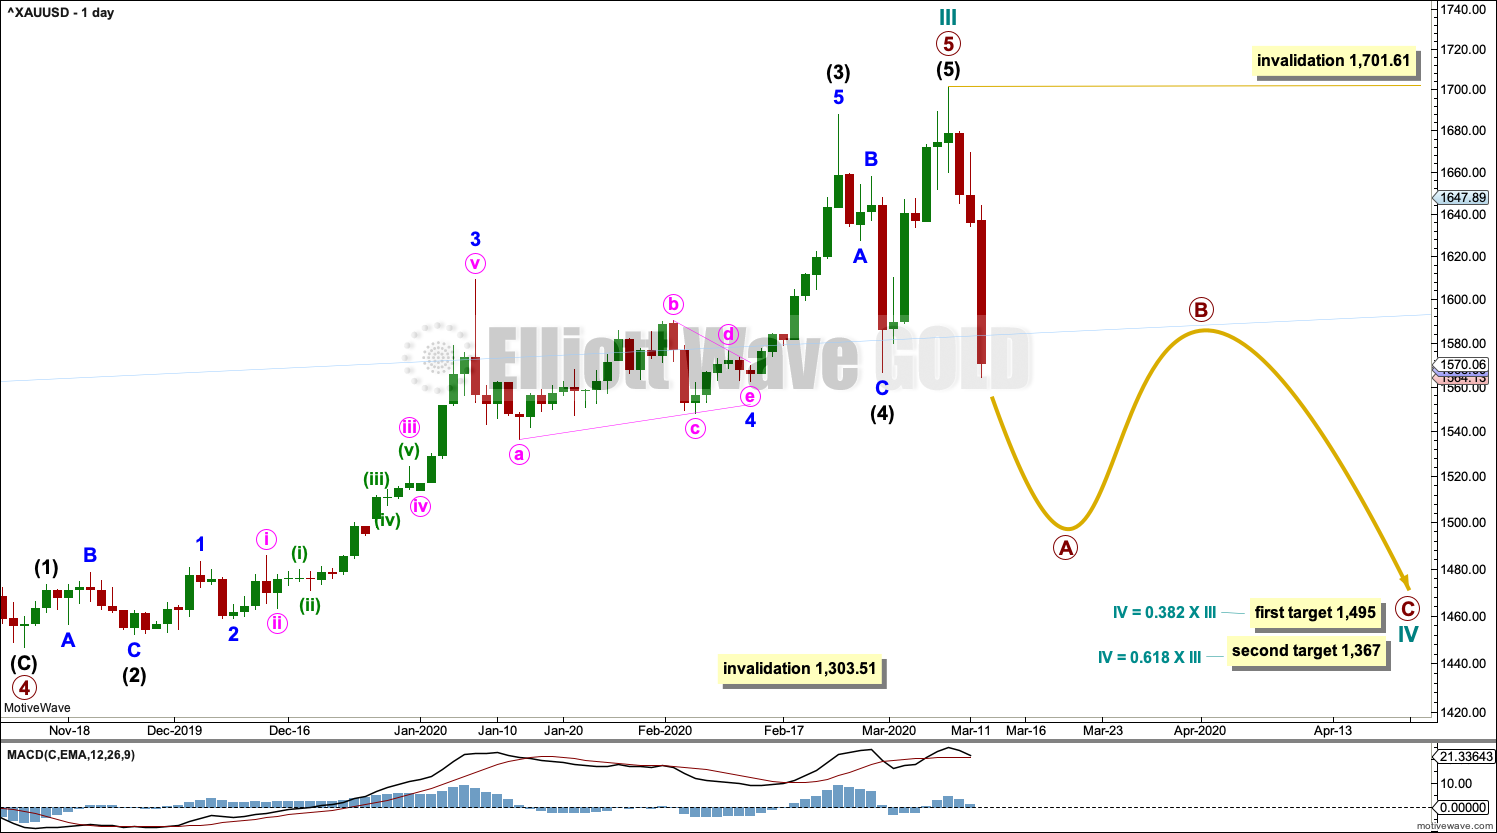
Super Cycle wave (b) may be complete.
The second zigzag in the double, labelled cycle wave y, may be complete. There is no Fibonacci ratio between primary waves A and C.
If there was a trend change at Super Cycle degree four days ago, then a five down should develop at daily, weekly and monthly time frames. The first five down at the daily chart level will be labelled intermediate wave (1), and it may be incomplete. No second wave correction may move beyond the start of its first wave above 1,701.61.
HOURLY CHART
Click chart to enlarge.
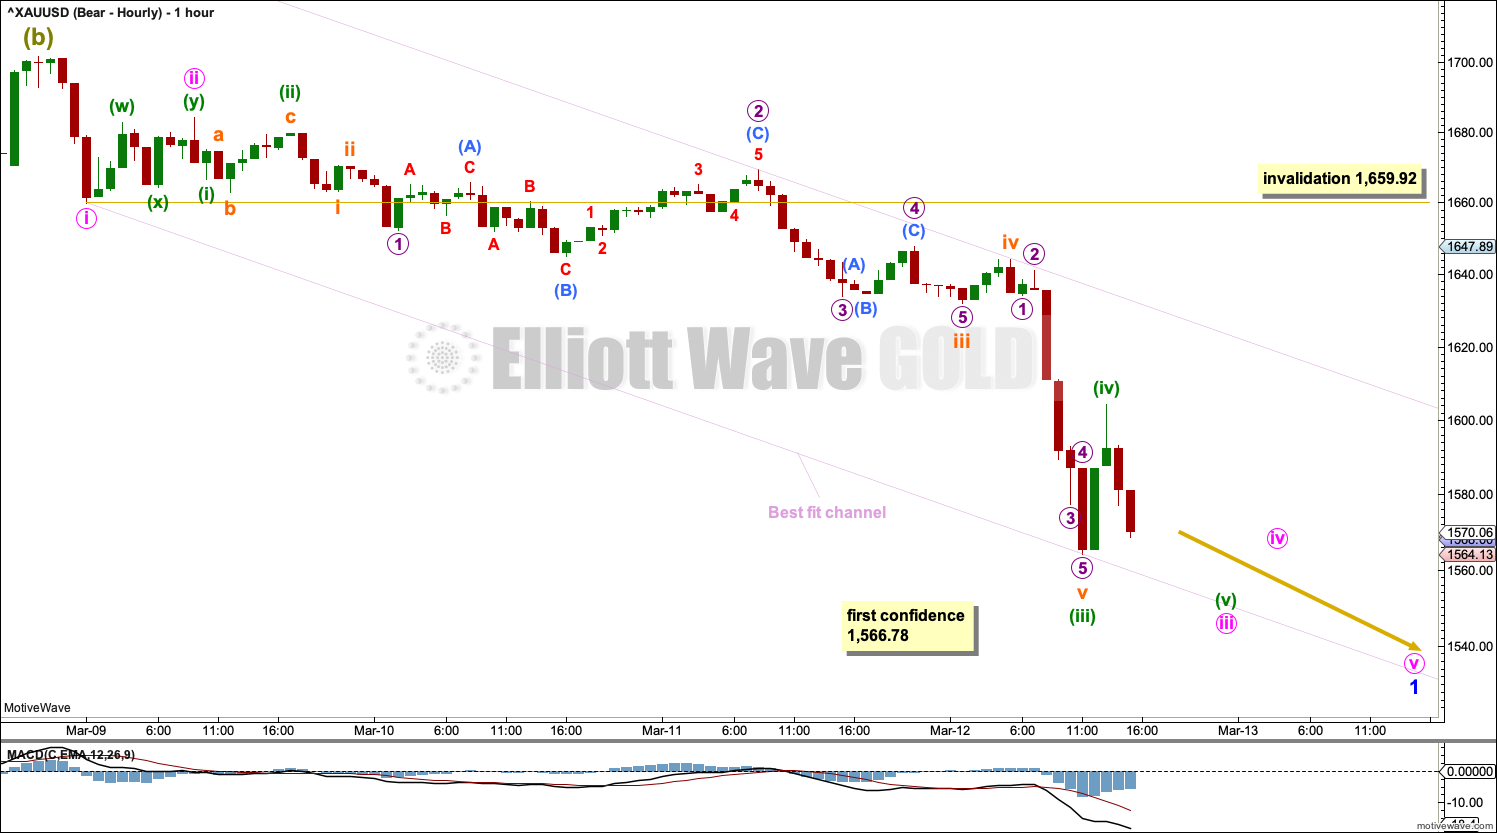
The first five down on the hourly chart is labelled minor wave 1, and it may be nearing completion. Within minor wave 1, minute wave iv may not move into minute wave i price territory above 1,659.92.
A best fit channel is drawn about minor wave 1. If this channel is breached by upwards movement, then it may indicate minor wave 1 is over and minor wave 2 may have begun. Minor wave 2 may not move beyond the start of minor wave 1 above 1,701.61.
BULLISH ELLIOTT WAVE COUNT
WEEKLY CHART
Click chart to enlarge.
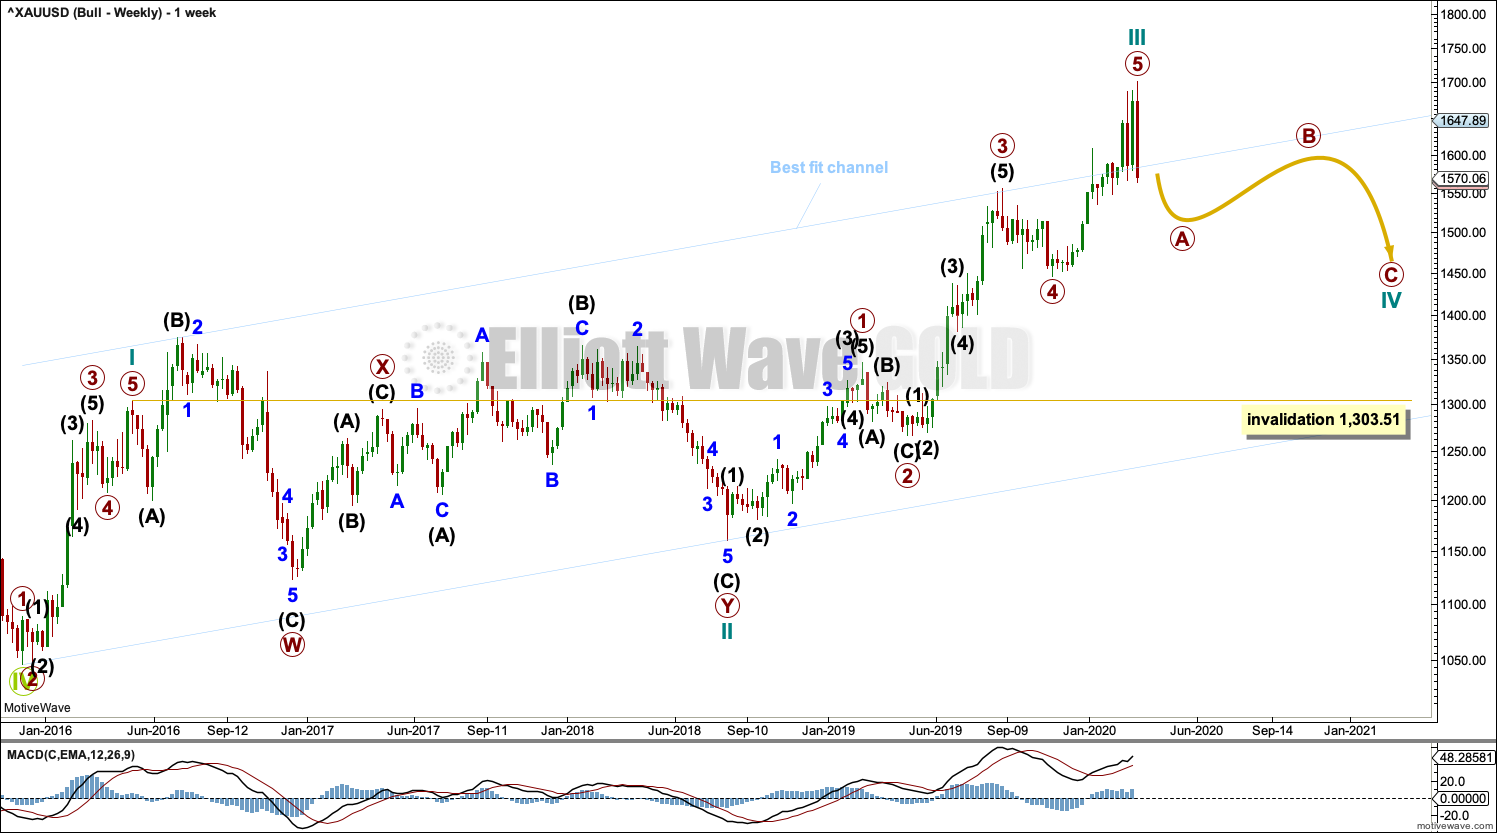
This wave count sees the the bear market complete at the last major low for Gold on 3 December 2015.
If Gold is in a new bull market, then it should begin with a five wave structure upwards on the weekly chart.
Cycle wave I fits as a five wave impulse with reasonably proportionate corrections for primary waves 2 and 4. This resolves a previous major problem with the bullish wave count.
Cycle wave II now fits as a double flat. However, a problem arises with the relabelling of this structure. Within the first flat correction labelled primary wave W, this wave count now needs to ignore what looks like an obvious triangle from July to September 2016 (this can be seen labelled as a triangle on the bear wave count above). This movement must now be labelled as a series of overlapping first and second waves.
Within the first flat correction labelled primary wave W of the double flat of cycle wave II, intermediate wave (B) is 1.69 the length of intermediate wave (A). This is longer than the common range of up to 1.38, but within an allowable guideline of up to 2. The length of intermediate wave (B) reduces the probability of this wave count.
Cycle wave III may be complete. Cycle wave IV may not move into cycle wave I price territory below 1,303.51.
DAILY CHART
Click chart to enlarge.
Cycle wave III may be complete. Cycle wave IV may not move into cycle wave I price territory below 1,303.51.
Cycle wave II was relatively deep at 0.55 of cycle wave I. If cycle wave IV exhibits alternation in depth, it may more likely be shallow; the first target at 0.382 of cycle wave III would be preferred.
Cycle wave II was a very long lasting double combination. It lasted 119 weeks. Cycle wave IV may most likely be a zigzag, which tend to be quicker structures, but it would still be expected to last several months.
TECHNICAL ANALYSIS
WEEKLY CHART
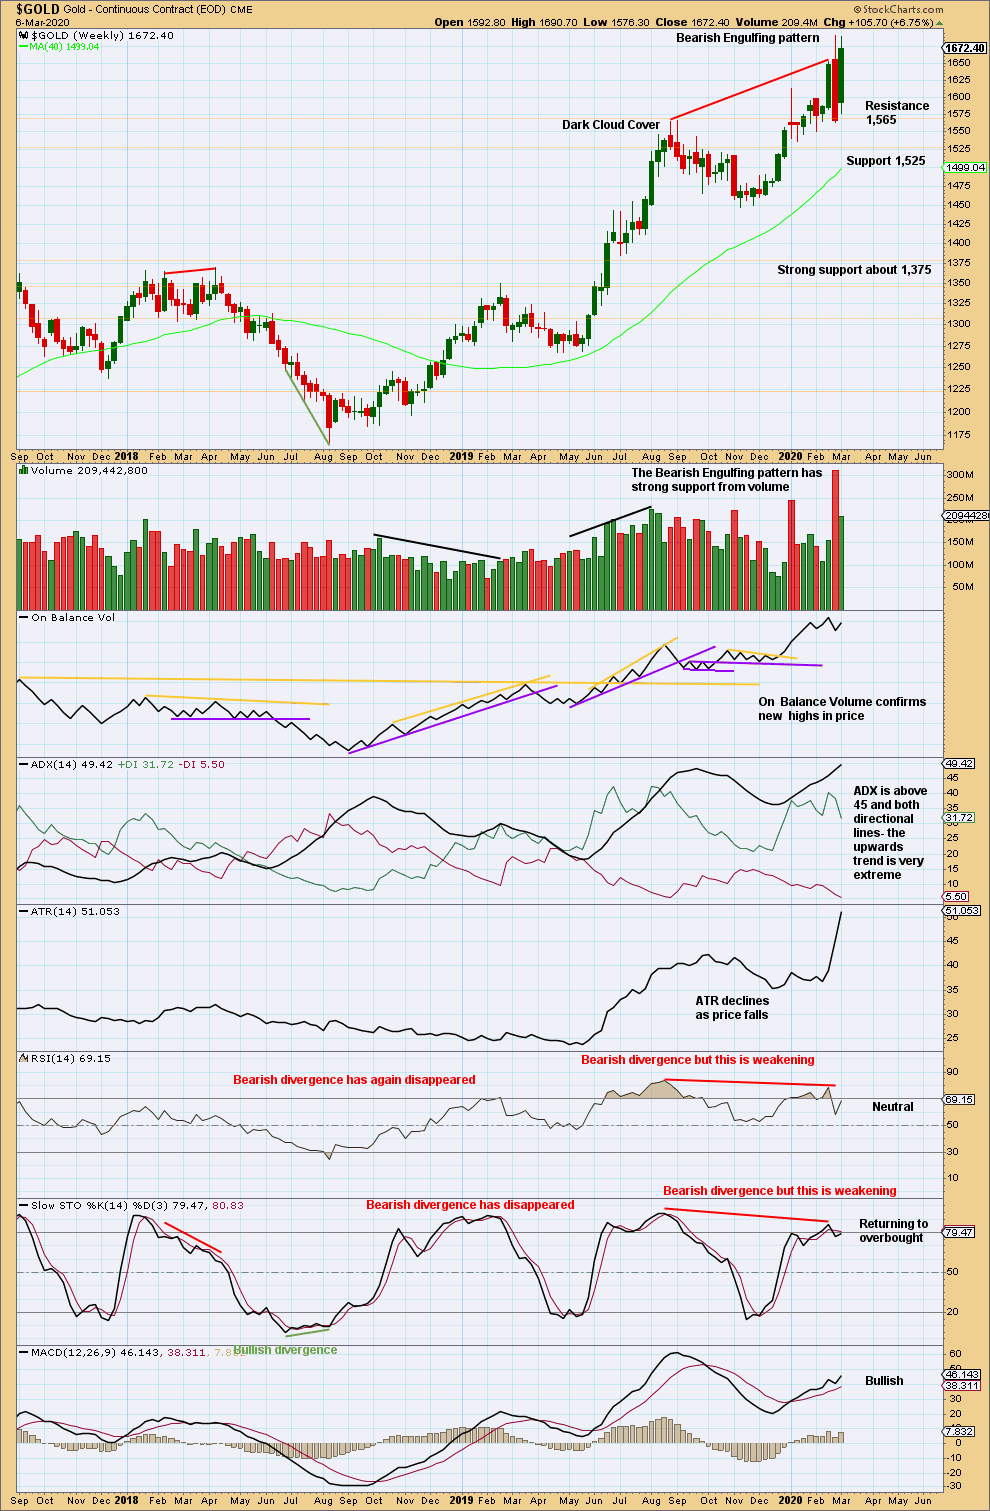
Click chart to enlarge. Chart courtesy of StockCharts.com.
The upwards trend remains very extreme. The risk of a deep pullback or a large consolidation, or a 180° trend change, is high.
DAILY CHART
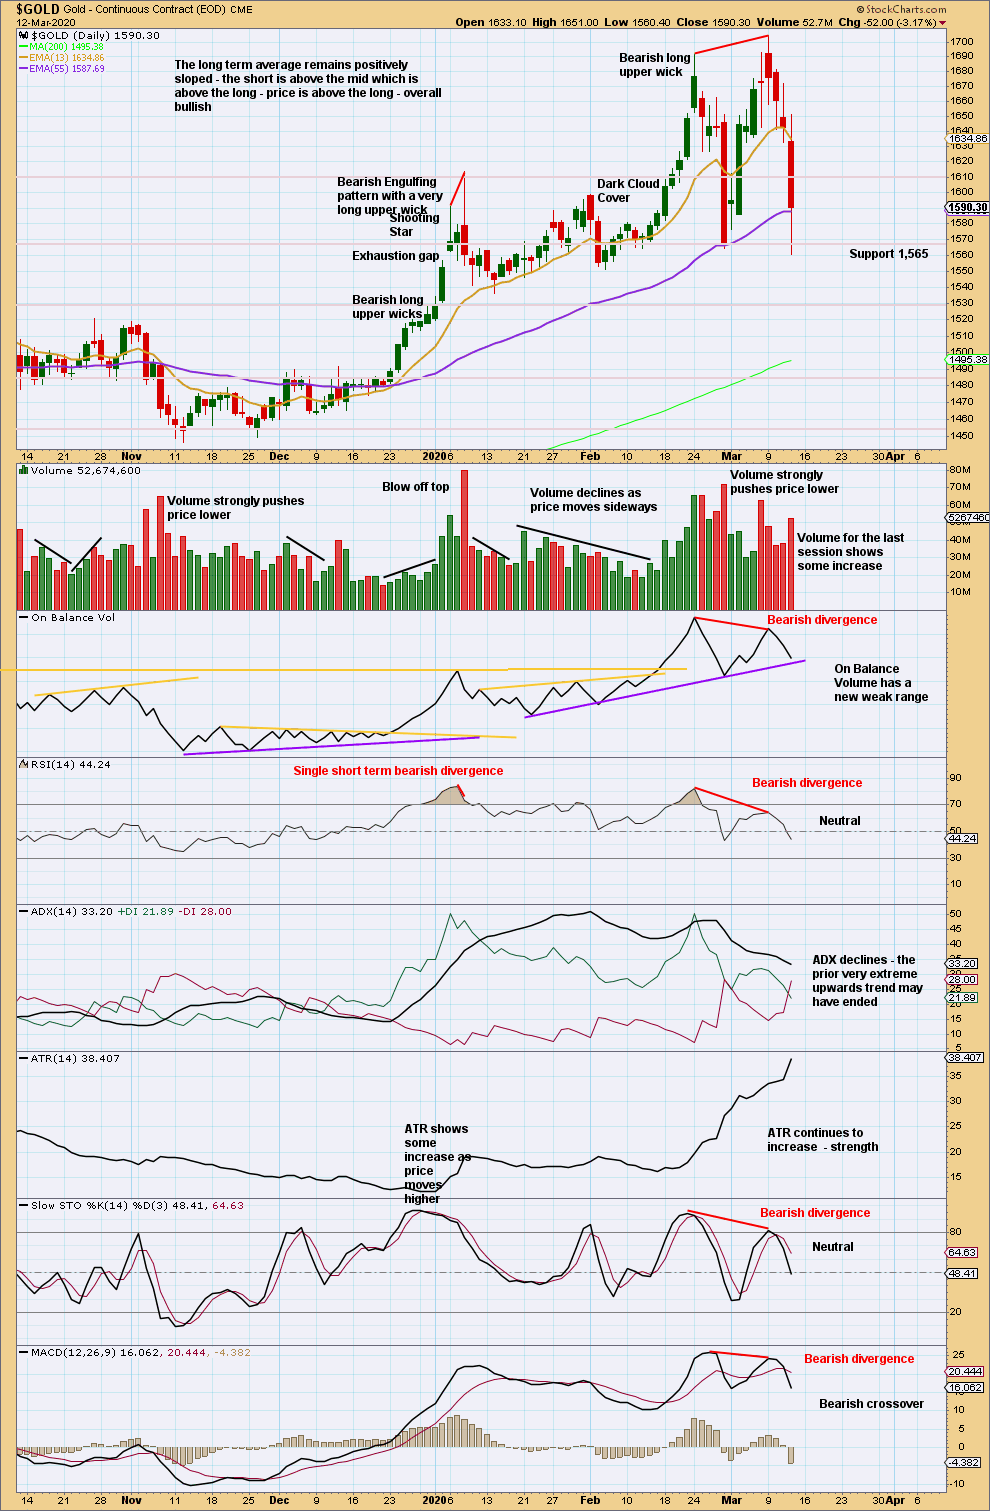
Click chart to enlarge. Chart courtesy of StockCharts.com.
There is now bearish divergence between price and all of On Balance Volume, RSI, Stochastics and MACD. The risk of a trend change to either sideways or a 180° change is high. A new swing low below 1,564 (February 28, 2020) provides some indiction of a possible trend change.
GDX WEEKLY CHART

Click chart to enlarge. Chart courtesy of StockCharts.com.
GDX is a reasonable distance off new highs. The last signal was very bearish from a strong Bearish Engulfing pattern.
GDX DAILY CHART
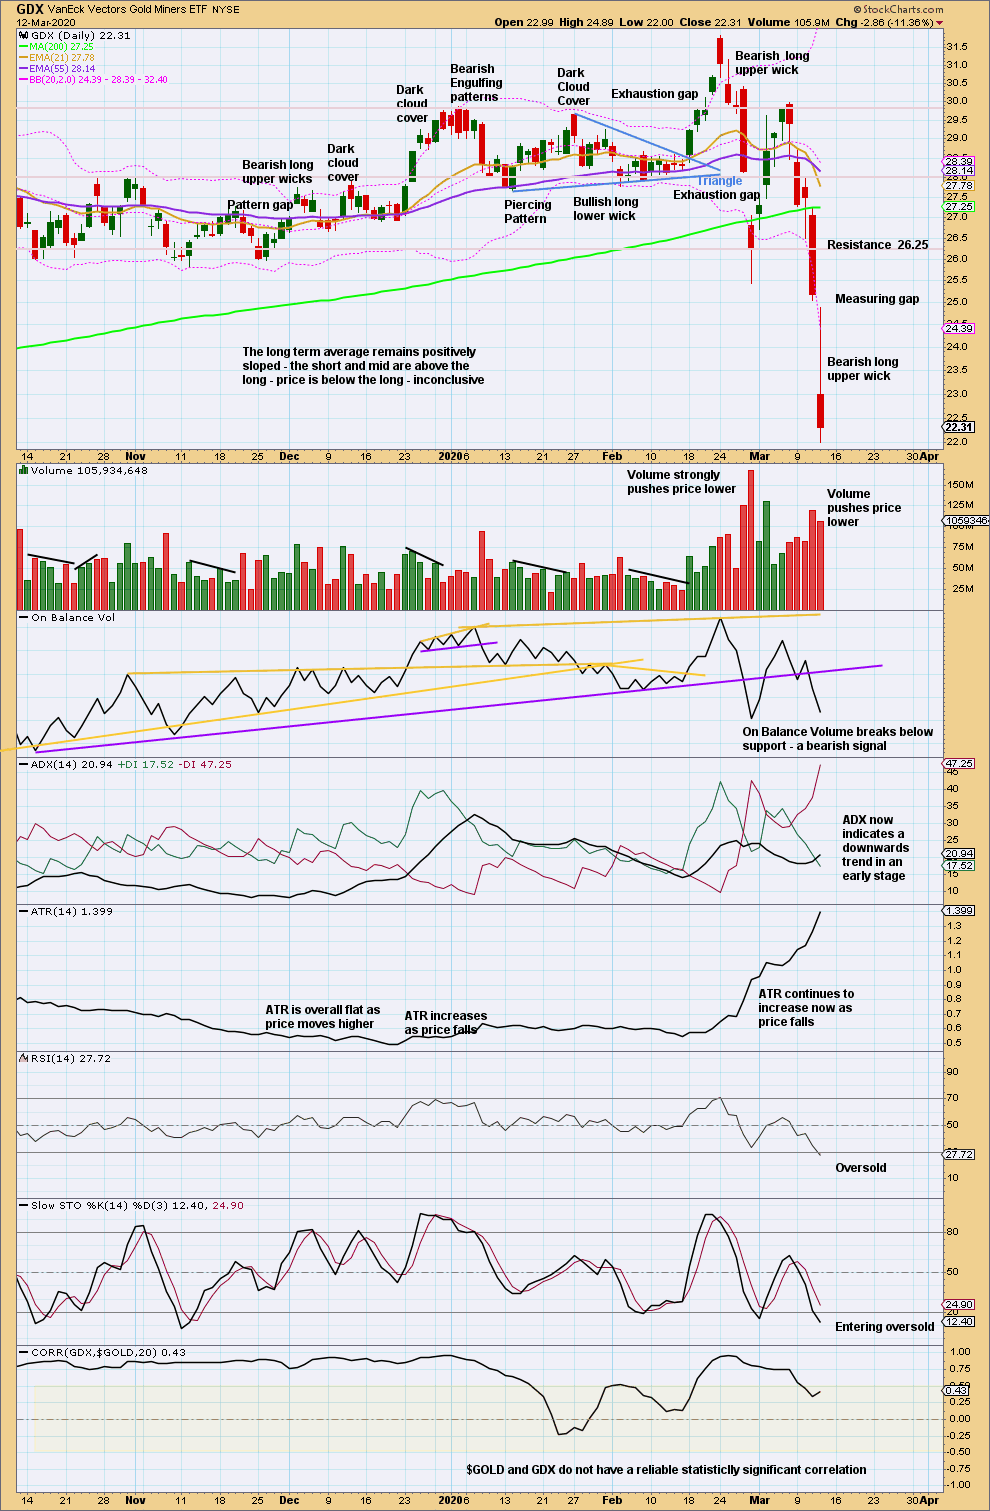
Click chart to enlarge. Chart courtesy of StockCharts.com.
There has been a trend change to downwards. This trend has support from volume pushing price lower and exhibits strength in increasing ATR. Support about 23.5 has broken. Next support is about 20.5. The bearish wick today suggests more downwards movement.
Published @ 06:22 p.m. EST.
—
Careful risk management protects your trading account(s).
Follow my two Golden Rules:
1. Always trade with stops.
2. Risk only 1-5% of equity on any one trade.
—
New updates to this analysis are in bold.
Thanks for the post. Looking at the chart every 8 year low was higher than the previous low except for year 2000 where 30 year trend reversed.
so next 8 year low could arrive at much higher price level than $1045 last low in 2016. A possibility?
1976- 100
1984- 282
1992- 325
2000- 255
2008- 6811
2016- 1045
2024-???????
So from now on gold could make new high and crash to low in 2024 at much higher price than today??
Stay with EW forecast.
Updated hourly chart:
The invalidation point may be moved down. There is no Fibonacci ratio between minor 1 and 3, so there may more likely be a ratio between 5 and either of 1 or 3. 5 has passed = 1 already, so the next ratio is used.
JNUG 3 of 3 of 3 now?
Could be a panic buy into gold stocks today. Thanks to fomo!
Another cycles viewpoint that the next major bottom is due in 2024 – 2025
That was dead wrong in the 2000‘s and only 50 years long. I would not hang my hat on that. However your bear market view certainly seems reasonable based on ew.
I bought JNUG in the after hours low 7’s. Long lower wick in gold today. I think we may have one more up. GDX and GDXJ look like three wave moves down on a chart. Just thinking something different could be happening.
I must admit – looks like a 3 wave down to me too at this stage…
Could be a giant 4th wave expanding triangle to take us to new all time highs. Would surprise most people and cause the most people to lose money. That’s what the market is good at.
Hi Lara, Given the large down move in Bitcoin, are you able to post an updated chart in this thread? Thanks for your consideration.
I will be able to update Bitcoin next week, hopefully Monday.
I’ve just finished my orientation tour of Panama and I’m now back in Panama city for at least a couple of weeks. Great internet connection here.
Now I’m not travelling, I’ll have a bit more time.