
GOLD: Elliott Wave and Technical Analysis | Charts – March 13, 2020
More downwards movement was expected as most likely. A strong downwards session for Friday absolutely fits this expectation.
Summary: A new downwards trend looks most likely to now be in place. A short-term target for a bounce is at 1,464.
Grand SuperCycle analysis is here.
Monthly charts were last updated here.
BEARISH ELLIOTT WAVE COUNT
WEEKLY CHART
Click chart to enlarge.
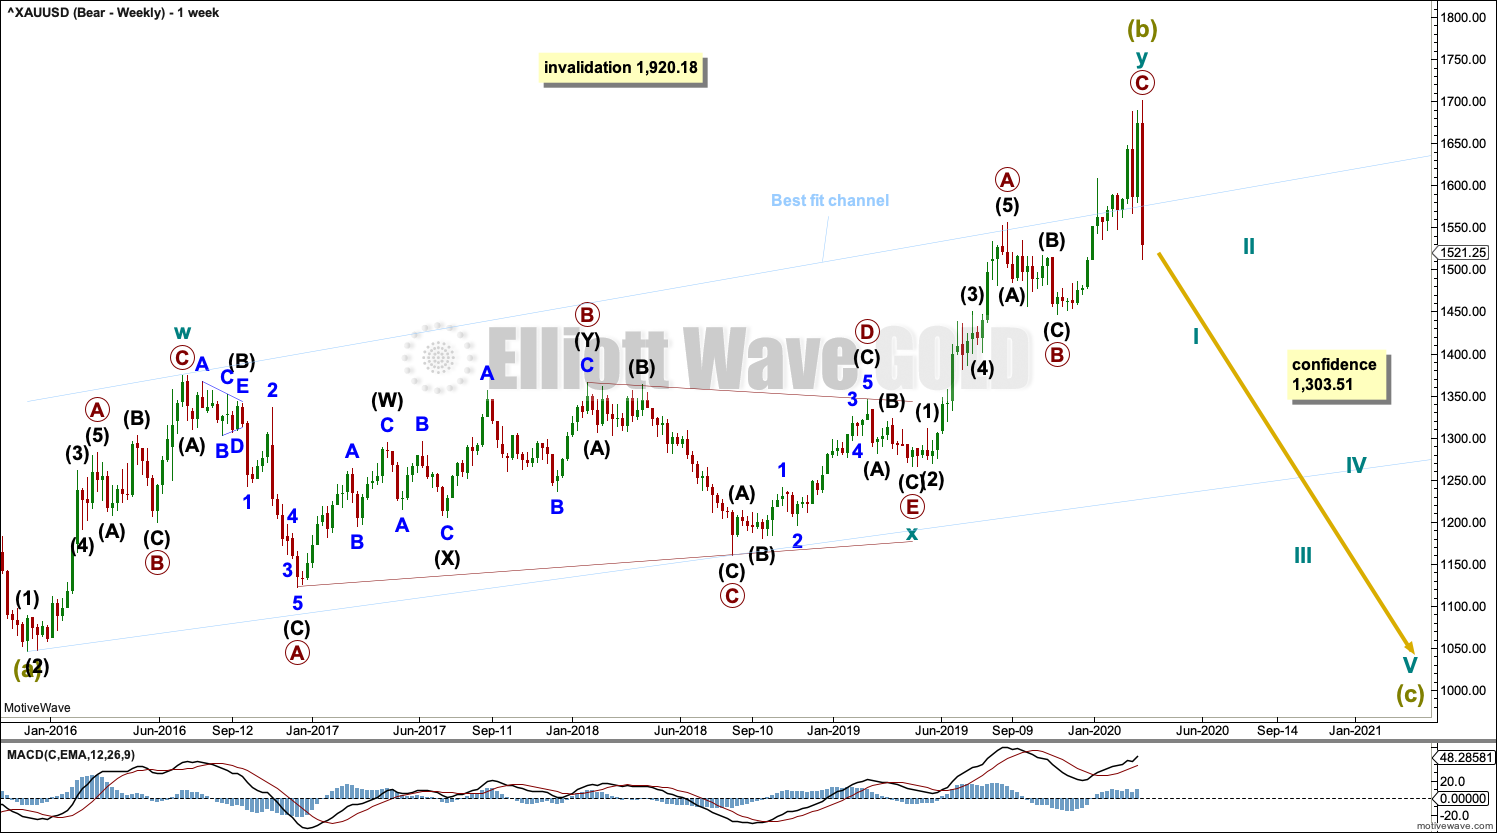
Super Cycle wave (b) may be a complete double zigzag.
The first zigzag in the double is labelled cycle wave w. The double is joined by a three in the opposite direction, a triangle labelled cycle wave x. The second zigzag in the double is labelled cycle wave y.
The purpose of the second zigzag in a double is to deepen the correction. Cycle wave y has achieved this purpose.
A wide best fit channel is added in light blue. Copy this channel over to daily charts. Price has now closed back below the upper edge of this channel.
DAILY CHART
Click chart to enlarge.
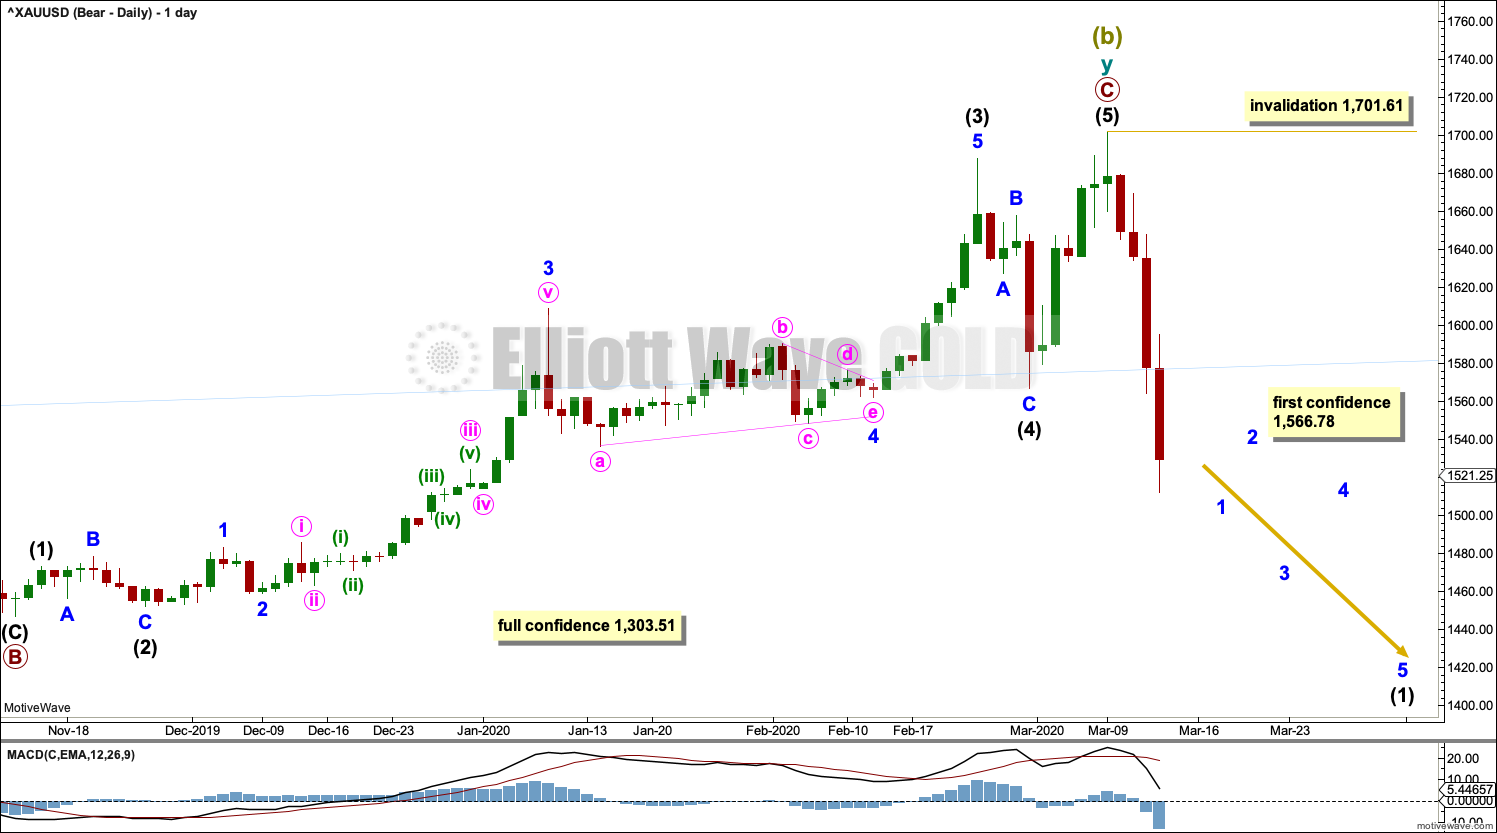
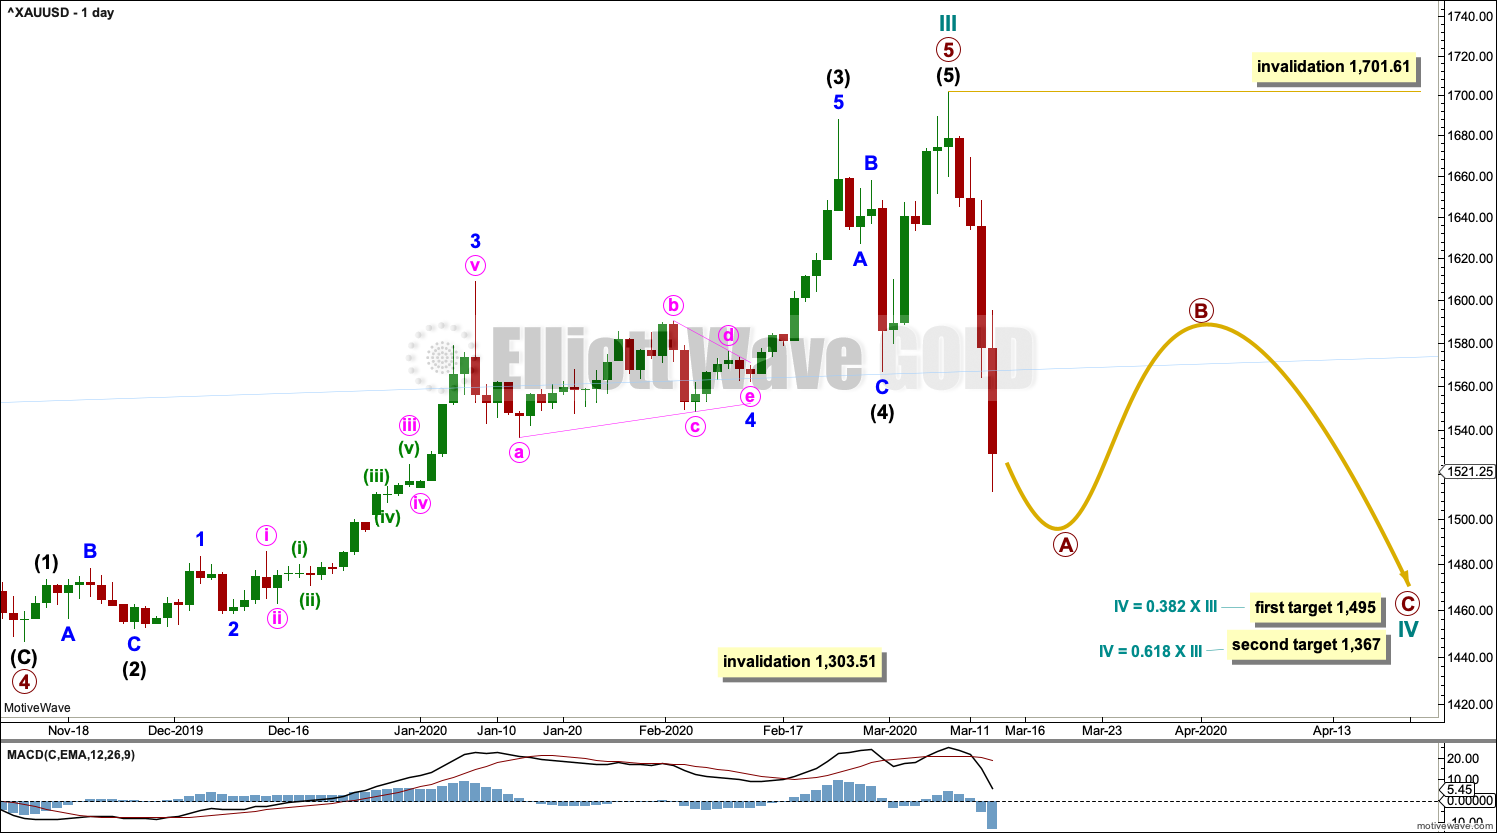
Super Cycle wave (b) may be complete.
The second zigzag in the double, labelled cycle wave y, may be complete. There is no Fibonacci ratio between primary waves A and C.
If there was a trend change at Super Cycle degree, then a five down should develop at daily, weekly and monthly time frames. The first five down at the daily chart level will be labelled intermediate wave (1), and it may be incomplete. No second wave correction may move beyond the start of its first wave above 1,701.61.
HOURLY CHART
Click chart to enlarge.
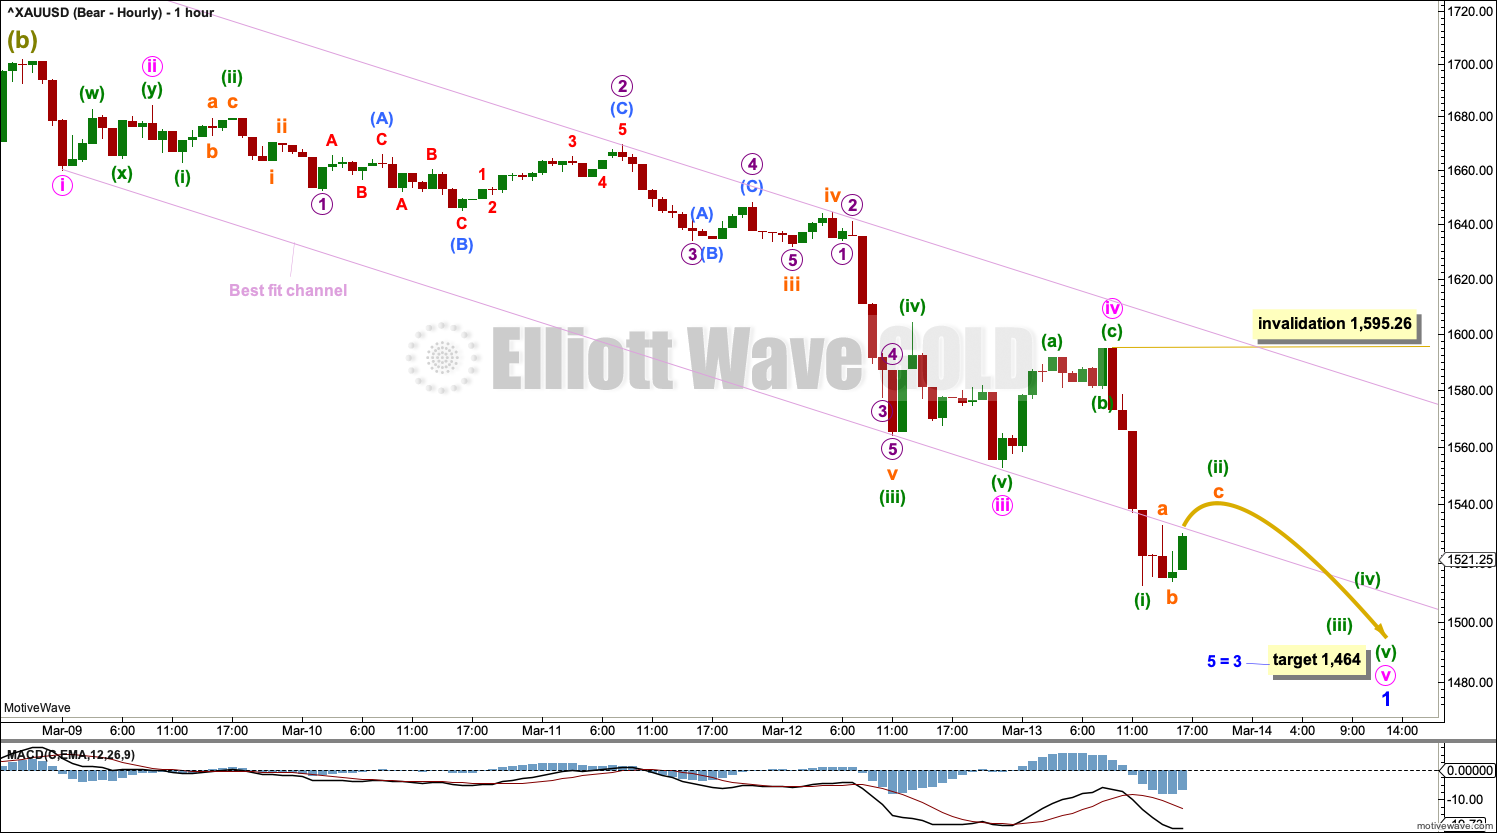
The first five down on the hourly chart is labelled minor wave 1, and it may be nearing completion. Within minor wave 1, minute waves i through to iv may now be complete. Minute wave i was not extended. Minute wave iii was extended. Minute wave v may extend; if it does, the rule stating only two of the three actionary waves may extend would be met. Within minute wave v, minuette wave (ii) may not move beyond the start of minuette wave i above 1,595.26.
If price makes a new high above 1,595.26 and breaches the upper edge of the best fit channel, then assume minor wave 1 may be over and a multi-day bounce or consolidation for minor wave 2 to come may have begun. The first second wave correction for this particular market is often very deep; expect minor wave 2 may be very deep.
Minor wave 2 may not move beyond the start of minor wave 1 above 1,701.61.
BULLISH ELLIOTT WAVE COUNT
WEEKLY CHART
Click chart to enlarge.
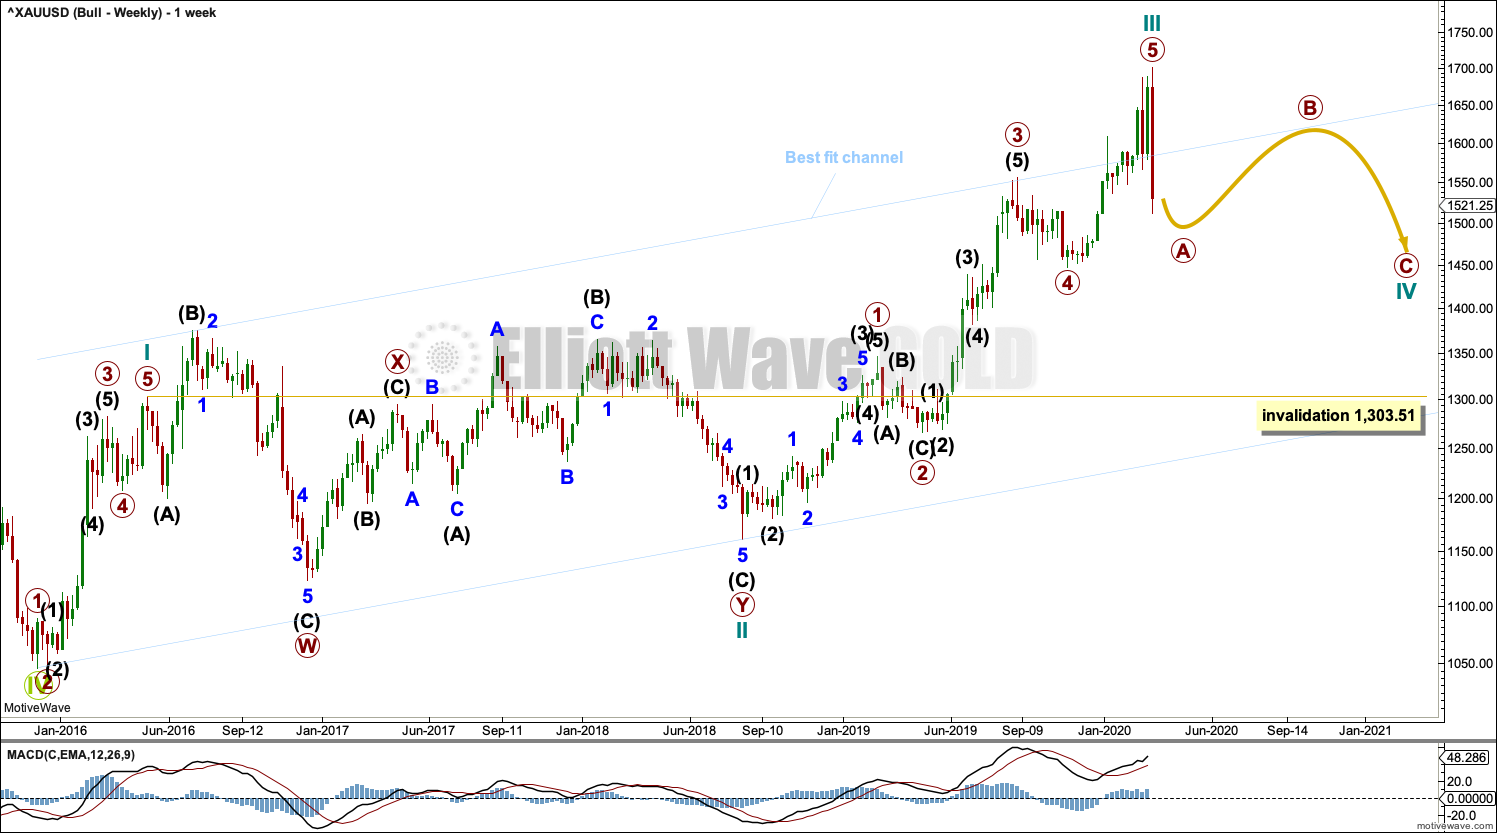
This wave count sees the the bear market complete at the last major low for Gold on 3 December 2015.
If Gold is in a new bull market, then it should begin with a five wave structure upwards on the weekly chart.
Cycle wave I fits as a five wave impulse with reasonably proportionate corrections for primary waves 2 and 4. This resolves a previous major problem with the bullish wave count.
Cycle wave II now fits as a double flat. However, a problem arises with the relabelling of this structure. Within the first flat correction labelled primary wave W, this wave count now needs to ignore what looks like an obvious triangle from July to September 2016 (this can be seen labelled as a triangle on the bear wave count above). This movement must now be labelled as a series of overlapping first and second waves.
Within the first flat correction labelled primary wave W of the double flat of cycle wave II, intermediate wave (B) is 1.69 the length of intermediate wave (A). This is longer than the common range of up to 1.38, but within an allowable guideline of up to 2. The length of intermediate wave (B) reduces the probability of this wave count.
Cycle wave III may be complete. Cycle wave IV may not move into cycle wave I price territory below 1,303.51.
DAILY CHART
Click chart to enlarge.
Cycle wave III may be complete. Cycle wave IV may not move into cycle wave I price territory below 1,303.51.
Cycle wave II was relatively deep at 0.55 of cycle wave I. If cycle wave IV exhibits alternation in depth, it may more likely be shallow; the first target at 0.382 of cycle wave III would be preferred.
Cycle wave II was a very long lasting double combination. It lasted 119 weeks. Cycle wave IV may most likely be a zigzag, which tend to be quicker structures, but it would still be expected to last several months.
TECHNICAL ANALYSIS
WEEKLY CHART
Click chart to enlarge. Chart courtesy of StockCharts.com.
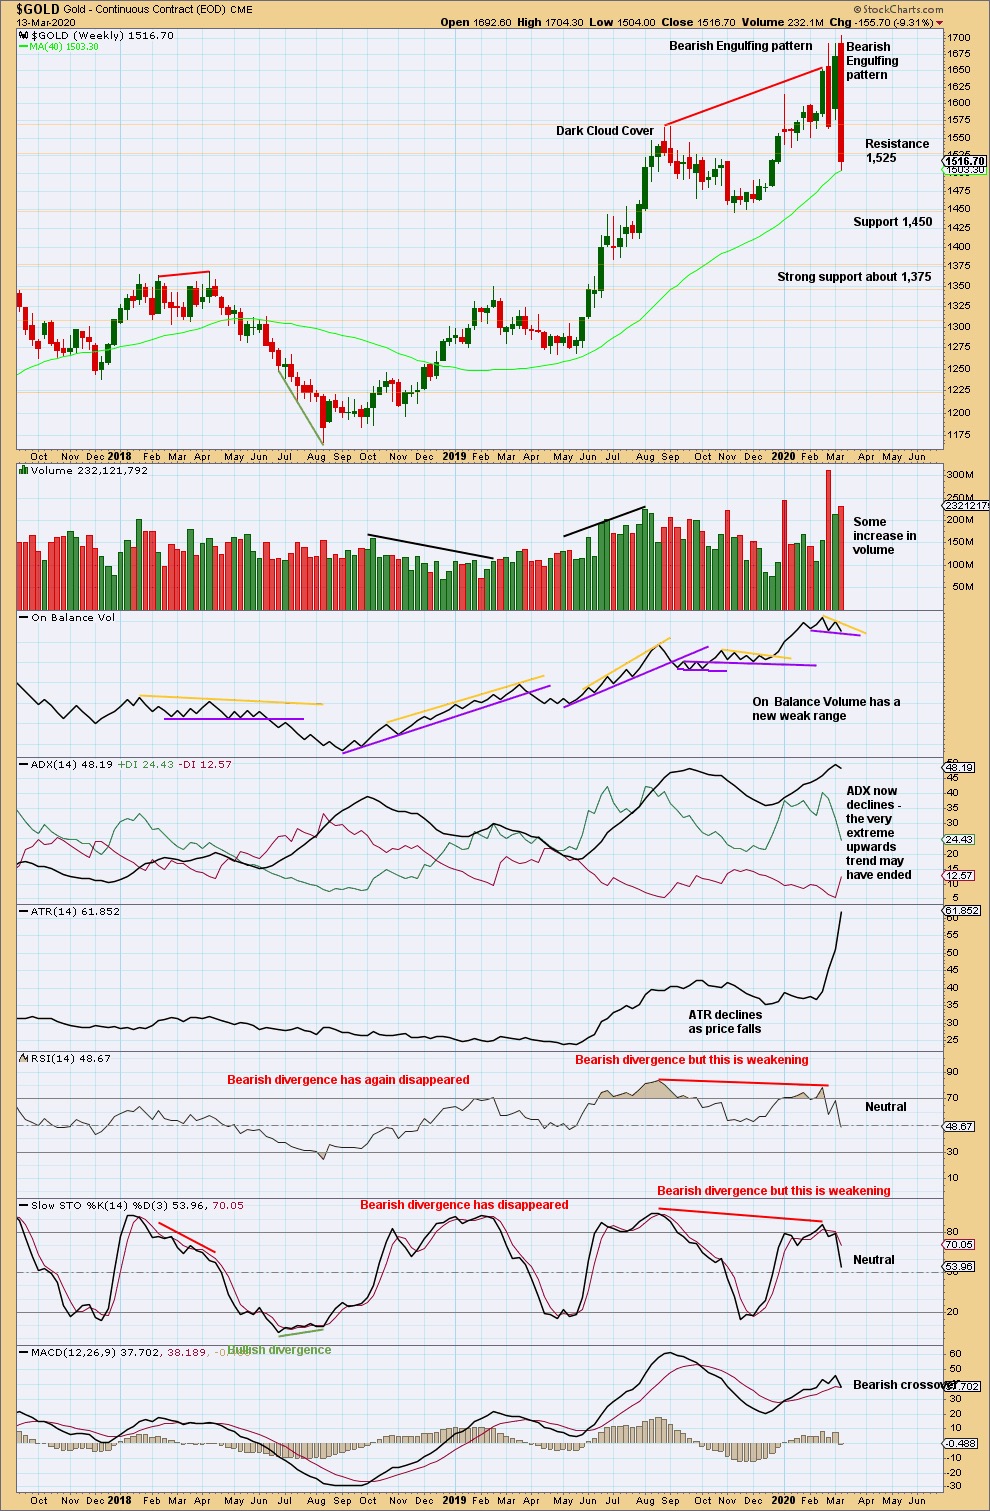
This week’s Bearish Engulfing pattern is extreme. The pattern fully engulfs the prior nine weekly candlesticks, and it has some support from volume. This strongly indicates a trend change after the upwards trend reached very extreme and conditions reached overbought and exhibited bearish divergence.
Price does not move in straight lines. Look out for bounces and consolidations on the way down. Look for support below about 1,450 to 1,455, and below that very strong support about 1,375.
DAILY CHART
Click chart to enlarge. Chart courtesy of StockCharts.com.
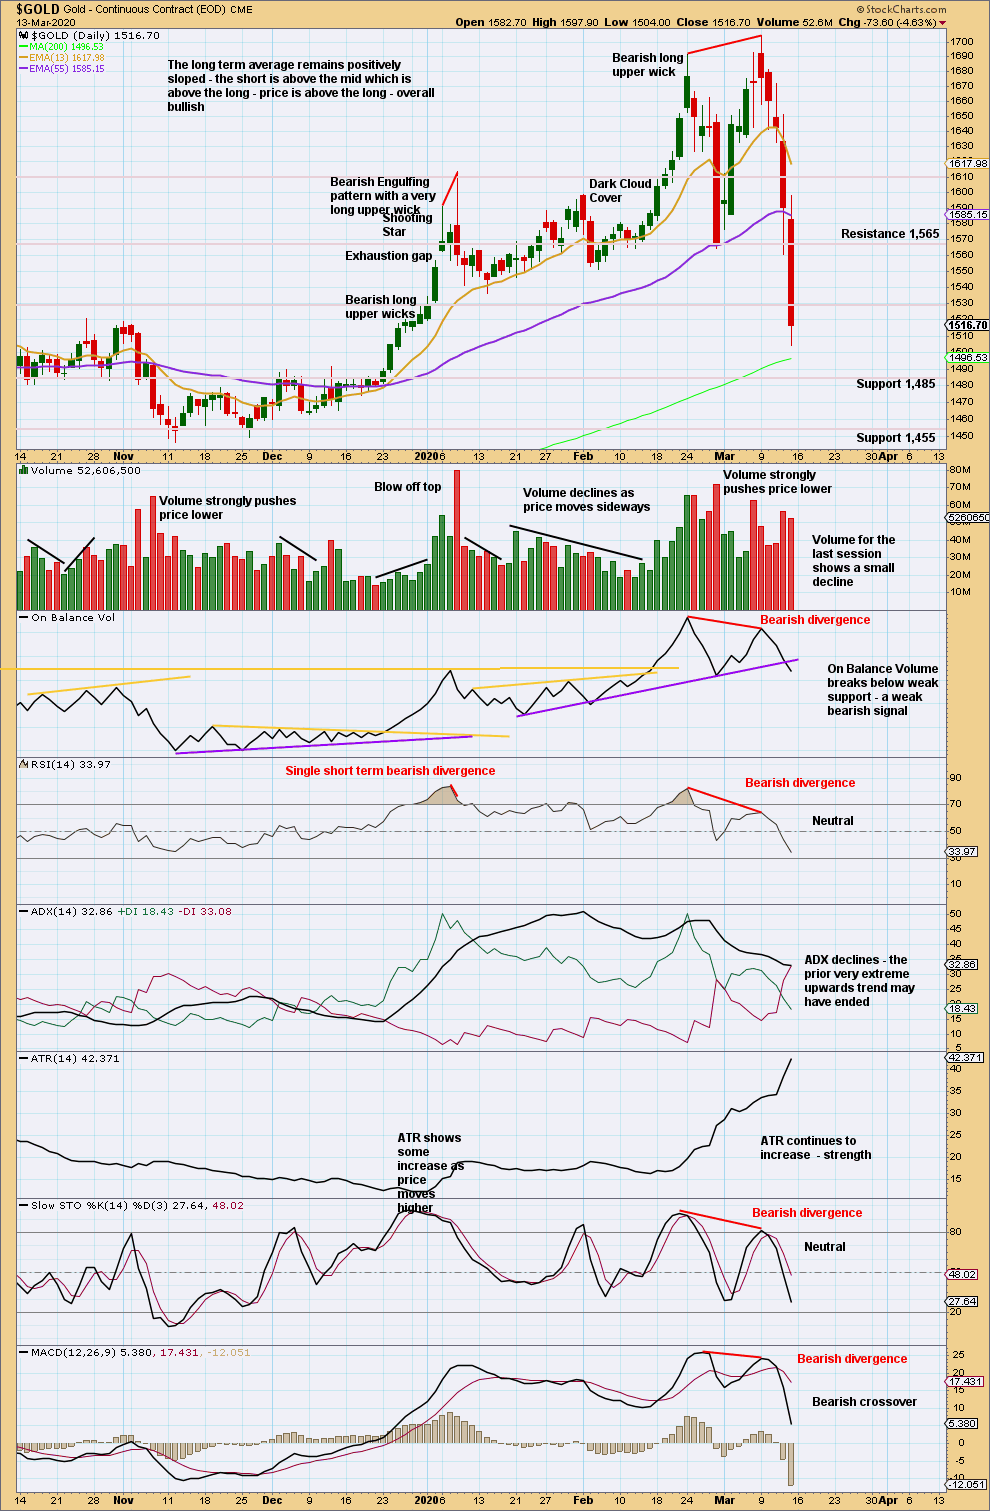
There is now bearish divergence between price and all of On Balance Volume, RSI, Stochastics and MACD. The risk of a trend change to either sideways or a 180° change is high. A new swing low below 1,564 (February 28, 2020) provides some indiction of a possible trend change.
GDX WEEKLY CHART
Click chart to enlarge. Chart courtesy of StockCharts.com.
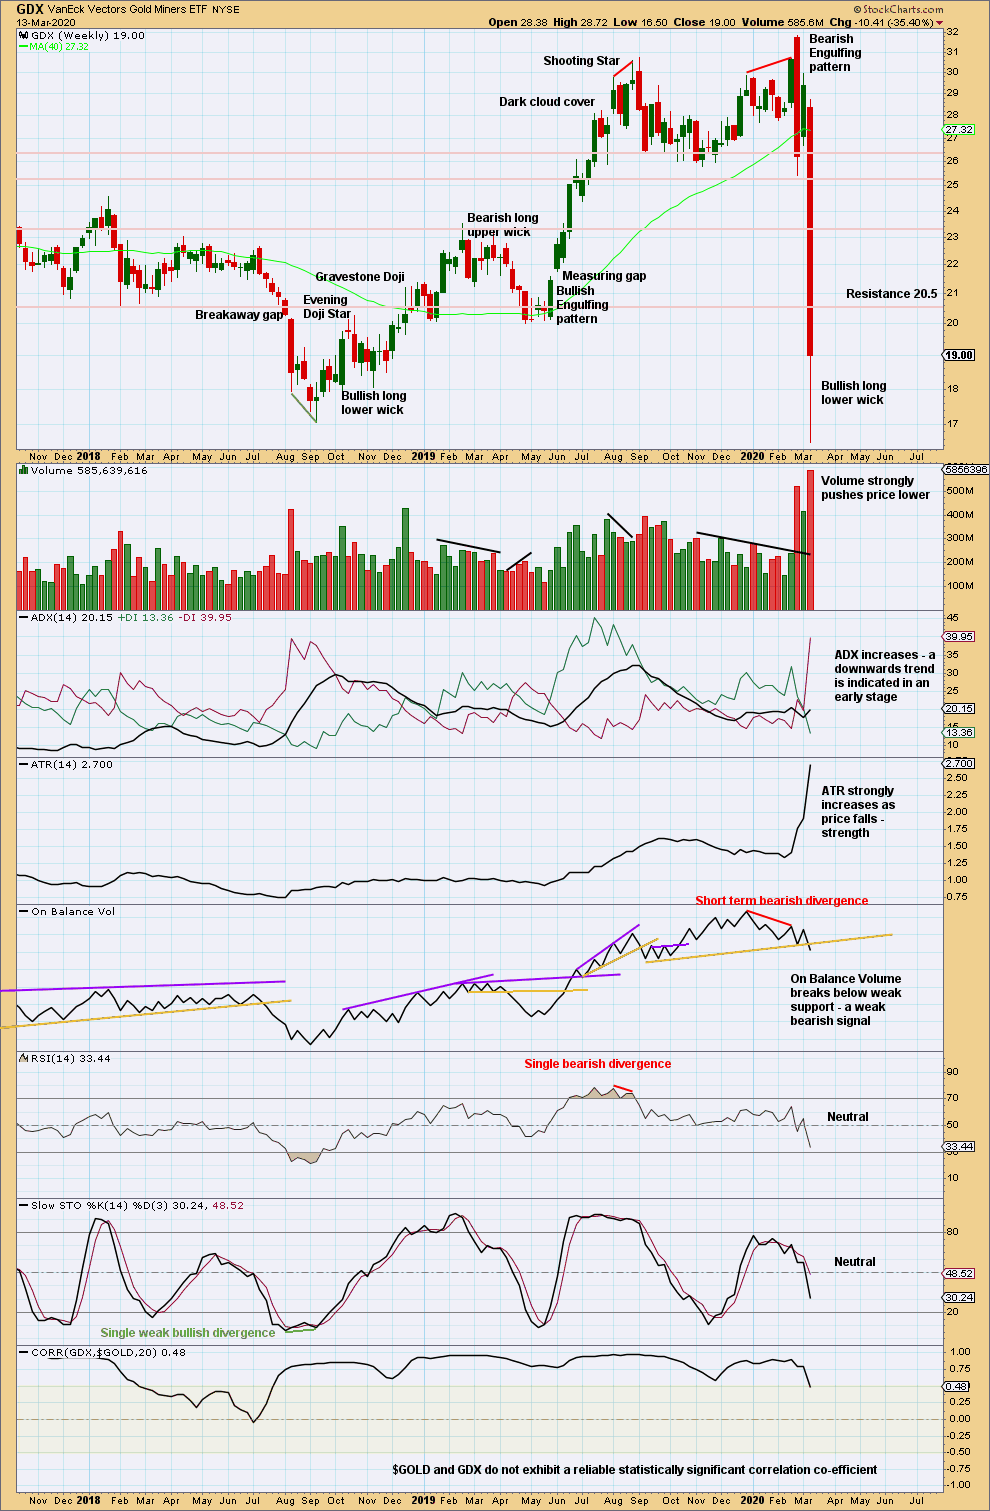
GDX is a reasonable distance off new highs. The last signal was very bearish from a strong Bearish Engulfing pattern.
There is support below in a zone about 16.75 to 15.85.
GDX DAILY CHART
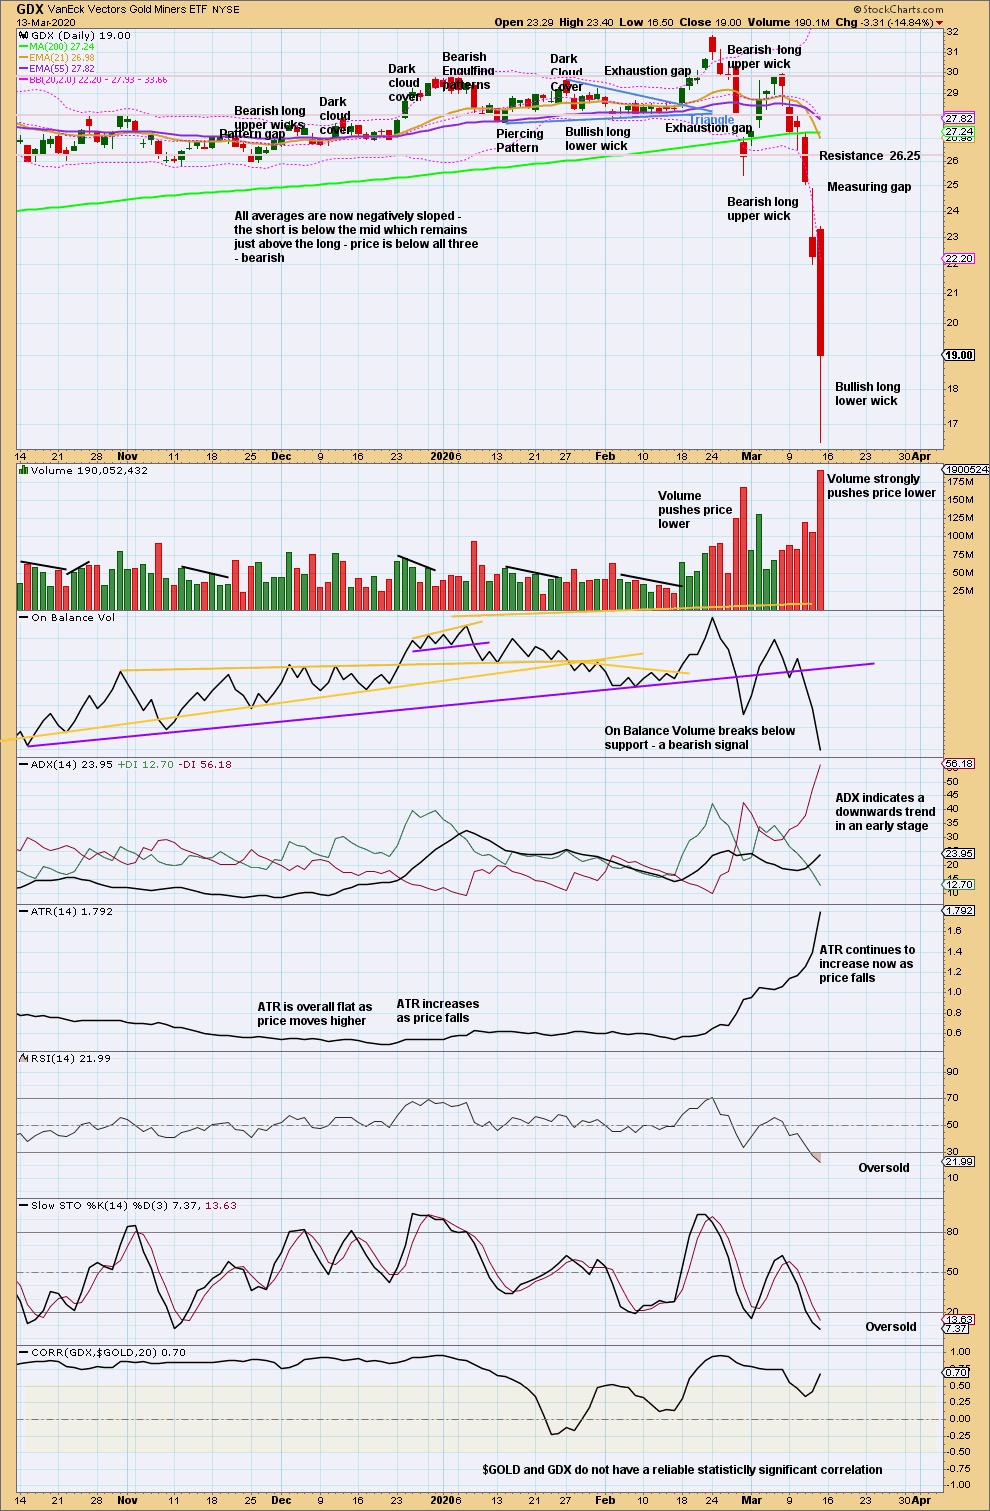
Click chart to enlarge. Chart courtesy of StockCharts.com.
There has been a trend change to downwards. This trend has support from volume pushing price lower and exhibits strength in increasing ATR.
A bullish long lower wick suggests a bounce may come early next week. When price is in a downwards trend, bounces and consolidations may present opportunities to join a trend.
Published @ 01:10 p.m. EST on March 14, 2020.
—
Careful risk management protects your trading account(s).
Follow my two Golden Rules:
1. Always trade with stops.
2. Risk only 1-5% of equity on any one trade.
—
New updates to this analysis are in bold.
Lara, glad you are enjoying traveling. Just hope you’re carrying tons of hand sanitizer! Envy your travels!
Would you be able to provide an hourly count for the bull chart until the bull scenario is completely invalidated? Price points at possible turns comparing to bear count is helpful for me.
Also, I’m curious and been wanting to ask if you or Cesar have been buying any physical metals over the past 4 years (at low of course) ?
Sadly I am not enjoying my travels anymore as Cesar and I are alone together in lock down in a small apartment in Panama City. I don’t speak the language and it’s gone from being exciting and strange to scary and strange. But so far we are safe and well.
We have not bought any metals.
I will publish hourly charts for both counts for you.
😣 ouch. This is a mess for all of us and especially for travelers. Best wishes.
I was thinking ouch too – before I saw Dreamer’s response– okay, so I hope the lock down isn’t toooo long. I wonder if those videos about learning a language in only hours works? Okay I’ll shut up now. 😉
Very strong volume in gold and the miners this morning.
wow >> Lara subs are impressed.
Bearish count target hit: 1466 +/-
Bullish count target hit : Same as above
Excellent analysis thanks.
Thank you for the feedback Papudi, and you’re most welcome.
The federal reserve dropped rates to zero and instituted QE5 tonight. The fed is in full panic mode. I will be watching golds reaction closely. I have about 8k shares of Jnug. I hope the bounce is a good one. In it for 7.6 a share. Last trade in normal time 4.69. 52 week high at 104.