
GOLD: Elliott Wave and Technical Analysis | Charts – March 18, 2020
An inside day leaves the short-term picture essentially the same. Both Elliott wave counts remain valid.
Summary: A bounce may have begun. It is most likely to be fairly deep. It may be either quick and sharp, or it may be a time consuming sideways consolidation. The 0.618 Fibonacci ratio at 1,602 may be a preferred target.
Grand SuperCycle analysis is here.
Monthly charts were last updated here.
BEARISH ELLIOTT WAVE COUNT
WEEKLY CHART
Click chart to enlarge.
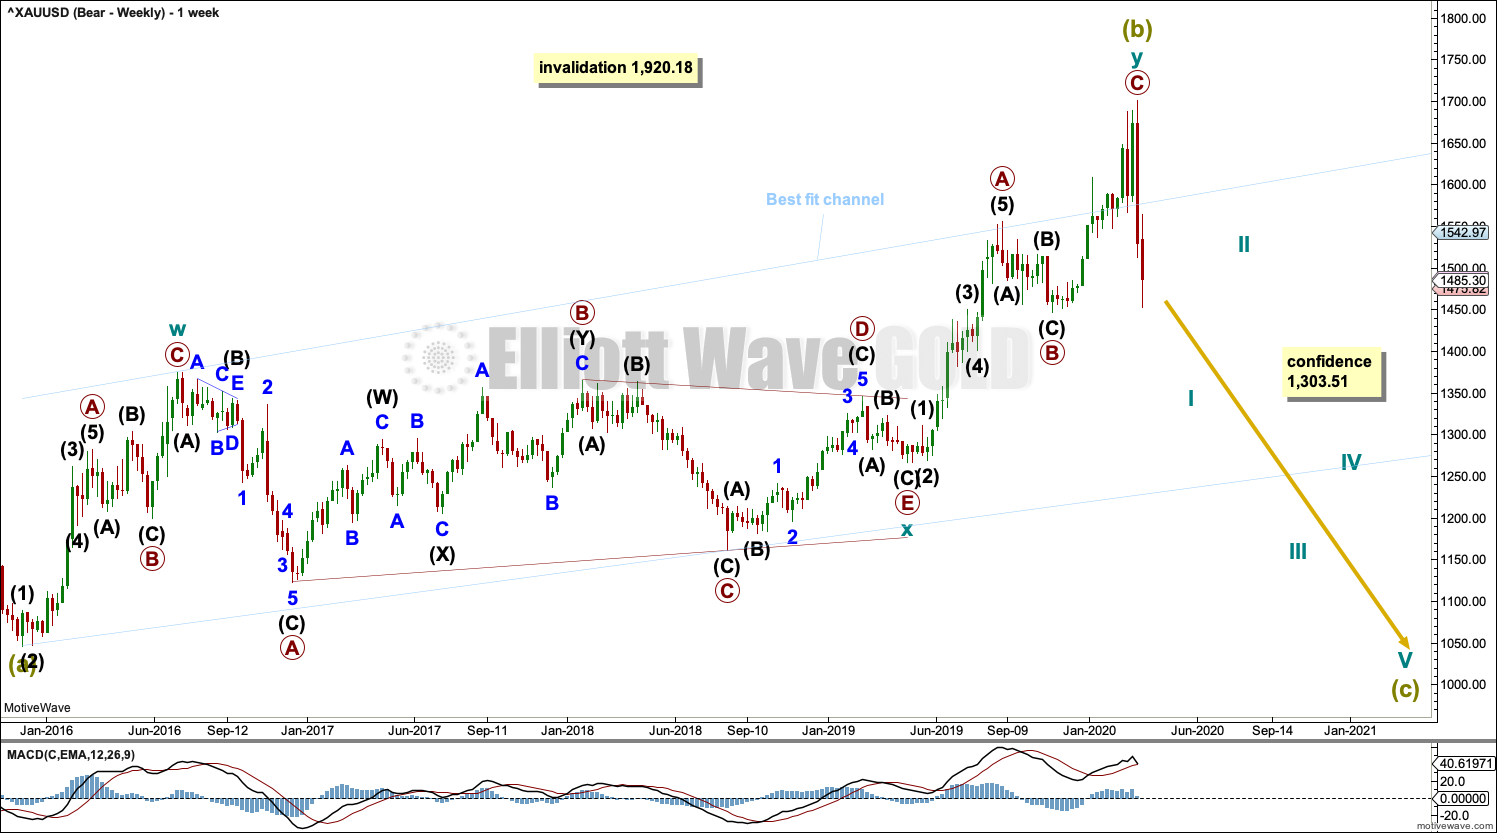
Super Cycle wave (b) may be a complete double zigzag.
The first zigzag in the double is labelled cycle wave w. The double is joined by a three in the opposite direction, a triangle labelled cycle wave x. The second zigzag in the double is labelled cycle wave y.
The purpose of the second zigzag in a double is to deepen the correction. Cycle wave y has achieved this purpose.
A wide best fit channel is added in light blue. Copy this channel over to daily charts. Price has now closed back below the upper edge of this channel.
DAILY CHART
Click chart to enlarge.
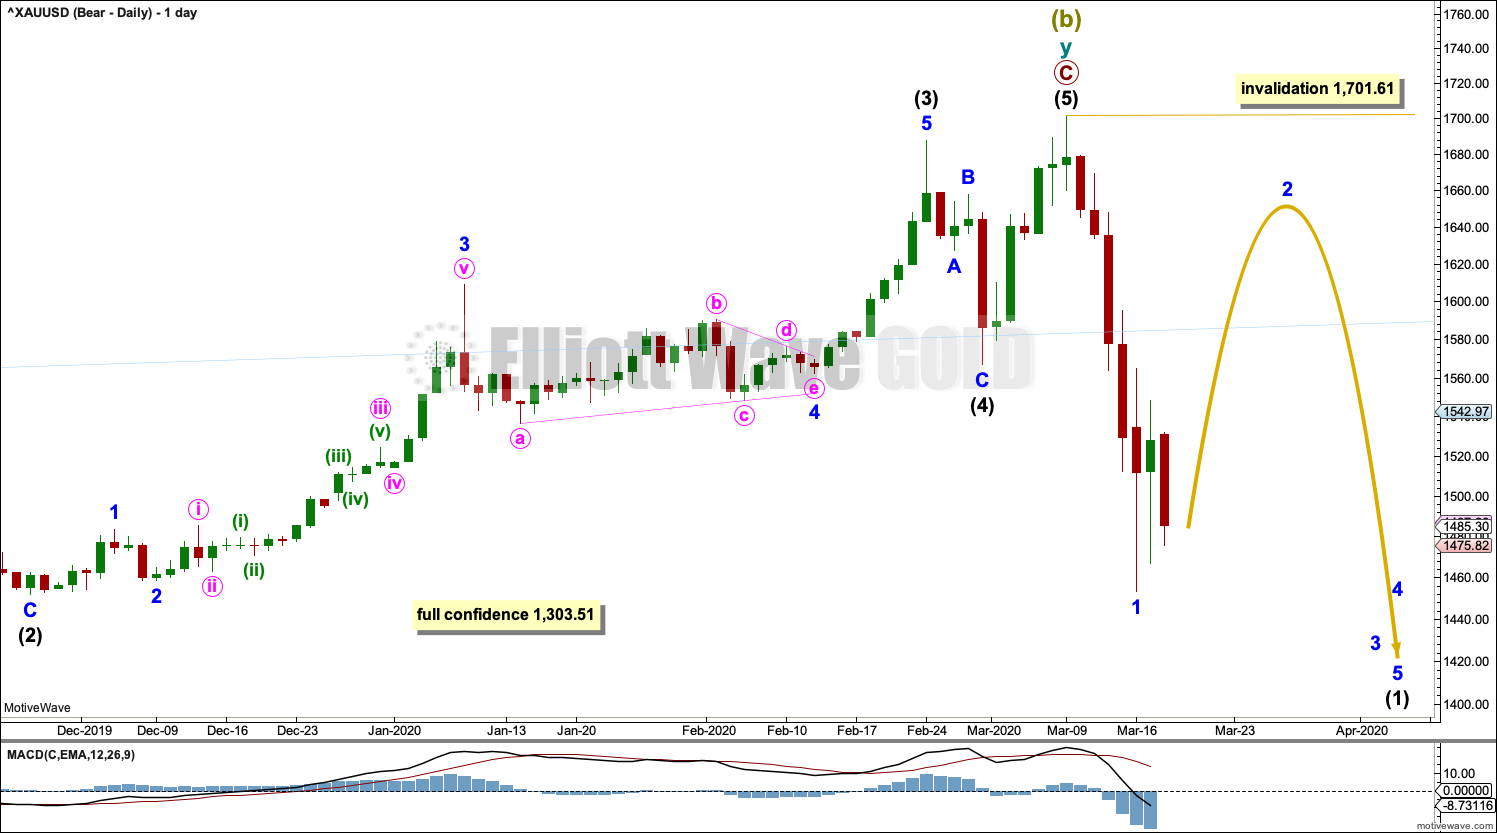
Super Cycle wave (b) may be complete.
The second zigzag in the double, labelled cycle wave y, may be complete. There is no Fibonacci ratio between primary waves A and C.
If there was a trend change at Super Cycle degree, then a five down should develop at daily, weekly and monthly time frames. The first five down at the daily chart level will be labelled intermediate wave (1), and it may be incomplete. Within intermediate wave (1), minor wave 1 may now be complete and minor wave 2 may not move beyond the start of minor wave 1 above 1,701.61.
HOURLY CHART
Click chart to enlarge.
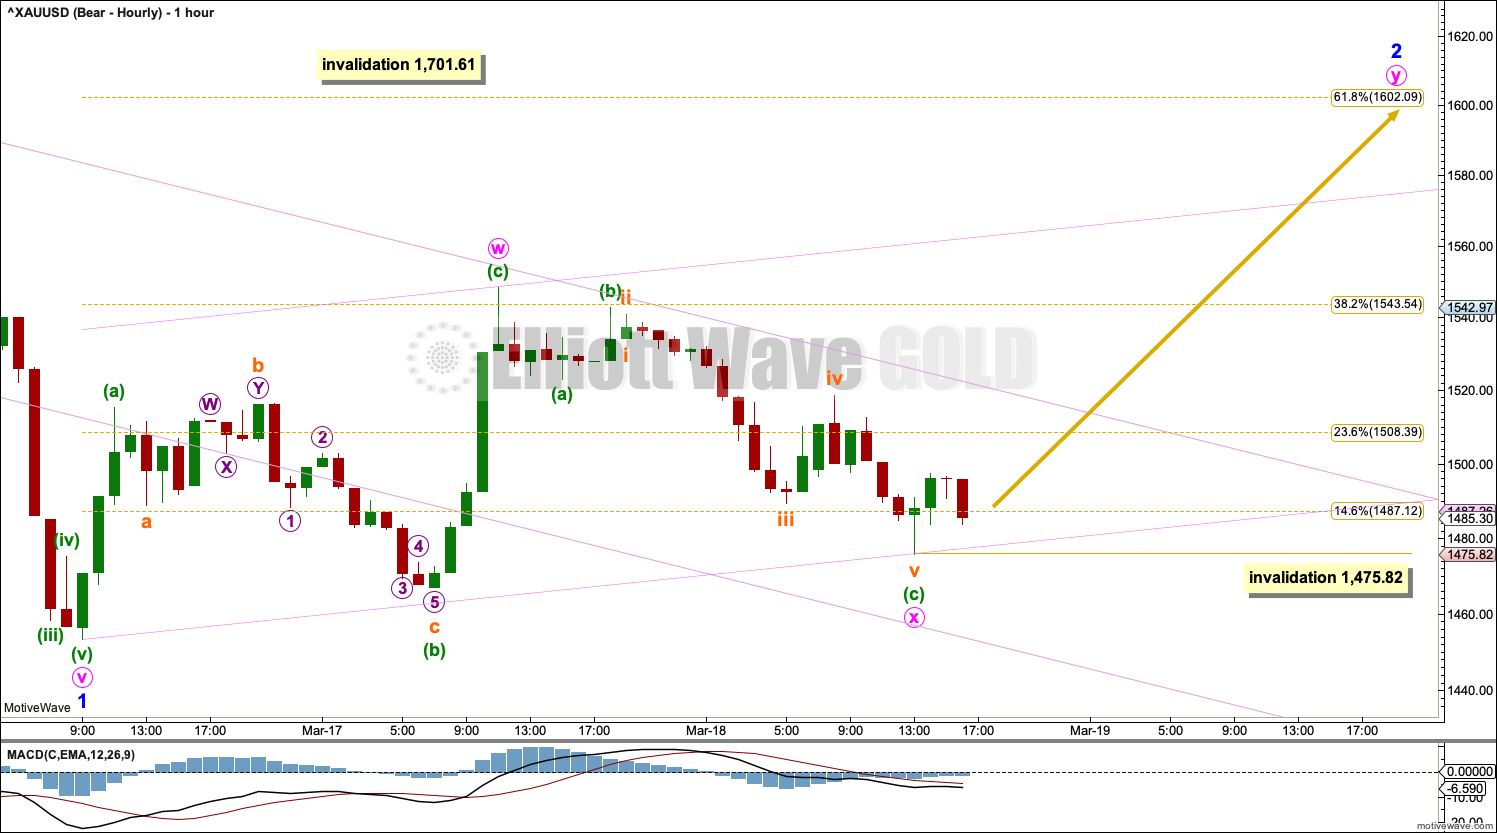
The first five down on the hourly chart is labelled minor wave 1, and it may be now complete.
Minor wave 2 may be reasonably expected to most likely be very deep. The 0.618 Fibonacci ratio may be favoured; this target may not be high enough. Gold typically exhibits very deep corrections at the beginning of its new trends.
Minor wave 2 may subdivide as any Elliott wave corrective structure except a triangle. It would most likely subdivide as a single or multiple zigzag by a fairly wide margin.
Minor wave 2 may be subdividing as a double zigzag. The first zigzag in the double may be complete and is labelled minute wave w. The double may now be joined by a three in the opposite direction, which may also be complete and is labelled minute wave x. A second zigzag in a double may end close to the 0.618 Fibonacci ratio.
Within minute wave y, no second wave correction nor B wave may move beyond its start below 1,475.82.
Labelling for primary wave B on the alternate hourly chart also would work for minor wave 2. Minor wave 2 may subdivide as a flat or combination.
Minor wave 2 may not move beyond the start of minor wave 1 above 1,701.61.
BULLISH ELLIOTT WAVE COUNT
WEEKLY CHART
Click chart to enlarge.
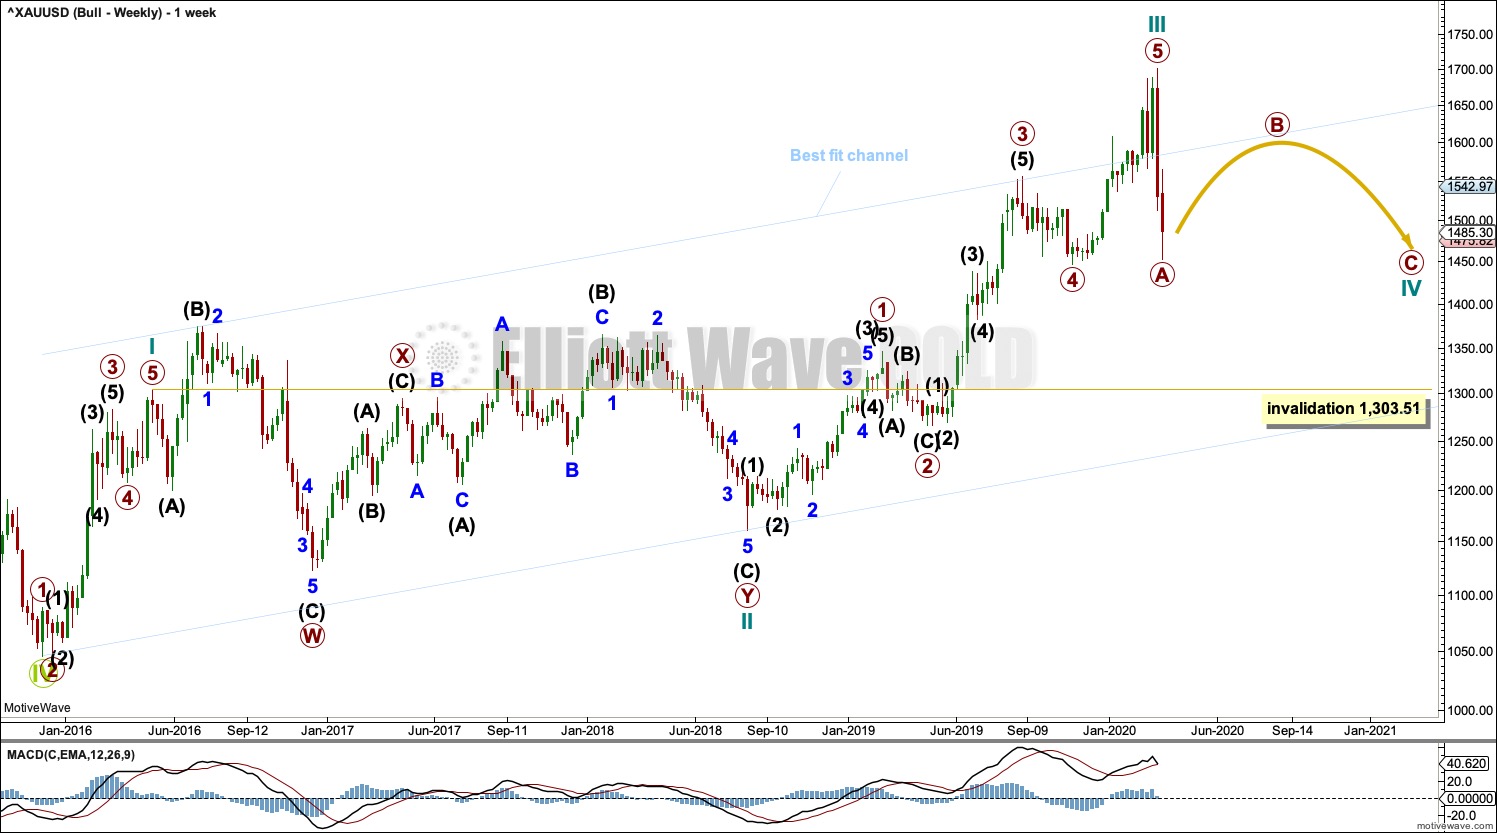
This wave count sees the the bear market complete at the last major low for Gold on 3 December 2015.
If Gold is in a new bull market, then it should begin with a five wave structure upwards on the weekly chart.
Cycle wave I fits as a five wave impulse with reasonably proportionate corrections for primary waves 2 and 4. This resolves a previous major problem with the bullish wave count.
Cycle wave II now fits as a double flat. However, a problem arises with the relabelling of this structure. Within the first flat correction labelled primary wave W, this wave count now needs to ignore what looks like an obvious triangle from July to September 2016 (this can be seen labelled as a triangle on the bear wave count above). This movement must now be labelled as a series of overlapping first and second waves.
Within the first flat correction labelled primary wave W of the double flat of cycle wave II, intermediate wave (B) is 1.69 the length of intermediate wave (A). This is longer than the common range of up to 1.38, but within an allowable guideline of up to 2. The length of intermediate wave (B) reduces the probability of this wave count.
Cycle wave III may be complete. Cycle wave IV may not move into cycle wave I price territory below 1,303.51.
DAILY CHART
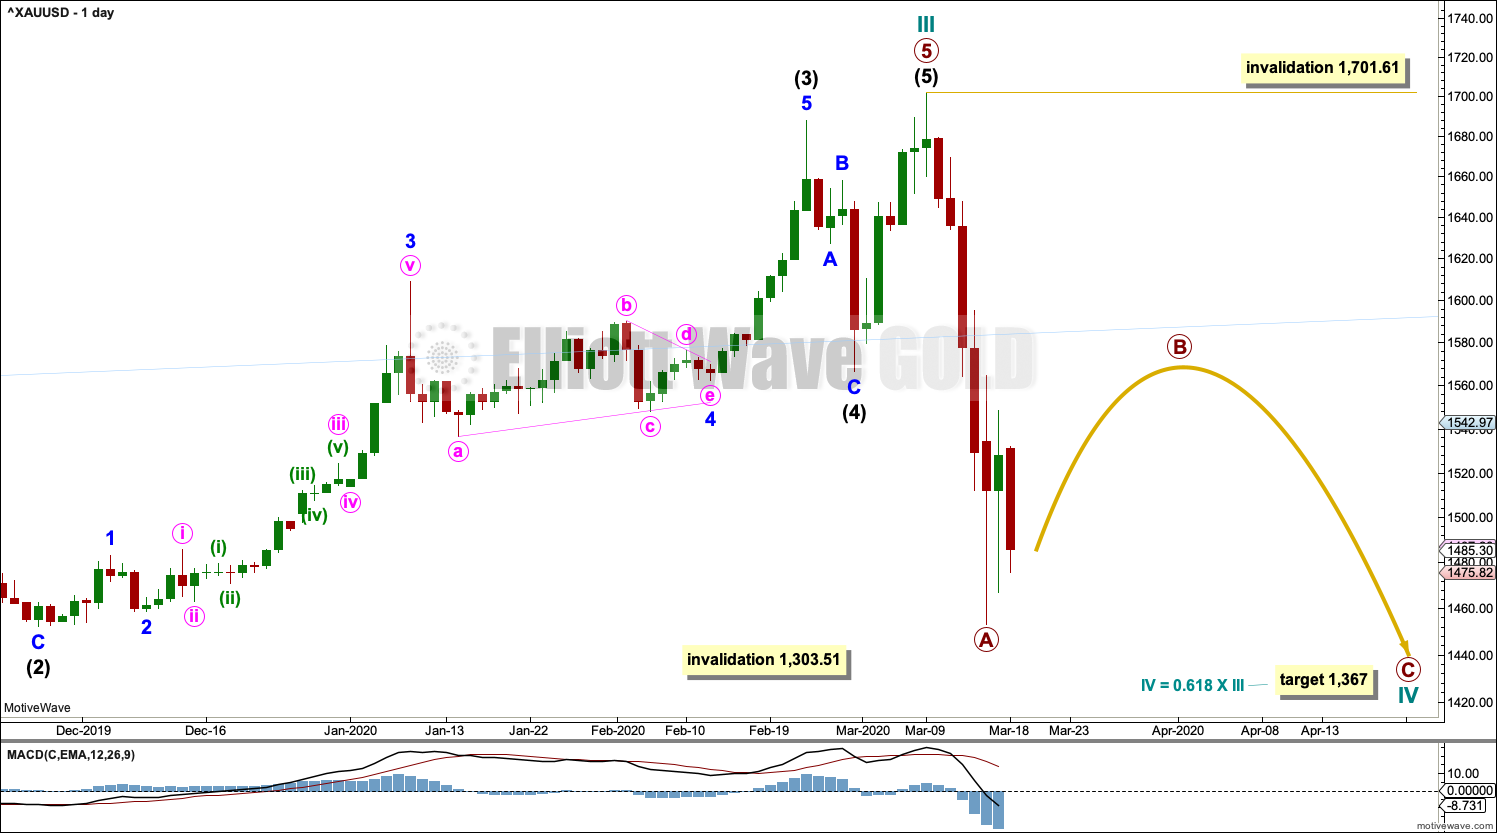
Click chart to enlarge.
Cycle wave III may be complete. Cycle wave IV may not move into cycle wave I price territory below 1,303.51.
Cycle wave II was relatively deep at 0.55 of cycle wave I. If cycle wave IV exhibits alternation in depth, it may more likely be shallow; the first target at 0.382 of cycle wave III would be preferred.
Cycle wave II was a very long lasting double combination. It lasted 119 weeks. Cycle wave IV may most likely be a zigzag, which tend to be quicker structures, but it would still be expected to last several months.
HOURLY CHART
Click chart to enlarge.
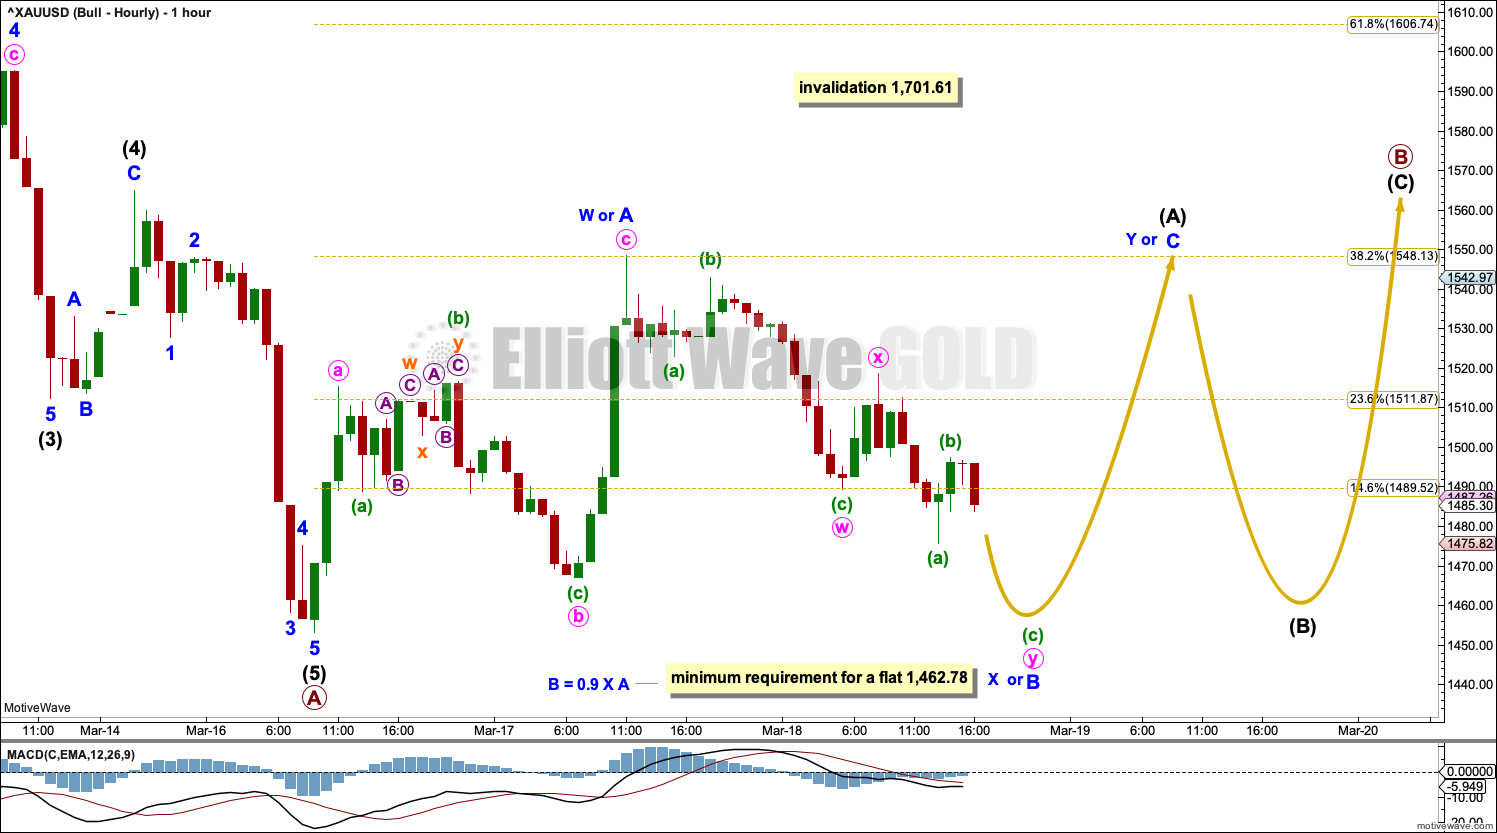
A three up may be expected to follow a five down. This bullish wave count will label it primary wave B.
Primary wave B may subdivide as any corrective Elliott wave structure, including a triangle. Primary wave B may not move beyond the start of primary wave A above 1,701.61.
Primary wave B may subdivide as a double zigzag in the same way that minor wave 2 is labelled on the bearish hourly chart.
This hourly chart considers the possibility that primary wave B may subdivide as a flat, combination or triangle. All of these Elliott wave structures begin with intermediate wave (A) subdividing as a three wave structure.
Intermediate wave (A) may be subdividing as a flat correction or a double zigzag.
If intermediate wave (A) is subdividing as a flat correction, then within it minor wave B must now retrace a minimum 90% of minor wave A at 1,462.78. Minor wave B may make a new low below the start of minor wave A at 1,453.26 as in an expanded flat.
Intermediate wave (A) may be subdividing as a double zigzag. Minor wave W, the first zigzag in a double, may be complete. The double would now be expected to be joined by a three in the opposite direction, which would be labelled minor wave X. There is no minimum requirement for minor wave X and minor wave X may make a new low below the start of minor wave W at 1,453.26.
There is no lower invalidation point for this wave count.
TECHNICAL ANALYSIS
WEEKLY CHART
Click chart to enlarge. Chart courtesy of StockCharts.com.
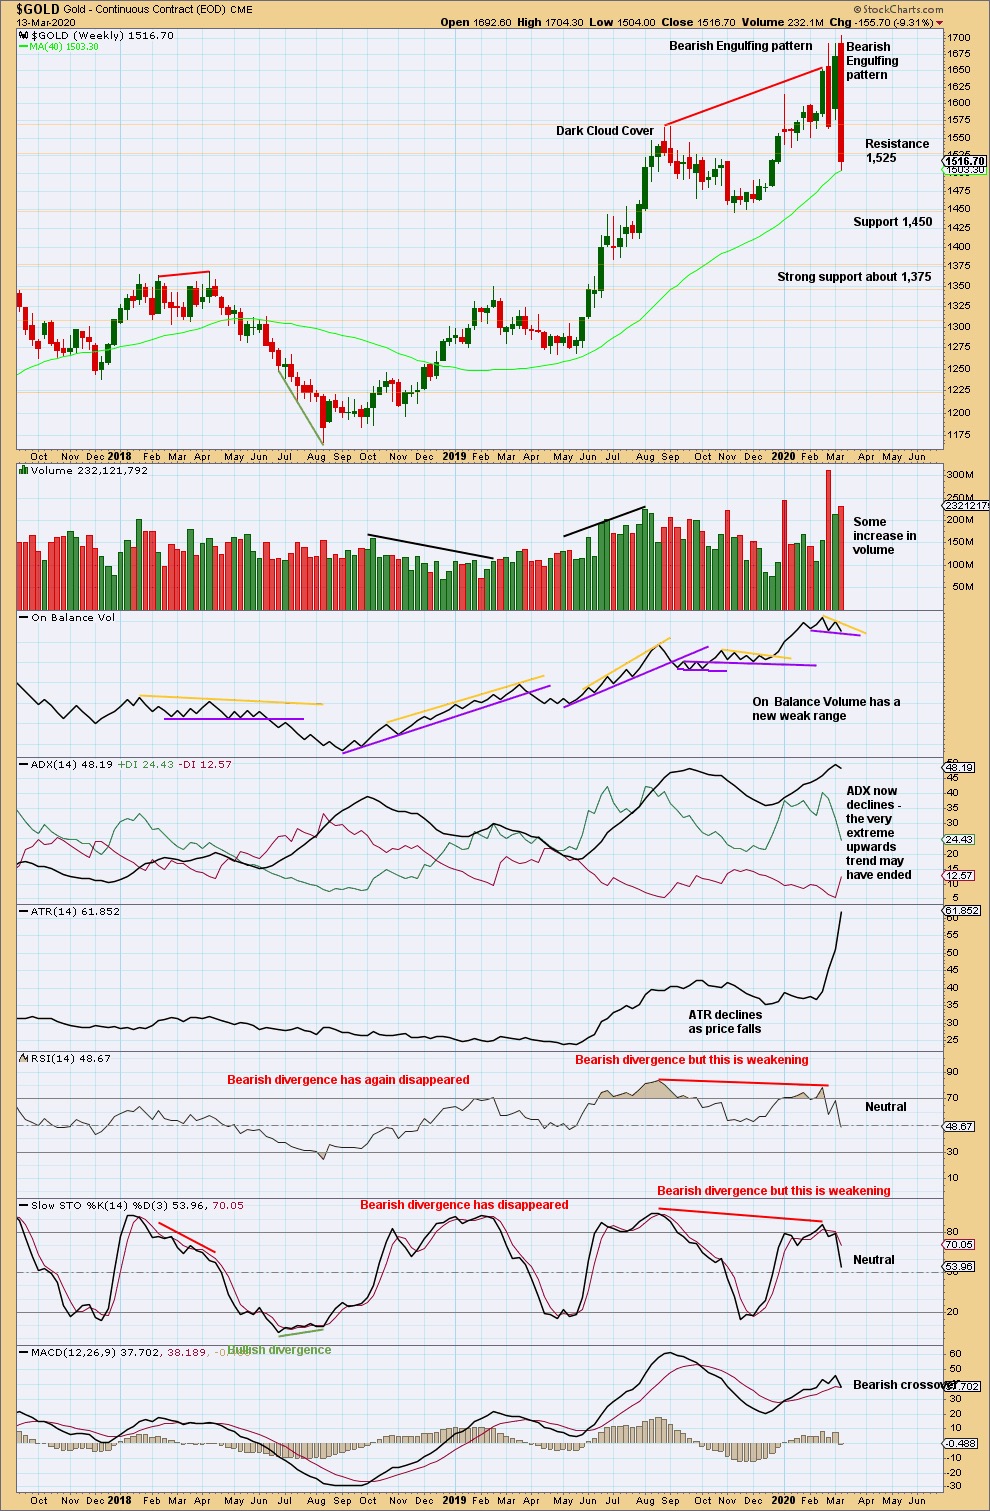
Last week’s Bearish Engulfing pattern is extreme. The pattern fully engulfs the prior nine weekly candlesticks, and it has some support from volume. This strongly indicates a trend change after the upwards trend reached very extreme and conditions reached overbought and exhibited bearish divergence.
Price does not move in straight lines. Look out for bounces and consolidations on the way down. Look for support below about 1,450 to 1,455, and below that very strong support about 1,375.
DAILY CHART
Click chart to enlarge. Chart courtesy of StockCharts.com.
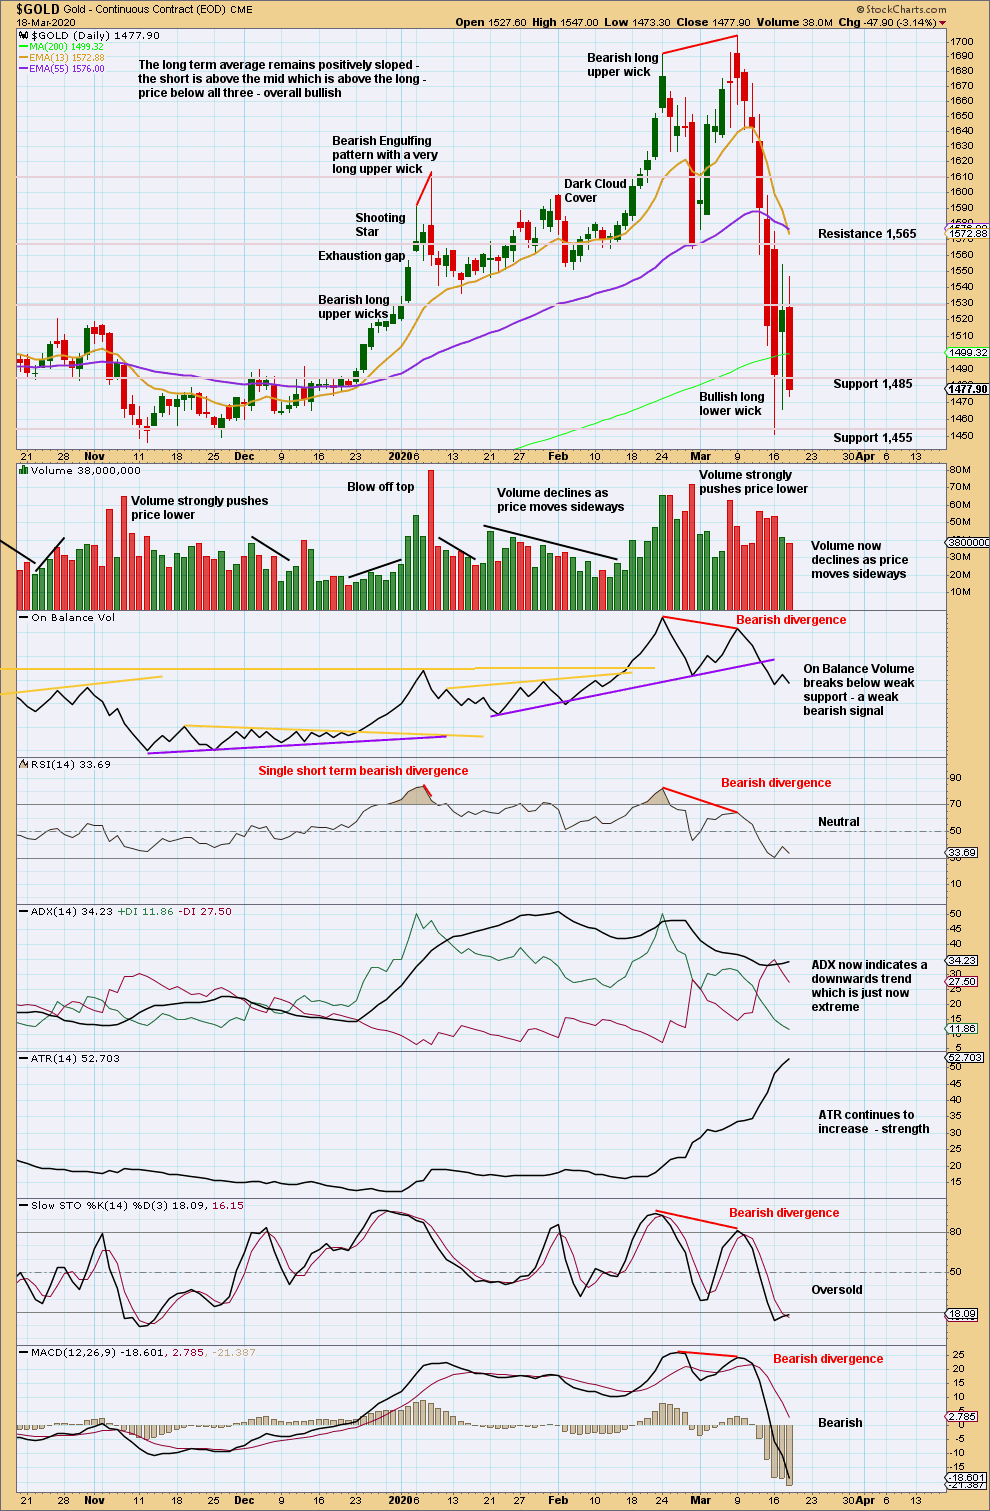
There is now bearish divergence between price and all of On Balance Volume, RSI, Stochastics and MACD. The risk of a trend change to either sideways or a 180° change is high. A new swing low below 1,564 (February 28, 2020) provides some indiction of a possible trend change.
Currently, a sideways consolidation or bounce may be beginning.
GDX WEEKLY CHART
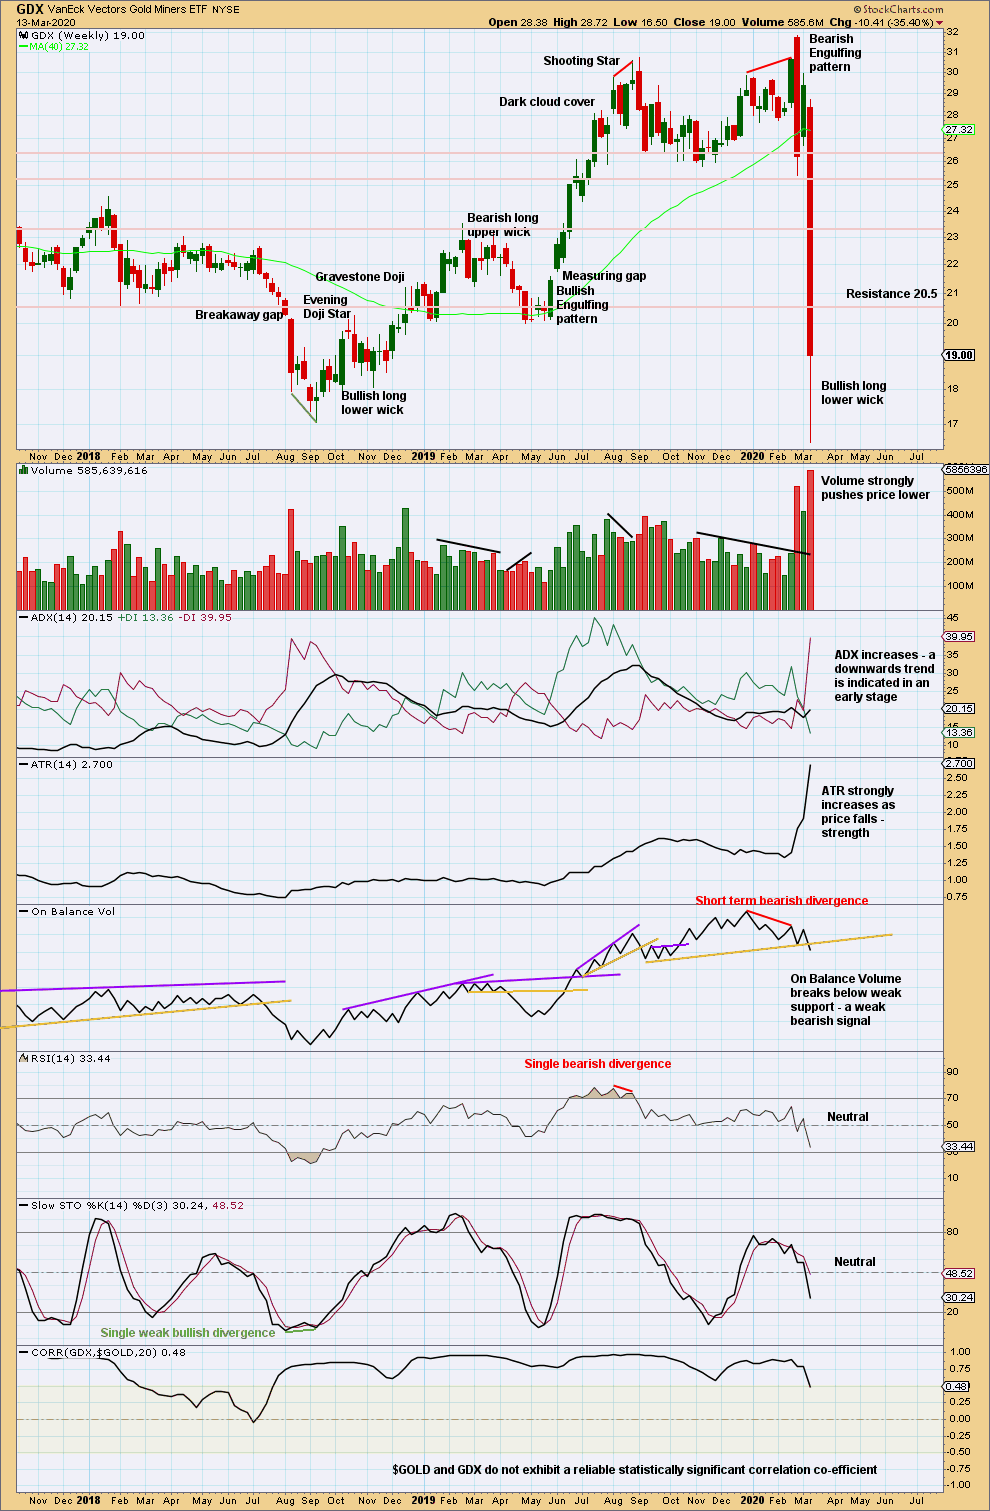
Click chart to enlarge. Chart courtesy of StockCharts.com.
GDX is a reasonable distance off new highs. The last signal was very bearish from a strong Bearish Engulfing pattern.
There is support below in a zone about 16.75 to 15.85. Price has bounced up strongly again within this zone.
GDX DAILY CHART
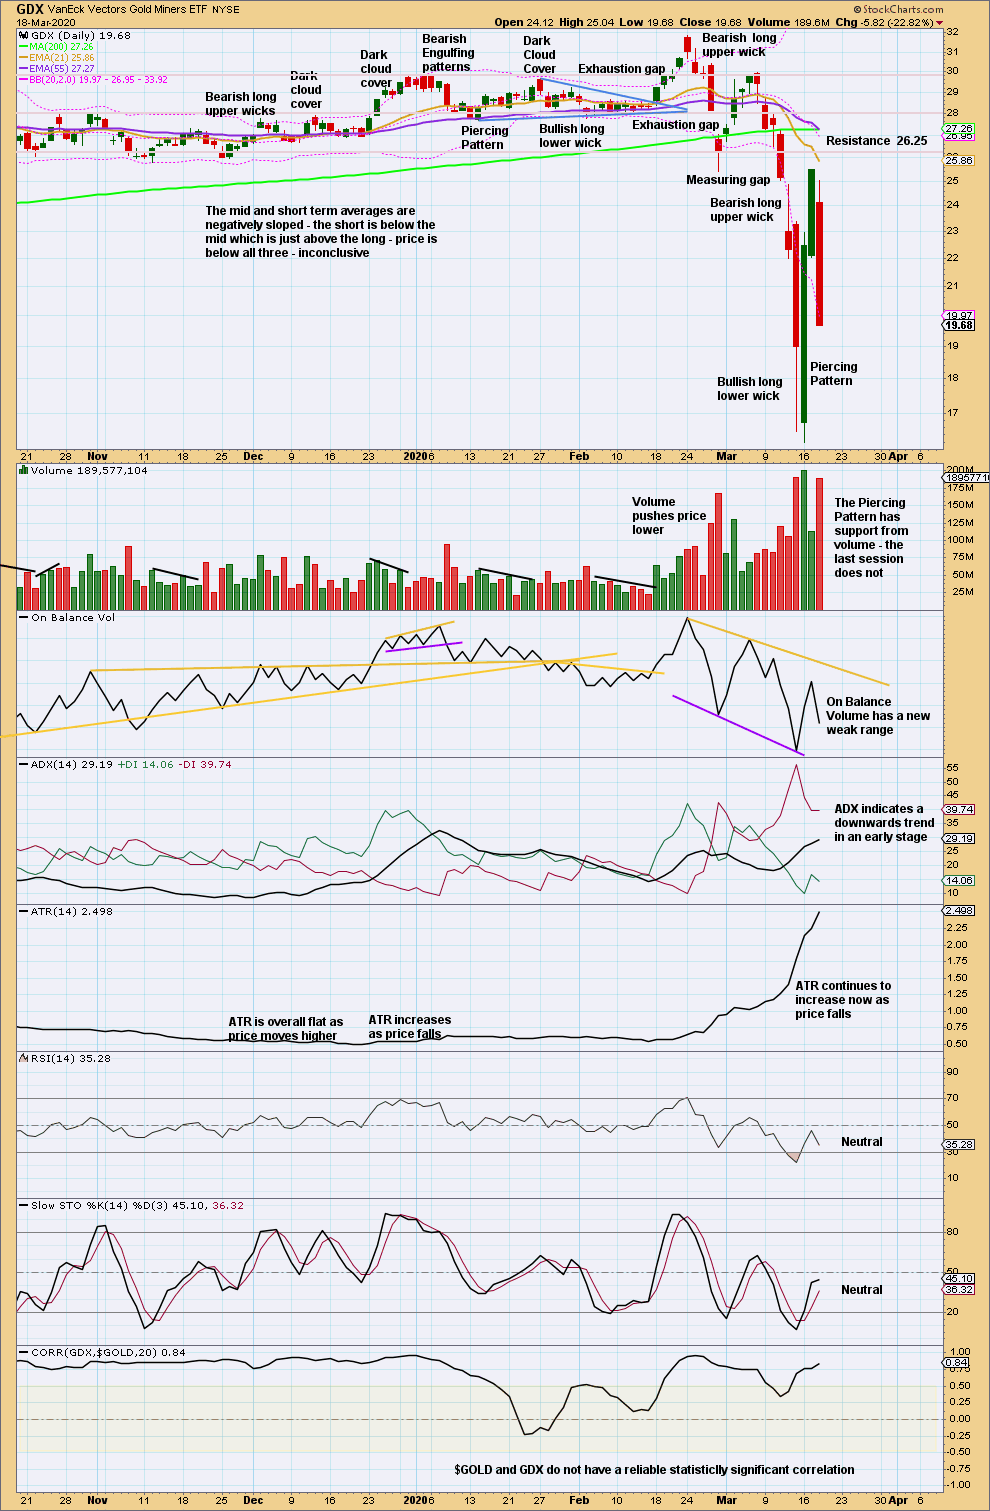
Click chart to enlarge. Chart courtesy of StockCharts.com.
There has been a trend change to downwards. This trend has support from volume pushing price lower and exhibits strength in increasing ATR.
A close at the low for this session with push from volume today suggests more downwards movement tomorrow.
Published @ 08:20 p.m. EST.
—
Careful risk management protects your trading account(s).
Follow my two Golden Rules:
1. Always trade with stops.
2. Risk only 1-5% of equity on any one trade.
—
New updates to this analysis are in bold.
Testing upload image… https://uploads.disquscdn.com/images/8f3df72671d3faf63d530e39bfde7fa1b016a4d3de98fefca481e89a006e7a72.png
Testing Disqus…
someone doesn’t want gold to go up today. Perhaps Minor 2 is done – that’s as high as it going to get!
Hello Lara,
I’m liking your thought process on this possible ath, and how price action can be very volatile on a major trend change. I did a bit of back testing last year, using many charts, but mainly focused on Gold as well as BTC, and i found that the area which always both usually hit on, was a retest was a fib level of – 0.691702, Hope this is of some interest to folks here.
So that higher fib would place the target at 1625.65.
I have sell orders both at 1607.07 & 1625.65, it will be interesting to see how price action plays out over the coming hours / days.
Regards
Chart upload is not working for me either guys. So sorry. Cesar did test last night and it worked. He will work on fixing it now.
Also, the ability to reply is REALLY important. Cesar’s working on that now too….
Thank you all so much for your patience. TBH, we don’t have much else but work to do here in self isolation in Panama, so you may be assured we’re working on it.
Ability to reply fixed.
Tried to post the chart again Chart wouldn’t post. You also can’t delete a comment once you post it, but you can edit it.
Ok, thought I would test posting a chart. Oil looks ripe for a bounce here. Let’s see what happens.
Hmn, couldn’t get the chart to load.
Lara, the new features for the new comments system look promising. Need to explore some more. 1st question, how do you reply to an existing comment?
Hi Lara,
in your main hourly surely Minute X of Minor 2 may go down to the start of Minor 2 @ about 1453 especially as Minute x has gone below your invalidation level of 1475?
Thanks Lara, Hope yous are having a great time, and keeping safe.
You’re very welcome. We are self isolating in a little apartment in Panama City. So far 7 days and we’re still healthy. Will get lots of work done I am sure. Right now, the changing situation and trying to make some plans is a bit overwhelming TBH. There’s a curfew and the borders are closed to incoming foreigners.
I left my surfboard in Texas with family as this visit to Panama was supposed to be for only 3 weeks. So even if we could get to some surf, I’ve nothing to surf on 🙁
New comments system is now active. This is not Disqus, so you do not need a Disqus account to post comments. The only requirement is that you’re logged in to Elliott Wave Gold.
You can add up to 3 photos or videos per comment.
You can also subscribe to a comment to be notified of updates and or new comments.