
BTCUSD: Elliott Wave and Technical Analysis | Charts – August 5, 2021
Last Bitcoin analysis, on July 29, 2021, expected a consolidation or pullback. This is a mid-term expectation and the consolidation or pullback may last a few more months.
Summary: Technical analysis indicates strong support for the last lows. The most likely scenario for the short to mid term may be the formation of a large triangle for a few more months, before an upwards breakout.
A new low below 28,893.621 would invalidate the triangle Elliott wave count and indicate a deeper pullback may be completing. A target would then be at 21,685 or 18,587.
The data used for this analysis comes from Yahoo Finance BTC-USD.
Monthly and weekly charts are on a semi-log scale. The close up daily chart is on an arithmetic scale.
For notes on identifying highs and lows for Bitcoin, see this article here.
MAIN ELLIOTT WAVE COUNT
MONTHLY
Click chart to enlarge.
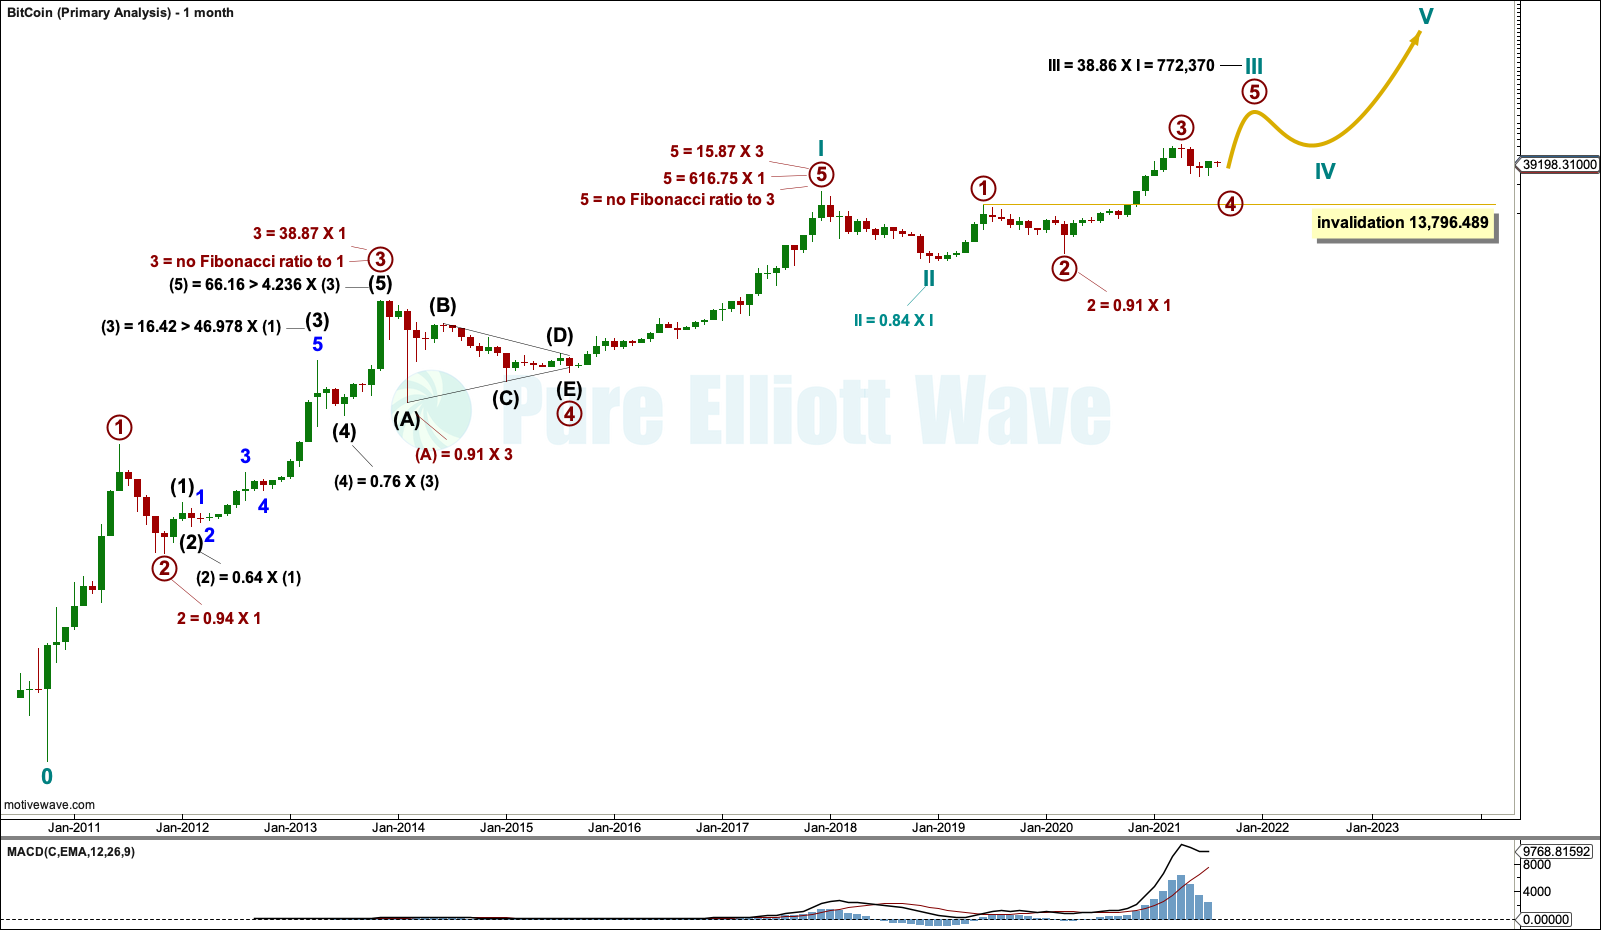
It is possible to see a completed five wave impulse upwards for Bitcoin to the high in December 2017. This has been followed by a deep three wave structure downwards to the low in December 2018.
I am unable to find many reasonable Fibonacci ratios within this wave count. It appears that Bitcoin may not exhibit Fibonacci ratios very often between its actionary waves, so this makes target calculation impossible. Classic technical analysis was used to identify a high in place on December 23, 2017.
What is very clear from this chart is that Bitcoin forms classic bubbles. It has done so now several times and is now doing so again. So far each bubble has popped and Bitcoin has collapsed, to then thereafter form a new bubble. Each bubble is larger than the one prior; so if another Bitcoin bubble is forming, it may be expected to take price substantially above the all time high.
Bitcoin tends to behave like an extreme commodity: price moves upwards for about 2 – 4 weeks in a near vertical movement at the end of its rises. Following this vertical movement the resulting downwards movement is very deep (in percentage terms) and often very quick.
The next rise begins slowly with basing action over weeks or months, and then as the rise nears its end another vertical movement completes it. Also, there are volume spikes just before or at the end, which is another feature typical of commodity like behaviour.
This has happened now several times. The most notable instances are the rise up to the week ending 24th November 2013, the week ending 5th June 2011, the high on 17th December 2017 at 19,870.62 and the high on 26th June 2019 at 13,796. The following sharp drops were 94%, 93%, 84% and 91%, respectively.
WEEKLY
Click chart to enlarge.
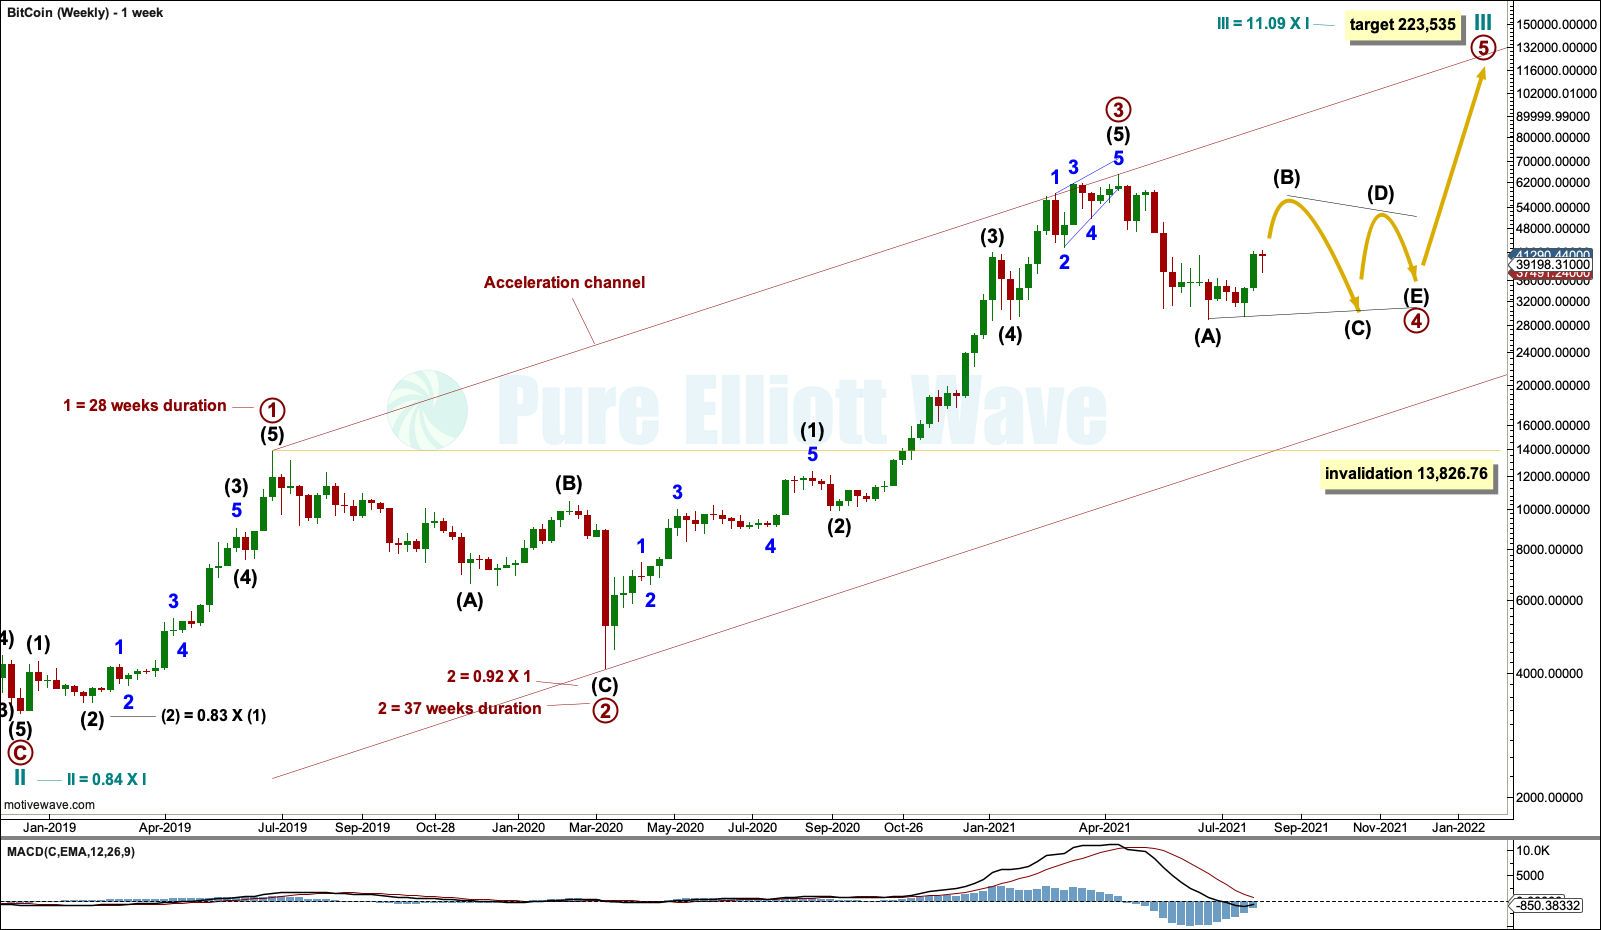
The weekly chart focusses on cycle wave III. Cycle wave III may only subdivide as an impulse. Within the impulse: Primary waves 1, 2 and 3 may now be complete, and primary wave 4 may now be underway.
Primary wave 4 may subdivide as any one of more than 23 possible corrective structures. It is impossible to be confident of the structure of a fourth wave until it is over; alternate wave counts and flexibility are essential during corrections. When primary wave 4 may be complete, then an upwards breakout would be expected for primary wave 5. Primary wave 5 would very likely be longer than primary wave 3 by many multiples; it is common for this market for its fifth waves to be very long.
Primary wave 4 may not move into primary wave 1 price territory below 13,826.76.
Draw an Elliott channel about cycle wave III (weekly charts are drawn on a semi-log scale). Draw the first trend line from the ends of primary waves 1 to 3, then place a parallel copy on the end of primary wave 2. If it is long lasting or deep enough, then primary wave 4 may find support about the lower edge of the channel. The same channel is drawn on daily charts, but daily charts are drawn on an arithmetic scale and the trend channel sits differently.
DAILY – FIRST
Click chart to enlarge.
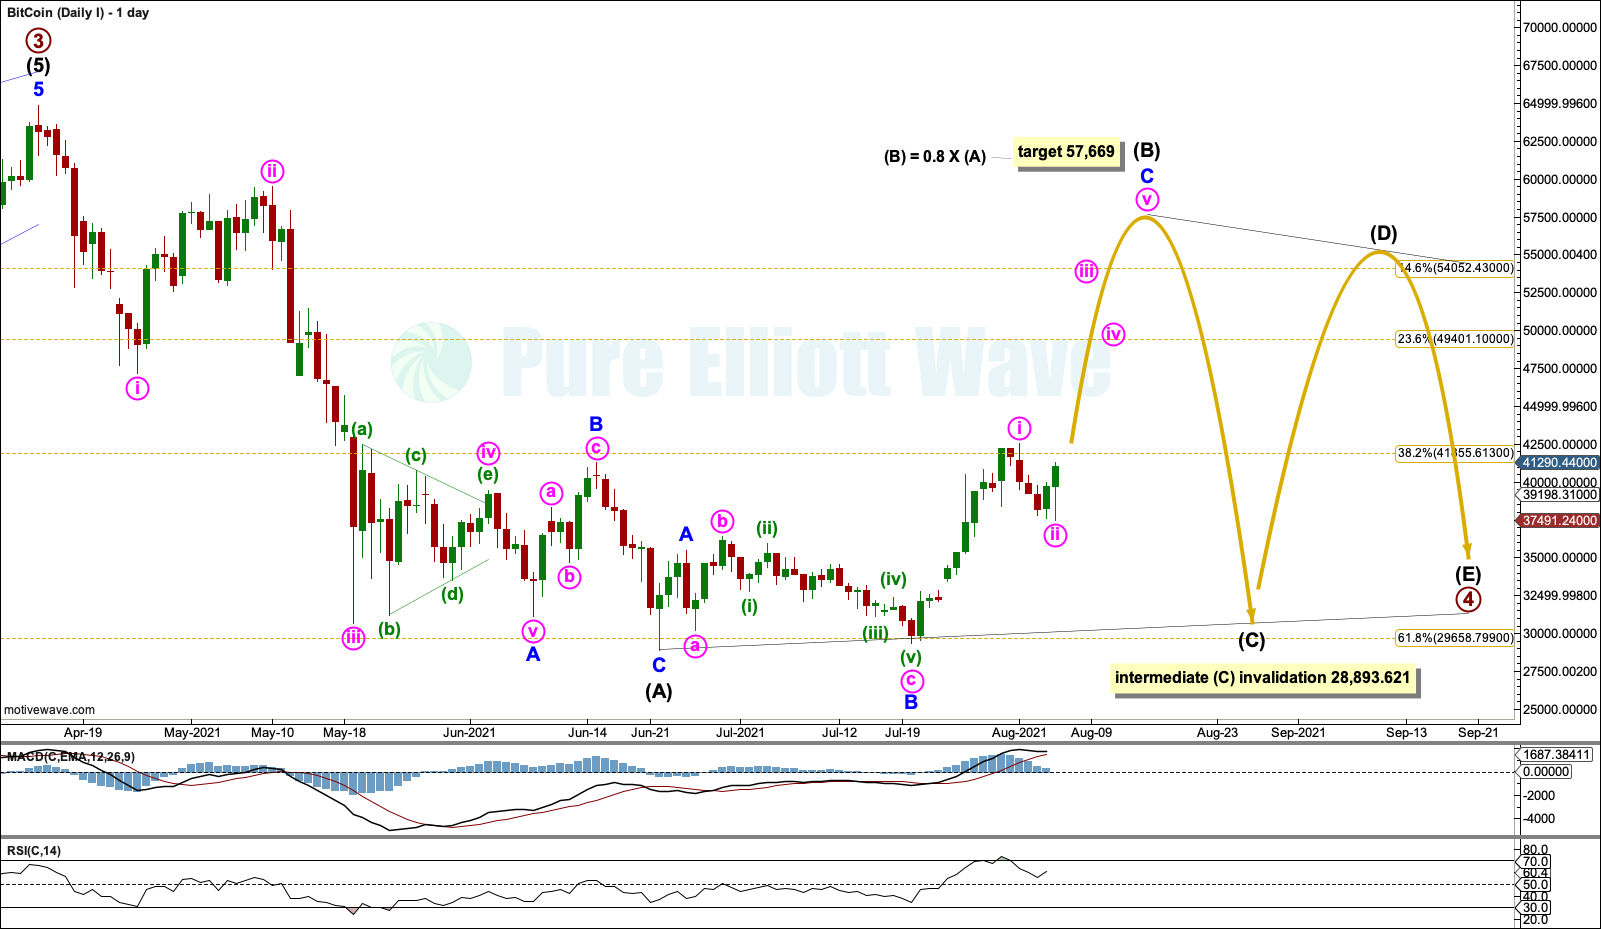
Primary wave 4 looks most likely to subdivide as a triangle if support about 29,000 holds. Technical analysis suggests it may.
The most common type of triangle is a regular contracting triangle, and the most common length for intermediate wave (B) would be 0.8 the length of intermediate wave (A).
If primary wave 4 unfolds as a running triangle, then intermediate wave (B) may make a new price extreme beyond the start of intermediate wave (A) above 64,863.09. A new all time high does not mean that primary wave 4 would definitely be over.
Intermediate wave (C) within a contracting or barrier triangle may not move beyond the end of intermediate wave (A) below 28,893.621.
Intermediate wave (D) within a contracting or barrier triangle may not move reasonably beyond the end of intermediate wave (B).
Intermediate wave (E) within a contracting or barrier triangle may not move beyond the end of intermediate wave(C).
A triangle may take many months to complete.
DAILY – SECOND
Click chart to enlarge.
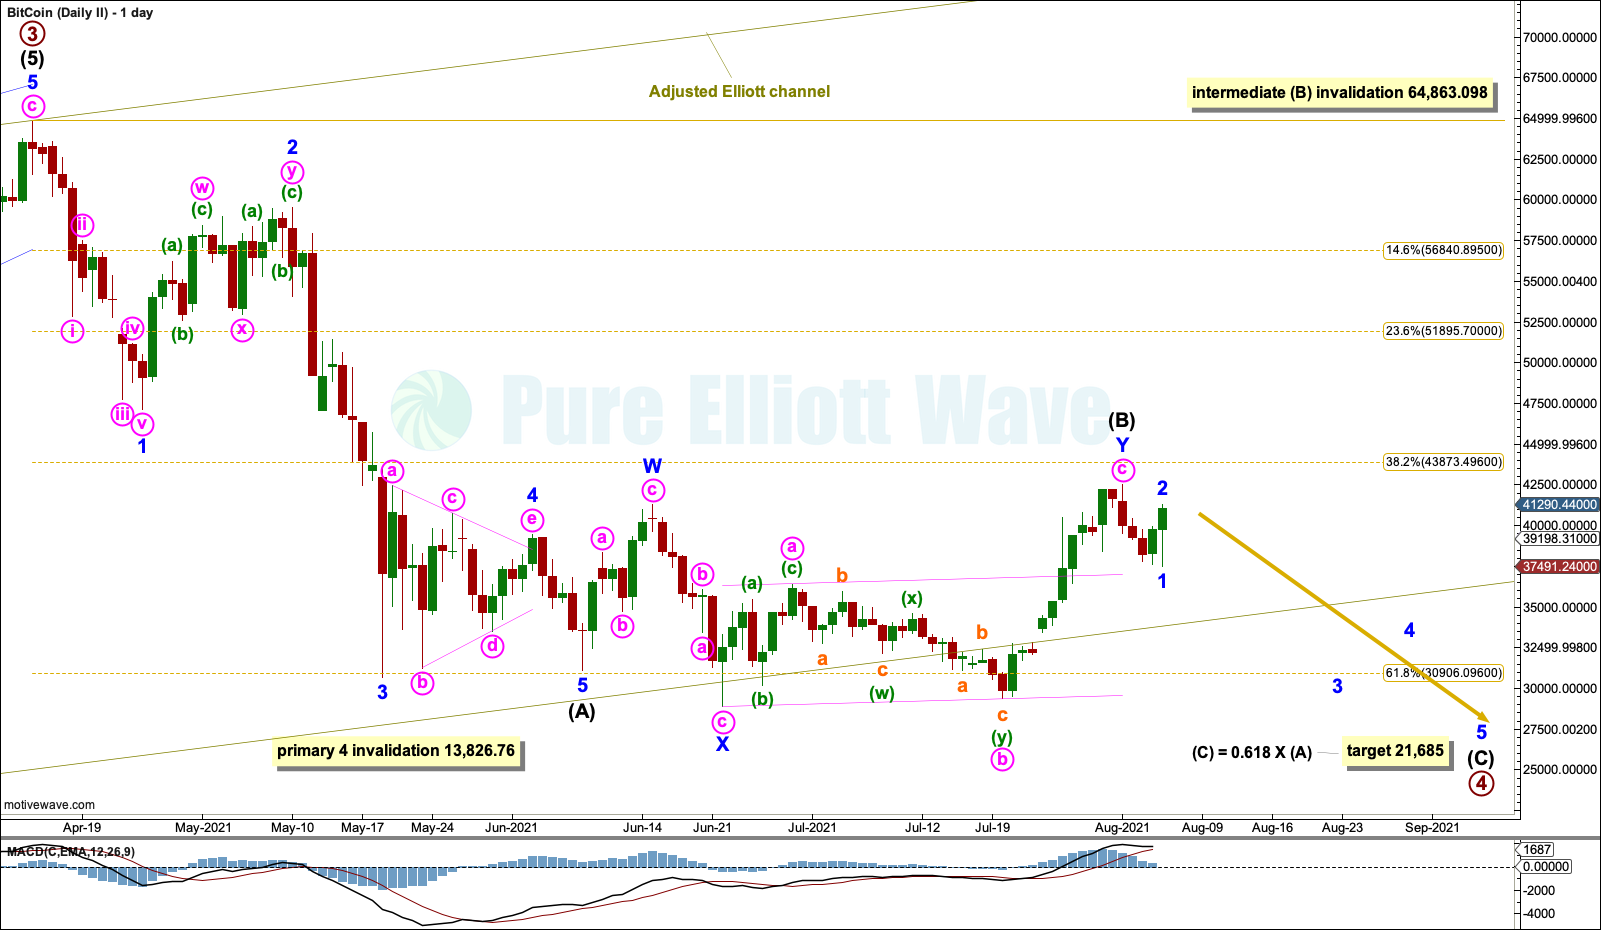
A new low below 28,893.621 would invalidate the first daily Elliott wave count and leave the second and third wave counts valid.
Primary wave 4 may subdivide as a single zigzag. Since primary wave 2 subdivided as a single zigzag, then this would provide no alternation in structure; however, alternation is a guideline and not a rule, and not always seen. A zigzag is the most common corrective structure by a wide margin, so this wave count must be considered as a possibility.
A target is calculated for intermediate wave (C) to end.
DAILY – THIRD
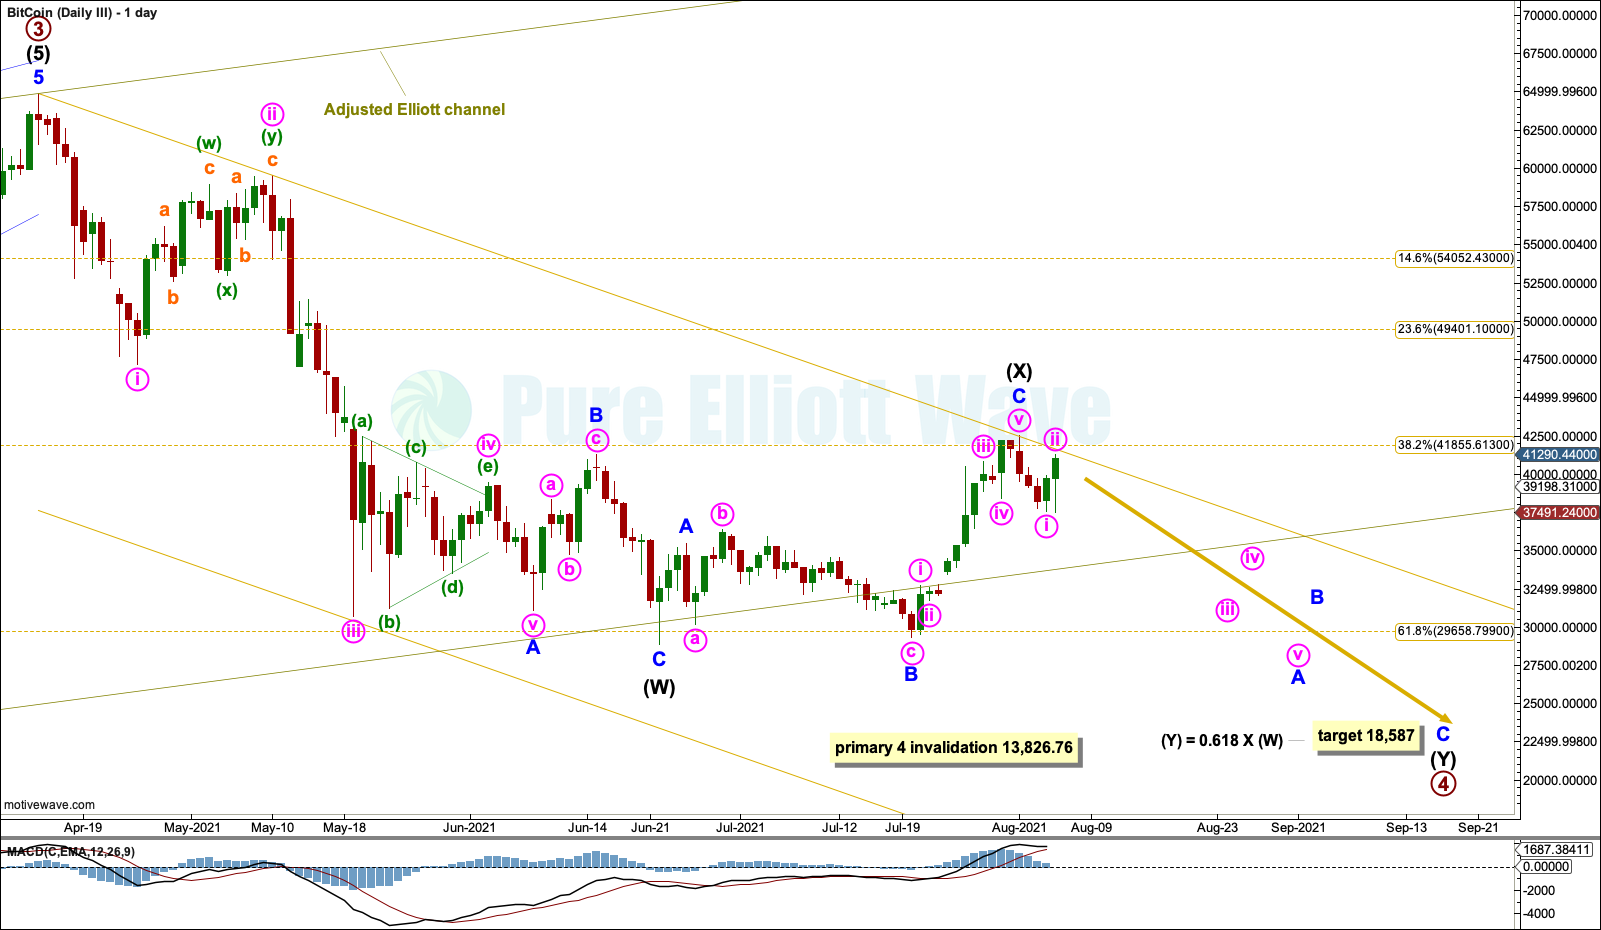
Click chart to enlarge.
It is also possible that primary wave 4 may subdivide as a double zigzag. A target is calculated for intermediate wave (Y) to end.
TECHNICAL ANALYSIS
MONTHLY
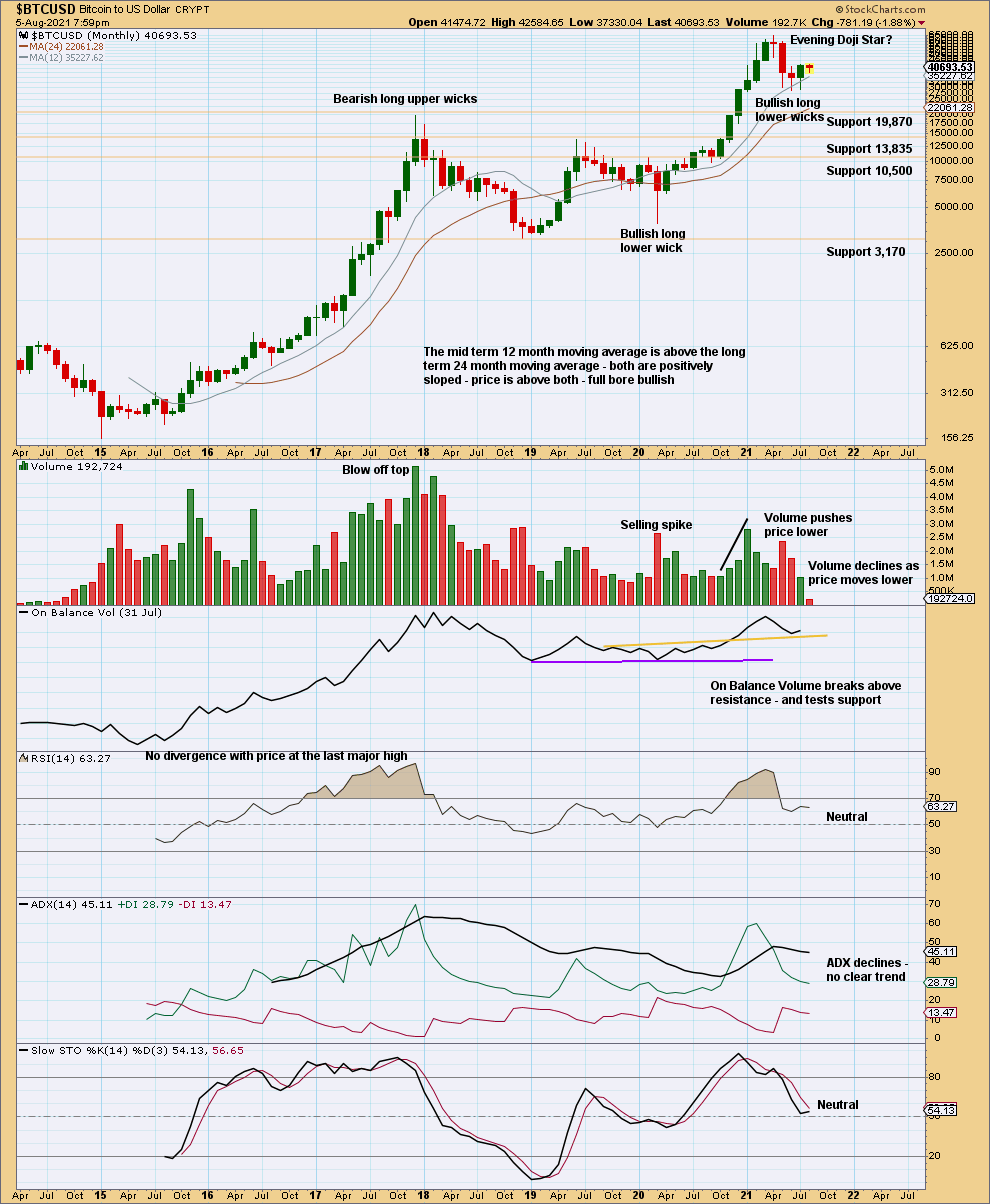
Click chart to enlarge.
Bullish long lower wicks and On Balance Volume at support suggest a floor of support may hold about 28,900.
WEEKLY
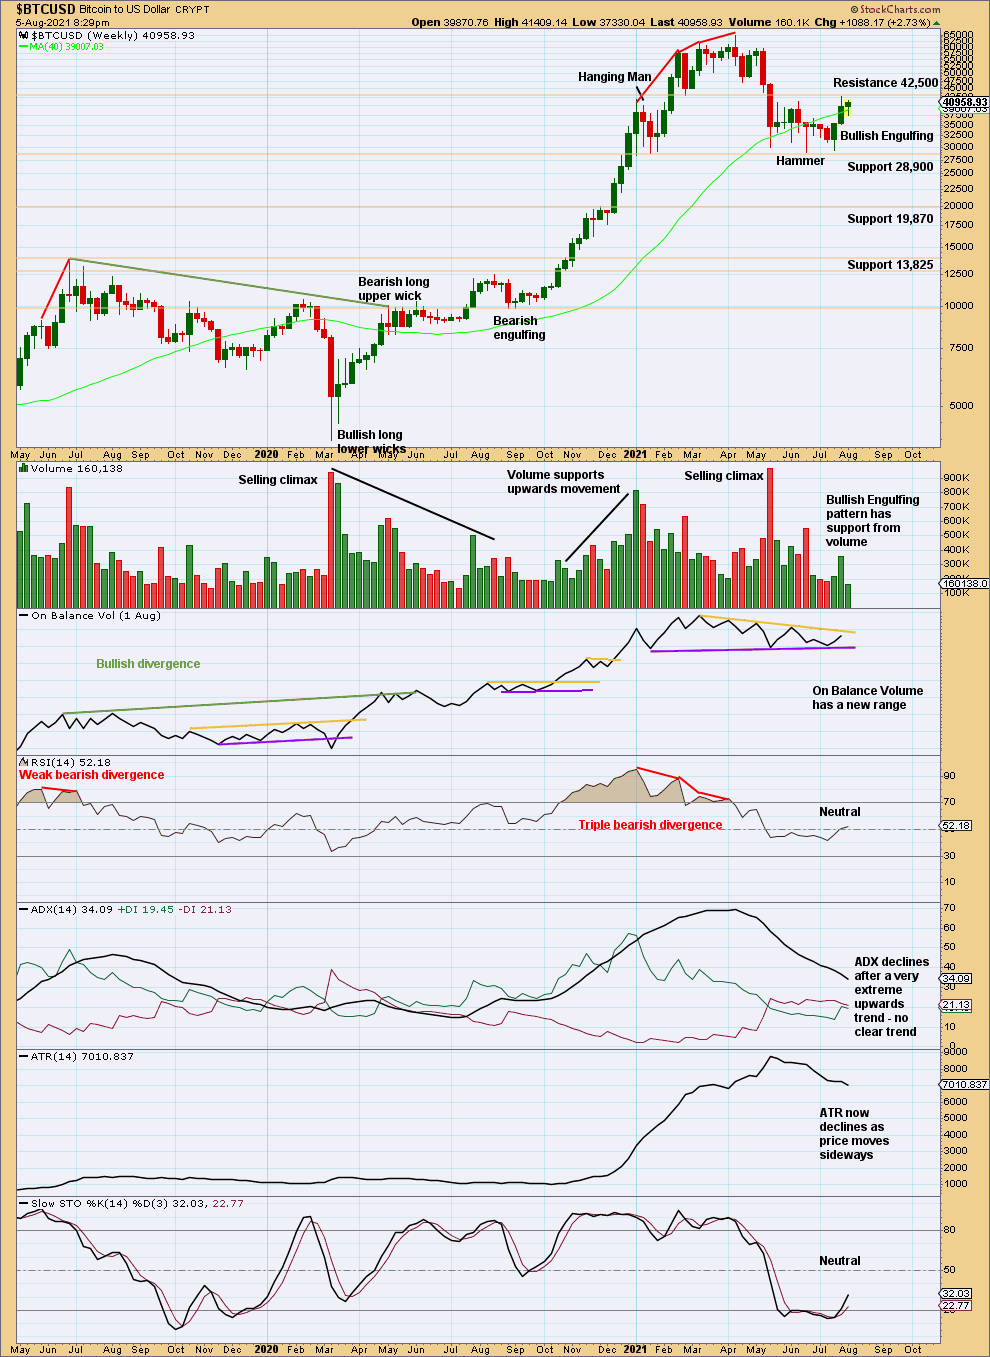
Click chart to enlarge.
The prior upwards trend reached very extreme. Now support is holding strong about 28,900. Watch On Balance carefully for a signal soon.
DAILY
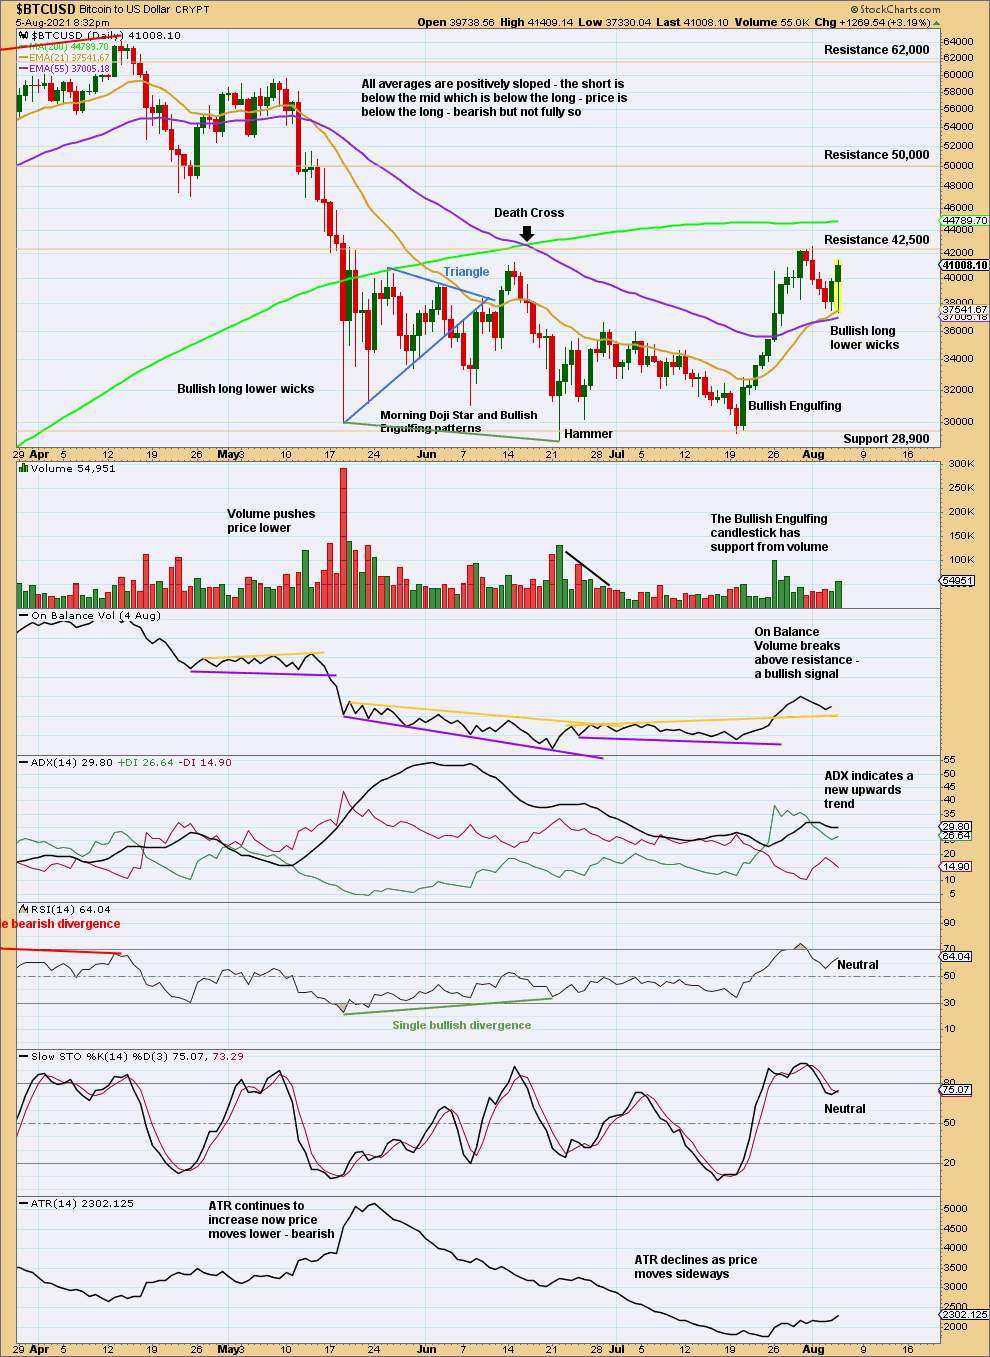
Click chart to enlarge.
Bullish candlestick patterns appear at the last three lows, and long lower wicks appear at the first four. Support is strong about 28,900. Bullish divergence at the low of June 22, 2021, between price and RSI after RSI neared oversold, strongly suggests a low may be in for Bitcoin.
Published @ 05:17 p.m. EST.
—
Careful risk management protects your investments.
Follow my two Golden Rules:
1. Invest only funds you can afford to lose.
2. Have an exit plan for both directions – where or when to take profit, and when to exit a losing investment.
—
New updates to this analysis are in bold.