by Lara | Sep 18, 2020 | Gold
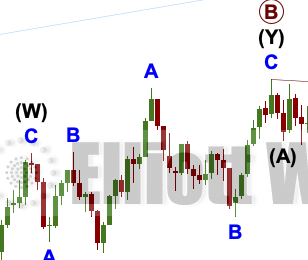
GOLD: Elliott Wave and Technical Analysis | Charts – September 18, 2020 For a fifth week now price has moved sideways in a triangle pattern. There has still been no breakout. Summary: On Balance Volume suggests an upwards breakout from the triangle may be...
by Lara | Sep 18, 2020 | US Oil, US Oil Historical
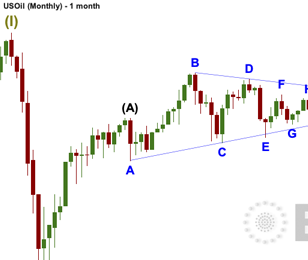
US OIL: Elliott Wave and Technical Analysis | Charts – September 18, 2020 A bounce this week remains below the short-term invalidation point. Volume supports the Elliott wave count. Summary: Oil may have found a major sustainable low. A multi-week pullback is...
by Lara | Sep 17, 2020 | Gold
GOLD: Elliott Wave and Technical Analysis | Charts – September 17, 2020 There has still been no breakout from the triangle. Two Elliott wave counts consider both possible breakout directions. Summary: On Balance Volume suggests an upwards breakout from the...
by Lara | Sep 16, 2020 | Gold
GOLD: Elliott Wave and Technical Analysis | Charts – September 16, 2020 Price remains constrained within triangle trend lines, but On Balance Volume has broken out, which may indicate the direction for a breakout from price to come soon. Summary: On Balance...
by Lara | Sep 15, 2020 | Gold
GOLD: Elliott Wave and Technical Analysis | Charts – September 15, 2020 A triangle continues sideways. Today On Balance Volume gives a signal on Gold that is clear and suggests the direction of the breakout from the triangle. Summary: On Balance Volume suggests...
by Lara | Sep 14, 2020 | Gold
GOLD: Elliott Wave and Technical Analysis | Charts – September 14, 2020 Price has still not broken out of a triangle pattern. Elliott wave counts are considered for both possible breakout directions. Summary: The pullback may be over. The upwards trend may...
by Lara | Sep 12, 2020 | Silver
SILVER: Elliott Wave and Technical Analysis | Charts – September 11, 2020 All week price has moved sideways to complete a doji candlestick. A triangle pattern is identified. Summary: Both Elliott wave counts expect a downwards breakout from the triangle pattern....
by Lara | Sep 11, 2020 | Gold, Lara's Weekly, S&P500, US Oil
Lara’s Weekly: Elliott Wave and Technical Analysis of S&P500 and Gold and US Oil | Charts – September 11, 2020 S&P 500 At the end of the week, signals from VIX and the AD line suggest the direction for price when markets open next week. Summary:...
by Lara | Sep 11, 2020 | Gold
GOLD: Elliott Wave and Technical Analysis | Charts – September 11, 2020 All week price has continued to move sideways within a triangle pattern. Main and alternate Elliott wave counts consider both possible breakout directions. Summary: The pullback may be over....
